View exported data in Azure Monitor
After you've set up continuous export of Microsoft Defender for Cloud security alerts and recommendations, you can view the data in Azure Monitor. This article describes how to view the data in Log Analytics or in Azure Event Hubs.
Prerequisites
- Setup continuous export in the Azure portal or setup continuous export with Azure Policy or setup continuous export with REST API.
View exported alerts and recommendations in Azure Monitor
Azure Monitor provides a unified alerting experience for various Azure alerts, including a diagnostic log, metric alerts, and custom alerts that are based on Log Analytics workspace queries.
To view alerts and recommendations from Defender for Cloud in Azure Monitor, configure an alert rule that's based on Log Analytics queries (a log alert rule).
To configure an alert rule:
Sign in to the Azure portal.
Search for and select Monitor.
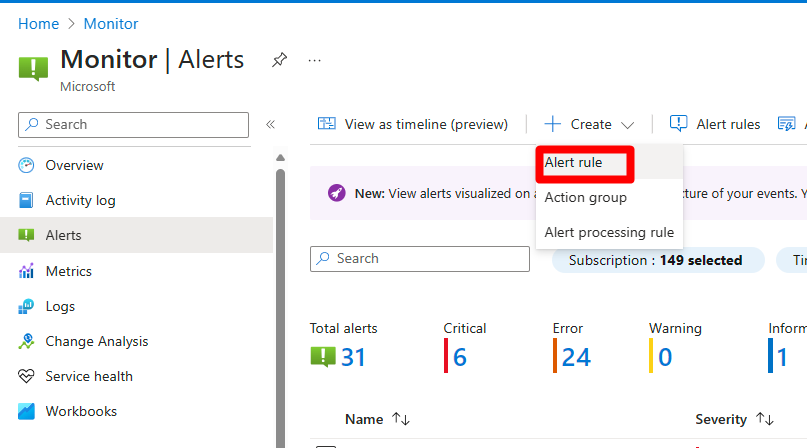
Select Alerts.
Select New alert rule.
Set up your new rule the same way you'd configure a log alert rule in Azure Monitor:
For Resource, select the Log Analytics workspace to which you exported security alerts and recommendations.
For Condition, select Custom log search. In the page that appears, configure the query, lookback period, and frequency period. In the search query, you can enter SecurityAlert or SecurityRecommendation to query the data types that Defender for Cloud continuously exports to as you enable the continuous export to Log Analytics feature.
Optionally, create an action group to trigger. Action groups can automate sending an email, creating an ITSM ticket, running a webhook, and more, based on an event in your environment.
The Defender for Cloud alerts or recommendations appear (depending on your configured continuous export rules and the condition that you defined in your Azure Monitor alert rule) in Azure Monitor alerts, with automatic triggering of an action group (if provided).
