Microsoft Defender for IoT alerts enhance your network security and operations with real-time details about events logged in your network. This article describes how to manage Microsoft Defender for IoT alerts on the Azure portal, including alerts generated by OT and Enterprise IoT network sensors.
Integrate with Microsoft Sentinel to view Defender for IoT alerts in Microsoft Sentinel and manage them together with security incidents.
If you have Enterprise IoT securityturned on in Microsoft Defender XDR, alerts for Enterprise IoT devices detected by Microsoft Defender for Endpoint are available in Defender for Endpoint only.
To manage alerts on the Azure portal, you must have access as a Security Admin, Contributor, or Owner. Alert management activities include modifying their statuses or severities, Learning an alert, accessing PCAP data, or using alert suppression rules.
Note: A value of Micro-agent indicates that the event was triggered by the Defender for IoT Device Builder platform.
Last detection
The last time the alert was detected.
- If an alert's status is New, and the same traffic is seen again, the Last detection time is updated for the same alert. - If the alert's status is Closed and traffic is seen again, the Last detection time is not updated, and a new alert is triggered.
Note: While the sensor console displays an alert's Last detection field in real-time, Defender for IoT in the Azure portal may take up to one hour to display the updated time. This explains a scenario where the last detection time in the sensor console isn't the same as the last detection time in the Azure portal.
To view more details, select the Edit columns button.
In the Edit columns pane on the right, select Add Column and any of the following extra columns:
Column
Description
Source device address
The IP address of the source device.
Destination device address
The IP address of the destination device.
Destination device
The destination IP or MAC address, or the destination device name.
First detection
The first time the alert was detected in the network.
Id
The unique alert ID, aligned with the ID on the sensor console.
Note: If the alert was merged with other alerts from sensors that detected the same alert, the Azure portal displays the alert ID of the first sensor that generated the alerts.
Last activity
The last time the alert was changed, including manual updates for severity or status, or automated changes for device updates or device/alert deduplication
Protocol
The protocol detected in the network traffic for the alert.
Sensor
The sensor that detected the alert.
Zone
The zone assigned to the sensor that detected the alert.
Category
The category associated with the alert, such as operational issues, custom alerts, or illegal commands.
Type
The internal name of the alert.
Vihje
If you're seeing more alerts than expected, you might want to create suppression rules to prevent alerts from being triggered for legitimate network activity. For more information, see Suppress irrelevant alerts.
Filter alerts displayed
Use the Search box, Time range, and Add filter options to filter the alerts displayed by specific parameters or to help locate a specific alert.
For example, filter alerts by Category:
Group alerts displayed
Use the Group by menu at the top-right to collapse the grid into subsections according to specific parameters.
For example, while the total number of alerts appears above the grid, you might want more specific information about alert count breakdown, such as the number of alerts with a specific severity, protocol, or site.
Supported grouping options include Engine, Name, Sensor, Severity, and Site.
View details and remediate a specific alert
On the Alerts page, select an alert in the grid to display more details in the pane on the right. The alert details pane includes the alert description, traffic source and destination, and more.
Select View full details to drill down further. For example:
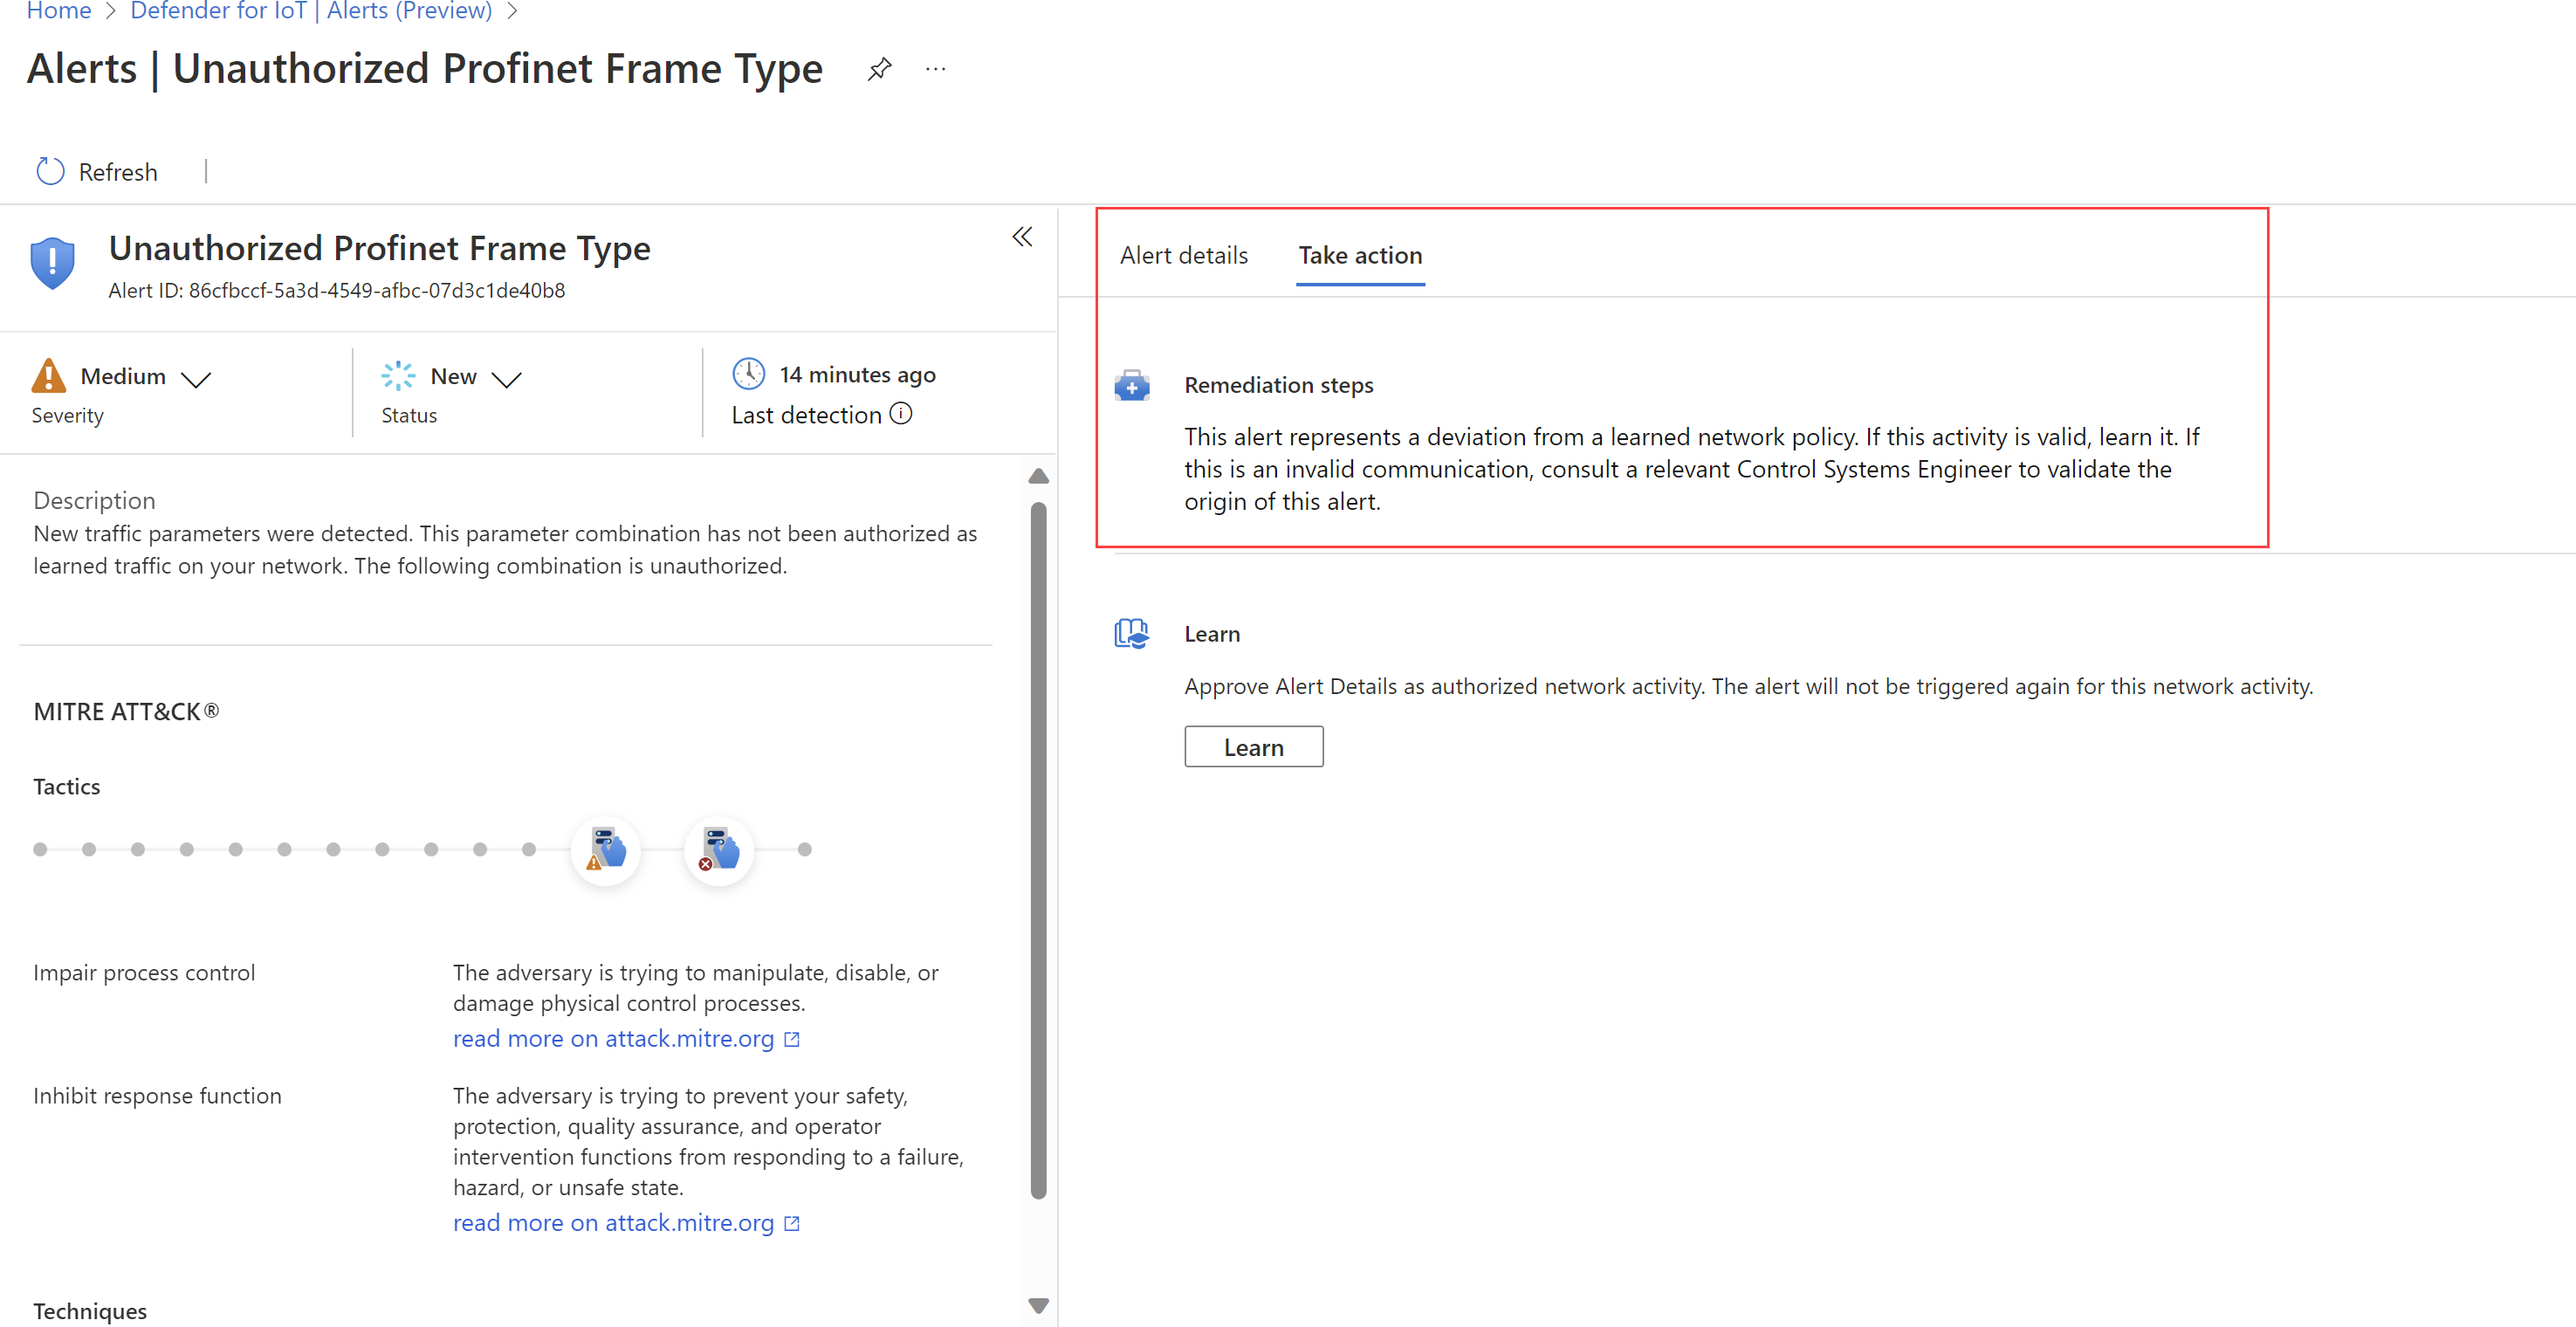
The alert details page provides more details about the alert, and a set of remediation steps on the Take action tab. For example:
Manage alert severity and status
We recommend that you update alert severity In Defender for IoT in the Azure portal as soon as you've triaged an alert so that you can prioritize the riskiest alerts as soon as possible. Make sure to update your alert status once you've taken remediation steps so that the progress is recorded.
You can update both severity and status for a single alert or for a selection of alerts in bulk.
Learn an alert to indicate to Defender for IoT that the detected network traffic is authorized. Learned alerts aren't triggered again the next time the same traffic is detected on your network. Learning is supported only for selected alerts, and unlearning is supported only from the OT network sensor.
In Defender for IoT in the Azure portal, select the Alerts page on the left, and then select an alert in the grid.
Either on the details pane on the right, or in an alert details page itself, select the new status and/or severity.
To manage multiple alerts in bulk:
In Defender for IoT in the Azure portal, select the Alerts page on the left, and then select the alerts in the grid that you want to modify.
Use the Change status and/or Change severity options in the toolbar to update the status and/or the severity for all the selected alerts.
To learn one or more alerts:
In Defender for IoT in the Azure portal, select the Alerts page on the left, and then do one of the following:
Select one or more learnable alerts in the grid and then select Learn in the toolbar.
On an alert details page for a learnable alert, in the Take Action tab, select Learn.
Access alert PCAP data
You might want to access raw traffic files, also known as packet capture files or PCAP files as part of your investigation. If you're a SOC or OT security engineer, access PCAP files directly from the Azure portal to help you investigate faster.
To access raw traffic files for your alert, select Download PCAP in the top-left corner of your alert details page.
For example:
The portal requests the file from the sensor that detected the alert and downloads it to your Azure storage.
Downloading the PCAP file can take several minutes, depending on the quality of your sensor connectivity.
Export alerts to a CSV file
You might want to export a selection of alerts to a CSV file for offline sharing and reporting.
In Defender for IoT on the Azure portal, select the Alerts page on the left.
Use the search box and filter options to show only the alerts you want to export.
In the toolbar above the grid, select Export > Confirm.
The file is generated, and you're prompted to save it locally.
Remediate aggregated alert violations
To reduce alert fatigue, multiple versions of the same alert violation with identical parameters are listed as one alert item in the Alerts page. As you investigate alerts, an aggregated alert is identified by the Multiple violations message that appears under the Source device IP. Use the Violations tab to investigate further and the Take action tab to remediate the alerts.
On the Alerts page, select an alert in the grid to display more details in the pane on the right.
For an aggregated alert the Multiple violations message appears underneath the Source device IP address, and the Violations tab is displayed.
Select the Violations tab.
Select Export to download the CSV data file. Open the file and examine the data.
Select the Take action tab. Follow the Remediation steps.
Select Learn, if needed. For more information, see learning an alert.
This tutorial describes how to use the Microsoft Sentinel data connector and solution for Microsoft Defender for IoT to secure your entire environment. Detect and respond to threats, including multistage attacks that may cross IT and OT boundaries.
This tutorial describes how to integrate Microsoft Sentinel and Microsoft Defender for IoT with the Microsoft Sentinel data connector to secure your entire environment. Detect and respond to threats, including multistage attacks that may cross IT and OT boundaries.