Muistiinpano
Tämän sivun käyttö edellyttää valtuutusta. Voit yrittää kirjautua sisään tai vaihtaa hakemistoa.
Tämän sivun käyttö edellyttää valtuutusta. Voit yrittää vaihtaa hakemistoa.
The client analyzer produces a report in HTML format. Learn how to review the report to identify potential sensor issues so that you can troubleshoot them.
Example output
In this example, the Defender for Endpoint Client Analyzer produced information about a device that was onboarded to an expired Org ID and failed to reach a required Defender for Endpoint URL:
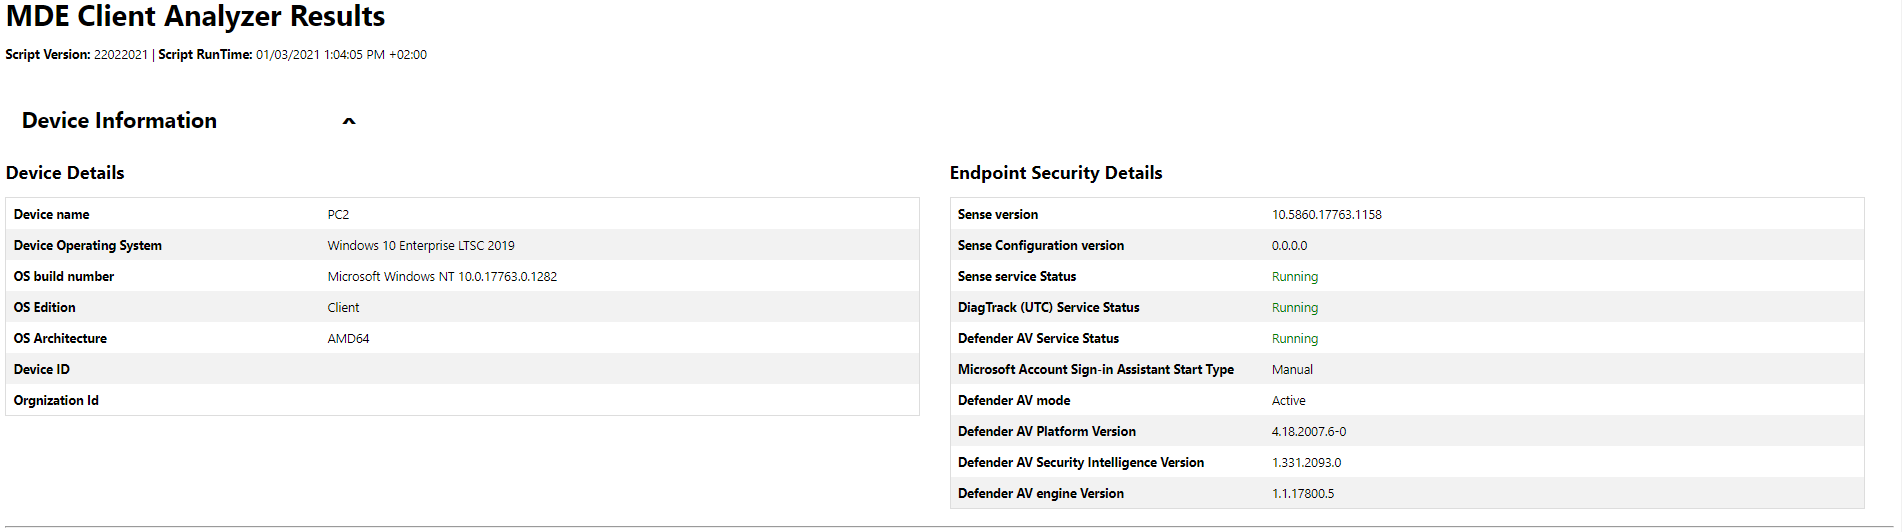
At the top, the script version and script runtime are listed for reference.
The Device Information section provides basic operating system and device identifiers to uniquely identify the device on which the analyzer has run.
The Endpoint Security Details provides general information about Microsoft Defender for Endpoint-related processes including Microsoft Defender Antivirus and the sensor process. If important processes aren't online as expected, the color changes to red.
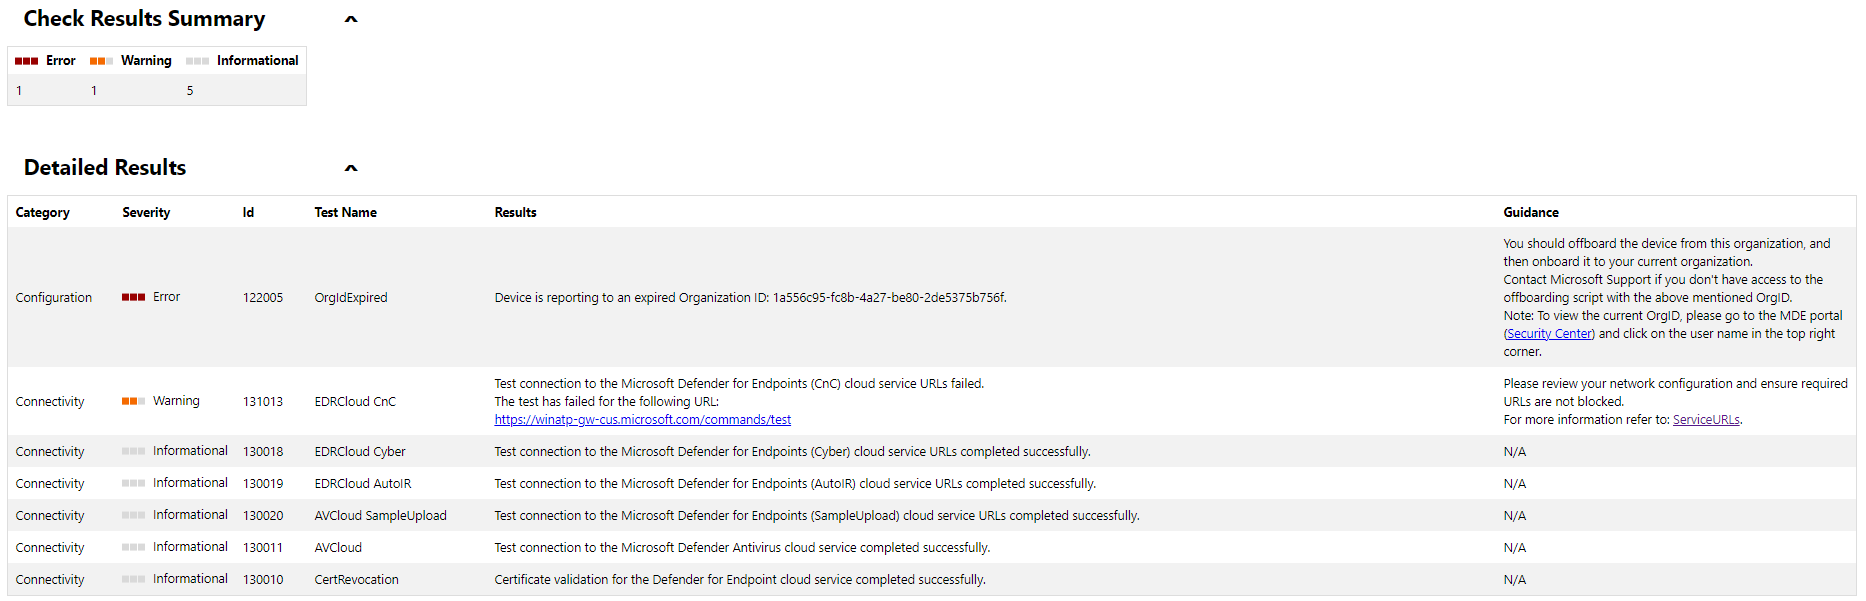
On Check Results Summary, there's an aggregated count for error, warning, or informational events detected by the analyzer.
On Detailed Results, there's a list, sorted by severity, with the results and the guidance based on the observations made by the analyzer.
Open a support ticket to Microsoft and include the Analyzer results
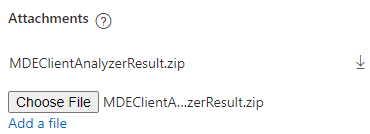
To include analyzer result files when opening a support ticket, make sure you use the Attachments section and include the MDEClientAnalyzerResult.zip file:
Note
If the file size is larger than 25 MB, the support engineer assigned to your case will provide a dedicated secure workspace to upload large files for analysis.