Intune reports
Microsoft Intune reports allow you to more effectively and proactively monitor the health and activity of endpoints across your organization, and also provides other reporting data across Intune. For example, you'll be able to see reports about device compliance, device health, and device trends. In addition, you can create custom reports to obtain more specific data.
Note
The Intune reporting changes will roll out gradually over a period of time to help you prepare and adapt to the new structure.
The report types are organized into the following focus areas:
- Operational - Provides timely, targeted data that helps you focus and take action. Admins, subject matter experts, and helpdesk will find these reports most helpful.
- Organizational - Provides a broader summary of an overall view, such as device management state. Managers and admins will find these reports most helpful.
- Historical - Provides patterns and trends over a period of time. Managers and admins will find these reports most helpful.
- Specialist - Allows you to use raw data to create your own custom reports. Admins will find these reports most helpful.
The reporting framework provides a consistent and more comprehensive reporting experience. The available reports provide the following functionality:
- Search and sort – You can search and sort across every column, no matter how large the dataset.
- Data paging – You can scan your data based on paging, either page-by-page or by jumping to a specific page.
- Performance - You can quickly generate and view reports created from large tenants.
- Export – You can quickly export reporting data generated from large tenants.
Note
Intune can maintain your report search results when exporting report data. For example, when you use the Noncompliant devices report, set the OS filter to "Windows", and search for "PC", the exported data will only contain Windows devices with "PC" in their name. This capability is also available when calling the ExportJobs API directly.
Who can access the data?
Users with the following permissions can review logs:
- Global Administrator
- Intune Administrator
- Administrators assigned to an Intune role with Read permissions
For more information about administrator permissions, see Types of administrators.
Reporting tiles
The Home, Dashboard, and Apps Overview panes provide updated tiles to show the number of app installation failures for the tenant. You can use the following export ReportName parameters to retrieve the related data:
Export ReportName Parameters:
AppStatusOverview- App overview count as provided for the pie chart on the Apps Overview pane.FailedAppCounts- Failed app counts as provided on the Apps Overview pane, Home pane, and Dashboard pane.TopFailedMobileApps- Top three failed apps as provided on the Apps Overview pane.
Device compliance reports
This set of reports focuses on compliance settings in your policies. You can get a list of all the devices that are noncompliant, review device compliance trends, and see the device names and their individual noncompliant settings.
Tip
You can view a list of all device monitoring reports in Microsoft Intune admin center by selecting Devices > Monitor. The Monitor pane provides reports related to configuration, compliance, enrollment, and software updates. Additionally, there are other reports that you can view, such as Device actions.
Device compliance report (Organizational)
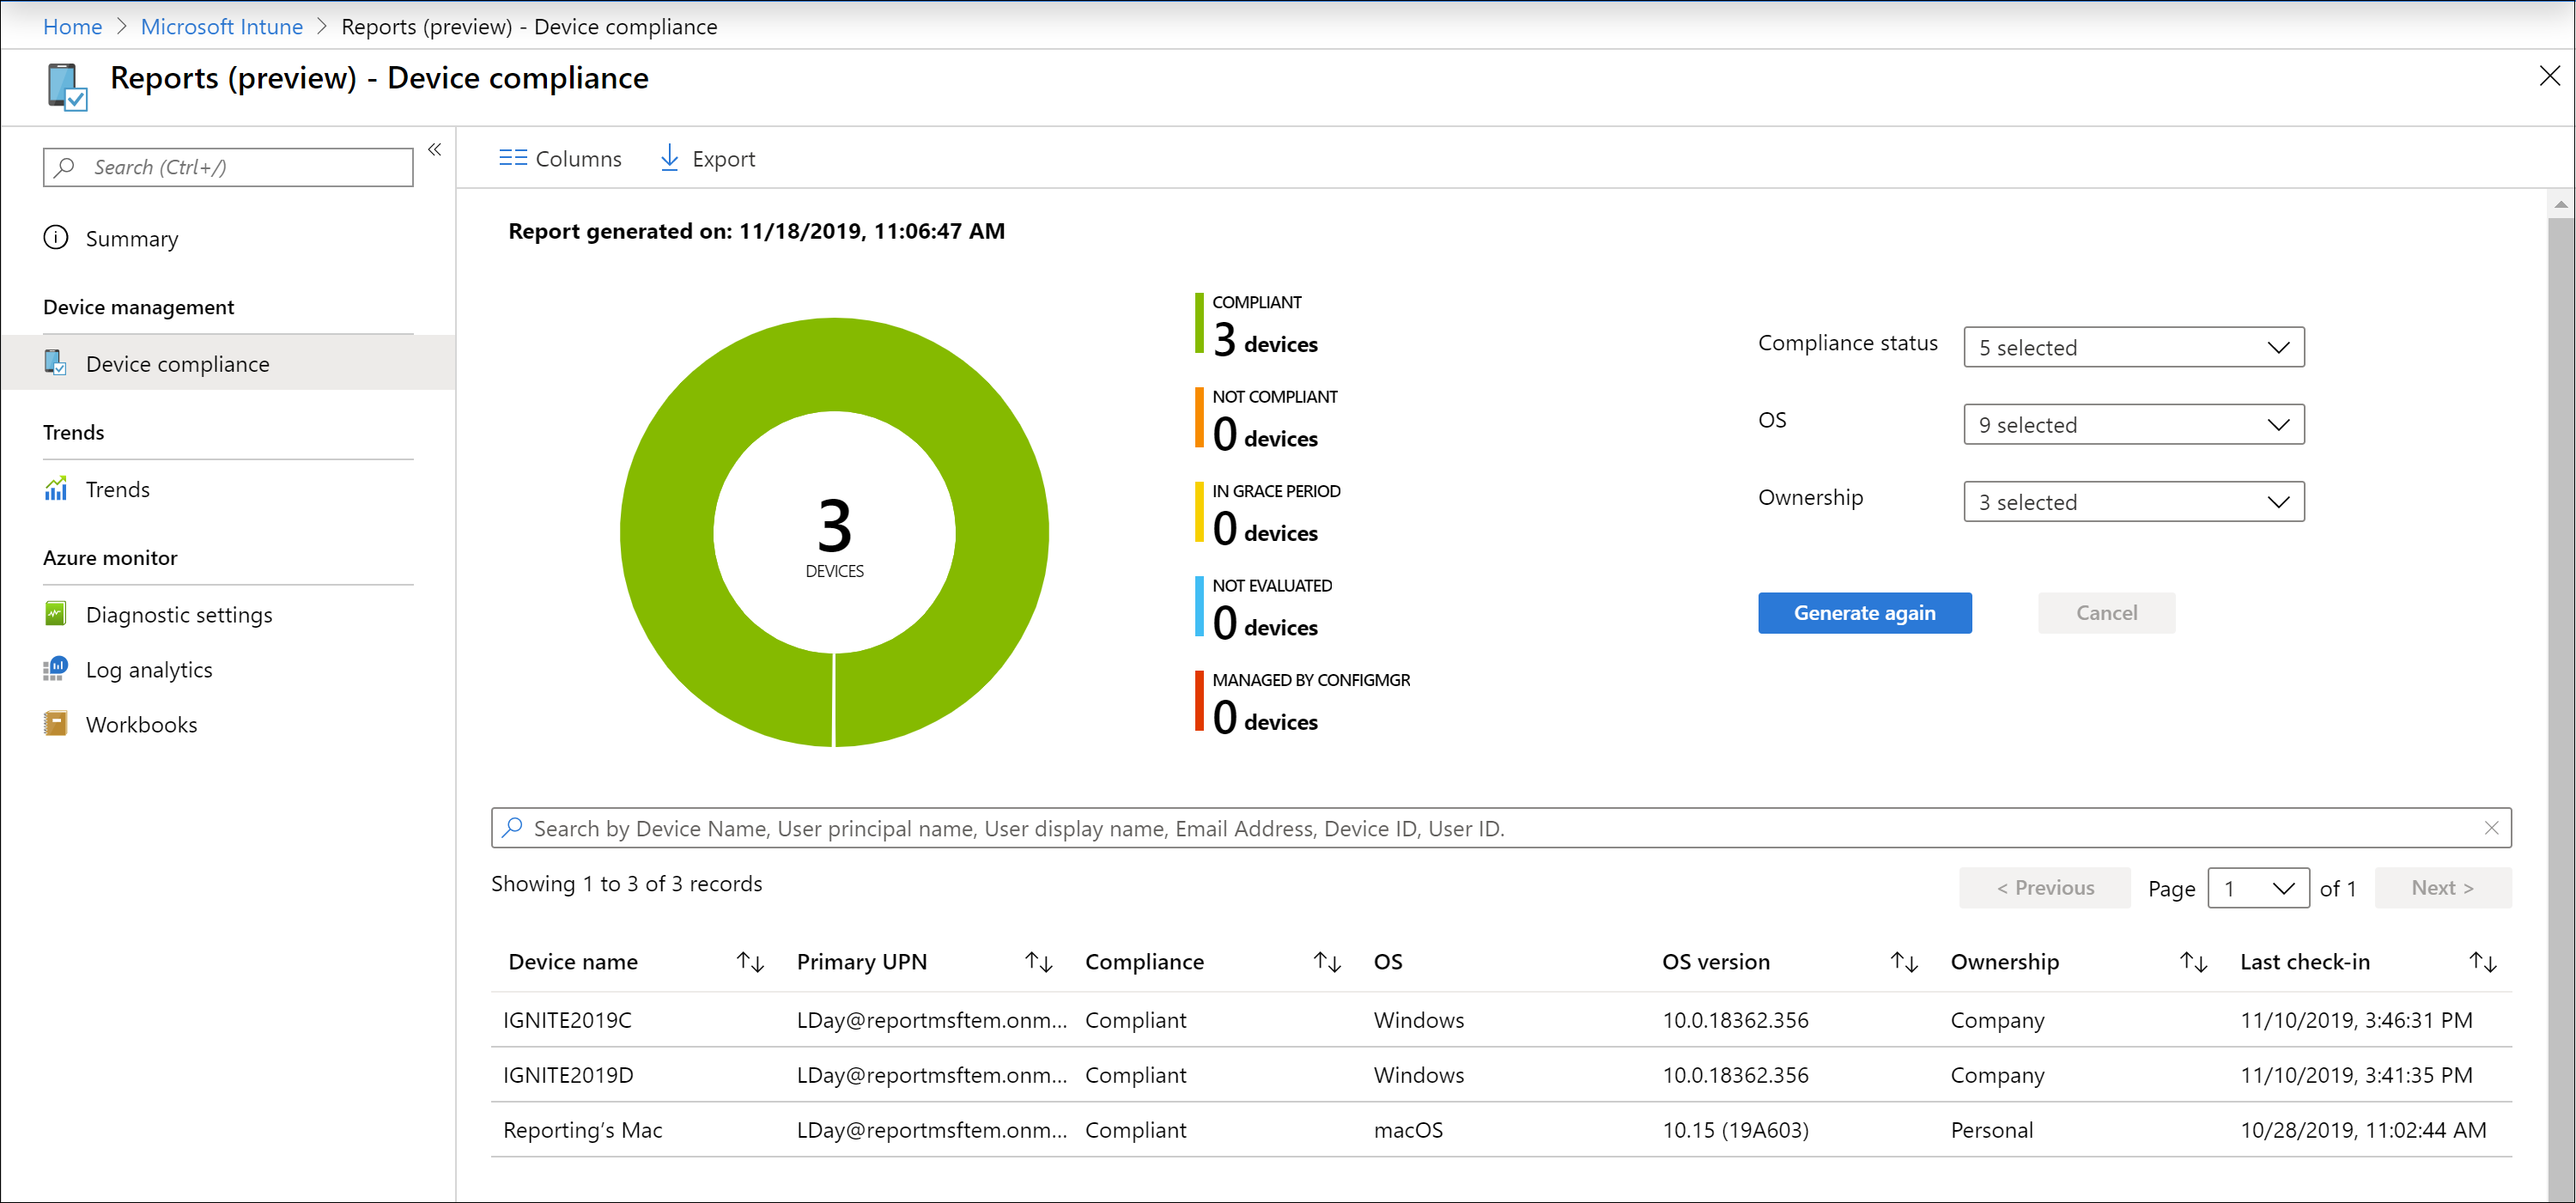
The device compliance report is meant to be broad in nature and provide a more traditional reporting view of data to identify aggregated metrics. This report is designed to work with large datasets to get a full device compliance picture. For example, the device compliance report for device compliance shows all the compliance states for devices to give a broader view of the data, no matter how large the dataset. This report shows the full breakdown of records in addition to a convenient visualization of aggregated metrics. This report can be generated by applying filters on it and selecting the Generate report button. This button will refresh the data to show the latest state with the ability to view the individual records that make up the aggregate data. Like most reports in the new framework, these records can be sorted and searched upon to focus on the information you need.
To see a generated report of device state, you can use the following steps:
Sign in to the Microsoft Intune admin center.
Select Reports > Device compliance > Reports tab > Device compliance.
Select the Compliance status, OS, and Ownership filters to refine your report.
Select Generate report (or Generate again) to retrieve current data.
Note
This Device compliance report provides a time stamp of when the report was last generated.
For related information, see Enforce compliance for Microsoft Defender for Endpoint with Conditional Access in Intune.
Device compliance trends report (Historical)
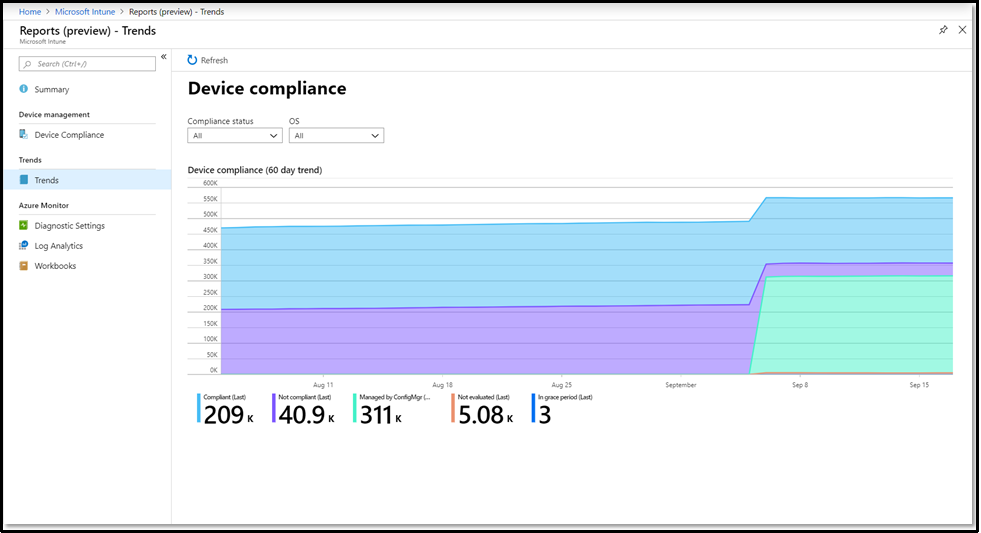
The device compliance trend report is more likely to be used by admins and architects to identify long term trends for device compliance. The aggregated data is displayed over a period of time. It's useful for making future investment decisions, driving process improvements, or prompting investigation into any anomalies. Filters can also be applied to see specific trends. The data provided by this report is a snapshot of the current tenant state (near real-time).
A compliance trend report for device compliance can show the trend of device compliance states over a period of time. You can identify where compliance peaks occurred and focus your time and effort accordingly.
You can view the Device compliance trends report using the following steps:
Sign in to the Microsoft Intune admin center.
Select Reports > Device compliance > Reports tab > Device compliance trends to view device compliance over a 60 day trend.
Noncompliant devices report (Organizational)
Note
In addition to this report, see Noncompliant devices report.
This report allows admins to quickly see:
- The devices that are noncompliant.
- For each device, the settings the device is noncompliant with, and the compliance policies that include these settings.
- For each device, any settings in an error state.
The benefit is you can see the noncompliant settings and settings in error state for all targeted devices at once. You don't need to check the Device compliance view for each device individually.
To generate the report, use the following steps:
Sign in to the Microsoft Intune admin center.
Select Reports > Device compliance > Reports tab > Noncompliant devices and settings.
Select Generate report. In the report, look at the following information:
- Noncompliant setting - Shows the name of the noncompliant policy setting.
- Noncompliant policy - Shows the name of the compliance policy that includes the noncompliant setting.
- Calculated policy version - Shows the compliance policy version that was used the last time compliance was calculated.
- Latest policy version - Shows the most recent version of the noncompliant compliance policy. If this version number is greater than the Calculated policy version, then an admin updated or changed the compliance policy since the last time compliance was calculated. The compliance state might be out-of-date.
- Setting compliance state - Shows if the device is noncompliant with the setting. Or, shows if the setting reported an error to Intune instead.
- Setting error code - If the setting compliance state is
Error, then it shows the error code. Otherwise, this column is left blank.
The report generates one row per device per noncompliant setting within the assigned compliance policy. So, a device that's noncompliant with four different settings will be in the list four times, once for each setting.
In this report, you can also:
- Export the report data.
- Filter the results by compliance state, OS platform, and setting compliance state.
- Search by each column.
- Sort the columns in ascending and descending order.
- Page through the results using the Previous and Next buttons.
Devices without compliance policy (Organizational)
This report allows admins to:
Identify devices that haven't been assigned a compliance policy.
We recommend that every device in each tenant is targeted by a compliance policy.
View the configuration of the tenant-wide Compliance policy setting named Mark devices with no compliance policy assigned as. By default, this setting marks a device without an assigned policy as Compliant.
We recommend that this setting be configured to mark devices that aren't targeted by a compliance policy as Not compliant. To aid admins in managing this setting, the report provides a link that opens the Compliance policy settings node where setting can be changed. For more information, see Compliance policy settings.
To generate the report, use the following steps:
- Sign in to the Microsoft Intune admin center.
- Select Reports > Device compliance > Reports tab > Devices without compliance policy.
- Select Generate report. In the report, look at the following information:
The report generates one row per device that hasn't been assigned a compliance policy. In the report, you'll find the following columns of information that can be used to sort the results. The report also supports search on:
- Device name - The name of the device as it appears when viewing Devices and creating groups.
- User Principal Name - The primary user of the device.
- OS - The operating system of the device, like Windows, or Android.
- OS version - The OS version, like 22000.675 for Windows, or 12.0 for Android.
- Device model - Model information such as Surface Book 2, or Galaxy Note 10.
- Device ID
Settings compliance (Organizational)
This report displays compliance settings that are deployed to devices, with a count of the devices for each status per setting. After the report has been generated, the top-level details you’ll see include:
- Setting name
- Platform
- Compliant devices
- Noncompliant devices
- Not evaluated devices
- Not applicable devices
- Conflict devices
By selecting an entry, you can drill in for more detailed information about the setting and devices that report a specific status.
To generate a report that uses current data:
- Sign in to the Microsoft Intune admin center.
- Select Reports > Device compliance > Reports tab, and select the Settings compliance tile.
- Use the drop-down to select which platforms the report will include.
- Select Generate report (or Generate again) to generate the report using updated data.
Policy compliance report (Organizational)
Note
This report is also known as the Per policy device compliance status report.
This report displays a list of compliance policies with a count of devices that are compliant or not compliant to each policy. After the report has been generated, The top-level details you’ll see include:
- Policy name
- Policy platform
- Compliant devices
- Noncompliant devices
- Not evaluated devices
- Not applicable devices
- Conflict devices
By selecting an entry, you can drill in for more detailed information about the policy and devices that report a specific status.
To generate a report that uses current data:
- Sign in to the Microsoft Intune admin center.
- Select Reports > Device compliance > Reports tab, and select the Policy compliance tile.
- Use the drop-down to select which platforms the report will include.
- Select Generate report (or Generate again) to generate the report using updated data.
Policy noncompliance report (Operational)
Note
This report is also known as the Policies with noncompliant and error devices report.
The Policy noncompliance report allows you to review policies with one or more noncompliant devices or devices with errors. Data provided is typically used by Helpdesk or admin roles to identify problems and help remediate issues. The data found in this report is timely, calls out unexpected behavior, and is meant to be actionable. The report is available alongside the workload, making the Policy noncompliance report accessible without browsing away from active workflows. This report provides exporting, filtering, searching, paging, and sorting capabilities.
You can view the Policy noncompliance report using the following steps:
- Sign in to the Microsoft Intune admin center.
- Select Devices > Monitor > Policies with noncompliant and error devices.
Noncompliant devices report (Operational)
The Noncompliant devices report provides data typically used by Helpdesk or admin roles to identify problems and help remediate issues. The data found in this report is timely, calls out unexpected behavior, and is meant to be actionable. The report is available alongside the workload, making the non-compliant devices report accessible without browsing away from active workflows. This report provides filtering, searching, paging, and sorting capabilities. Also, you can drill down to help troubleshoot.
You can view the Noncompliant devices report using the following steps:
- Sign in to the Microsoft Intune admin center.
- Select Devices > Monitor > Noncompliant devices.
Windows hardware attestation report (Organizational)
View the status of hardware-attested compliance settings assigned to Windows devices. This report shows data for Intune-enrolled devices that are assigned a compliance policy with at least one hardware-attested compliance setting.
You can view the Windows hardware attestation report using the following steps:
- Sign in to the Microsoft Intune admin center.
- Go to Reports > Device Compliance.
- Go to the Reports tab.
- Select Windows hardware attestation report.
Device configuration reports
This set of reports focuses on device configuration settings in your policies. You can get a list of all the devices that are not configured correct, review device configuration trends, and see the device names and additional configuration settings.
Certificates report (Operational)
You can review info about certificates, including thumbprints, issuance info, and status.
You can view the Certificates report using the following steps:
- Sign in to the Microsoft Intune admin center.
- Select Devices > Monitor > Certificates.
Encryption report (Operational)
Note
This report is also known as the Device encryption status report.
You can view encryption details, including encryption readiness, encryption status, and TPM version.
You can view the Encryption report using the following steps:
- Sign in to the Microsoft Intune admin center.
- Select Devices > Monitor > Device encryption status.
Devices with restricted apps report (Operational)
You can view a list of devices on which users have installed one or more restricted apps.
You can view the Devices with restricted apps report using the following steps:
- Sign in to the Microsoft Intune admin center.
- Select Devices > Monitor > Devices with restricted apps.
Profile configuration status report (Organizational)
The Profile configuration status report provides the capability to filter through all device configuration profiles to see their current status on assigned devices.
The Profile configuration status report allows you to generate a list of profiles in the tenant that have devices in a state of success, error, conflict, or not applicable. You can use filters for the profile type, OS, and state. The returned results will provide search, sort, filter, pagination, and export capabilities. In addition to device configuration details, this report provides resource access details, and new settings catalog profile details.
To view the Profile configuration status report:
- Sign in to the Microsoft Intune admin center.
- Select Reports > Device configuration > Reports > Profile configuration status.
Device enrollment reports
This set of reports focuses on device enrollment settings in your policies. You can get a list of all the devices that are not enrolled correctly, review device enrollment trends, and see the device names and additional enrollment settings.
Enrollment failures report (Operational)
You can view details about failed user enrollment attempts.
You can view the Enrollment failures report using the following steps:
- Sign in to the Microsoft Intune admin center.
- Select Devices > Monitor > Enrollment failures.
Incomplete user enrollments report (Operational)
You can identify where enrollments stop in the Company Portal enrollment flow.
You can view the Incomplete user enrollments report using the following steps:
- Sign in to the Microsoft Intune admin center.
- Select Devices > Monitor > Incomplete user enrollments.
Device attestation status report
This report provides a summary of devices that have either Completed, Failed or Not started enrollment attestation.
You can view the Device attestation status report report using the following steps:
- Sign in to the Microsoft Intune admin center.
- Select Reports > Device management > Device attestation status.
- Use the drop-downs to filter by attestation status or device ownership.
- Select Generate report (or Generate again) to generate the report using updated data.
- For more information on the report, see Windows enrollment attestation.
Windows Autopilot deployments report (Operational)
This report provides a summary of deployment details for Windows Autopilot enrolled devices for the last 30 days.
You can view the Windows Autopilot deployments report using the following steps:
- Sign in to the Microsoft Intune admin center.
- Select Devices > Monitor > Windows Autopilot deployments.
Update reports
Per update ring deployment state report (Operational)
Note
This report is also known as the Deployment status per Windows update ring report.
You can view the number of devices with successful or failed updates for each update ring.
You can view the Per update ring deployment state report report using the following steps:
- Sign in to the Microsoft Intune admin center.
- Select Devices > Monitor > Deployment status per Windows update ring.
Windows Driver update failures report (Operational)
Note
This report is also known as the Driver update policies with alerts report.
You can view the policies with one or more Windows devices with driver update alerts.
You can view the Windows Driver update failures report using the following steps:
- Sign in to the Microsoft Intune admin center.
- Select Devices > Monitor > Driver update policies with alerts.
Windows Expedited update failures report (Operational)
Note
This report is also known as the Expedited quality update policies with alerts report.
You can view the policies with one or more Windows devices with expedited quality update alerts.
You can view the Windows Expedited update failures report using the following steps:
- Sign in to the Microsoft Intune admin center.
- Select Devices > Monitor > Expedited quality update policies with alerts.
Feature update failures report (Operational)
Note
This report is also known as the Feature update policies with alerts report.
A Windows update report, the Feature update failures operational report provides failure details for devices that are targeted with a Feature updates for Windows 10 and later policy and have attempted an update. The data found in this report is timely and calls out number of devices with errors. You can drill down to help troubleshoot. This report provides filtering, searching, paging, and sorting.
Before this report can show data, you must configure data collection for the Windows feature updates reports. For information about configuring data collection and how to use this report to resolve update failures, see Reports for Windows feature updates policy.
To view the Feature update failures report, use the following steps:
- Sign in to the Microsoft Intune admin center.
- Select Devices > Monitor > Feature update policies with alerts.
Important
To get a complete picture of Windows feature updates status, use the following feature updates reports:
- Windows feature update (Organizational)
- Feature update failures report (Operational) (this report)
Together, these reports provide insight into the update state and compliance of Windows devices in your organization and can help you troubleshoot problems with feature update deployment.
Installation failures for iOS devices report (Operational)
Note
This report is also known as the iOS update installation failures report.
View update installation failures on iOS devices.
You can view the Installation failures for iOS devices report using the following steps:
- Sign in to the Microsoft Intune admin center.
- Select Devices > Monitor > iOS update installation failures.
Installation status for macOS devices report (Operational)
Note
This report is also known as the macOS update installation failures report.
View update installation failures on macOS devices.
You can view the Installation status for macOS devices report using the following steps:
- Sign in to the Microsoft Intune admin center.
- Select Devices > Monitor > macOS update installation failures.
Windows feature update (Organizational)
A Windows update report, the Windows 10 and later feature updates report provides an overall view of compliance for devices that are targeted with a Feature updates for Windows 10 and later policy. This report provides the update status based on update state. You can also see specific device update details. The data found in these reports is timely, calls out the device name and state, and other update related details. A summary report is available in the Windows updates workload. This report also provides filtering, searching, paging, and sorting.
For information about how to use this report to resolve update failures, see Reports for Windows 10 and later feature updates policy.
You can view the Windows 10 and later feature updates report using the following steps:
- Sign in to the Microsoft Intune admin center.
- Select Reports > Windows updates to view the summary report.
- Select the Reports tab and select the Windows Feature Update Report to see the Windows 10 and later feature updates report.
- Select the Update aggregated status and Ownership filters to refine your report.
- Select Generate report (or Generate again) to retrieve current data.
Important
To get a complete picture of Windows feature updates status, use the following feature updates reports:
- Windows feature update (Organizational) (this report)
- Feature update failures report (Operational)
Together, these reports provide insight into the update state and compliance of Windows devices in your organization and can help you troubleshoot problems with feature update deployment.
Security reports
Unhealthy endpoints report (Operational)
The Unhealthy endpoints report surfaces data typically used by Helpdesk or admin roles to identify problems and help remediate issues with Windows endpoints. The data found in this report is timely, calls out the unhealthy device, the primary user principal name (UPN), and the status of many settings. The report is available as a tab within the primary Antivirus workload. This report provides filtering, searching, paging, and sorting. Additionally, this report provides the Managed by column. This column can be used to identity devices that are managed by Configuration Manager.
You can view the Unhealthy endpoints report using the following steps:
- Sign in to the Microsoft Intune admin center.
- Select Endpoint security > Antivirus > Unhealthy endpoints tab.
For information about the actions you can take with this report, see Bulk actions for device reports.
Active malware report (Operational)
The Active malware report provides data to identify devices with malware problems and help remediate issues with Windows endpoints. The data found in this report is timely, calls out the unhealthy device, the user name, and severity. The report is available as a tab within the primary Antivirus workload. This report provides filtering, searching, paging, and sorting. Additionally, this report provides the Managed by column. This column can be used to identity devices that are managed by Configuration Manager.
You can view the Active malware report using the following steps:
- Sign in to the Microsoft Intune admin center.
- Select Endpoint security > Antivirus > Active malware tab.
For information about the actions you can take with this report, see Bulk actions for device reports.
Bulk actions for device reports
The Unhealthy endpoints and Active malware reports provide bulk actions that are applicable to the Windows devices selected within each report. To use a bulk action, you select a row corresponding to each device (up to 100 devices at a time) and select the action. The following actions available:
- Restart - This action performs a restart of the selected devices.
- Quick scan - This action performs a Windows Defender quick scan of the selected devices.
- Full scan - This action performs a Windows Defender full scan of the selected devices.
For more information about the difference between a quick scan and a full scan, see Configure scheduled quick or full Microsoft Defender Antivirus scans.
Assignment failures report (Operational)
Note
This report is also known as the Configuration policy assignment failures report.
The Assignment failures operational report helps you troubleshoot errors and conflicts for configuration profiles that have been targeted to devices. This report will show a list of configuration profiles for the tenant and the number of devices in a state of error or conflict. Security baselines and endpoint security profiles have been added to this report. The profile types are differentiated using the Policy type column. Using this information, you can drill down to a profile to see a list of devices and users in a failure state related to the profile. Additionally, you can drill down even further to view a list of settings and setting details related to the cause of the failure. You can also filter by type and platform, sort based on column, and search by profile name.
Role-based access control (RBAC) permissions have been applied to the report to filter on the set of policies that an admin can see. Those RBAC permissions include the Security baseline permission, the Device Configuration permission, and the Device Compliance Policies permission.
| Permission | Action | Details |
|---|---|---|
| Security Baseline | Read | Yes: Enables the ability to view baseline/endpoint security policies in Assignment Failures report. No: Enables the ability to view baseline/endpoint security policies in Assignment Failures report. |
| Device Configuration | Read | Yes: Enables the ability to view device configuration policies in Assignment Failures report. No: Enables the ability to view device configuration policies in Assignment Failures report. |
| Device Compliance Policies | View Reports | Yes: No impact to Assignment Failures report. No: No impact to Assignment Failures report. |
For more information about RBAC permissions, see Role-based access control (RBAC) with Microsoft Intune and Permissions granted by the Endpoint Security Manager role.
You can view the Assignment failures report using the following steps:
- Sign in to the Microsoft Intune admin center.
- Select Devices > Monitor > Configuration policy assignment failures.
Note
This report is in preview.
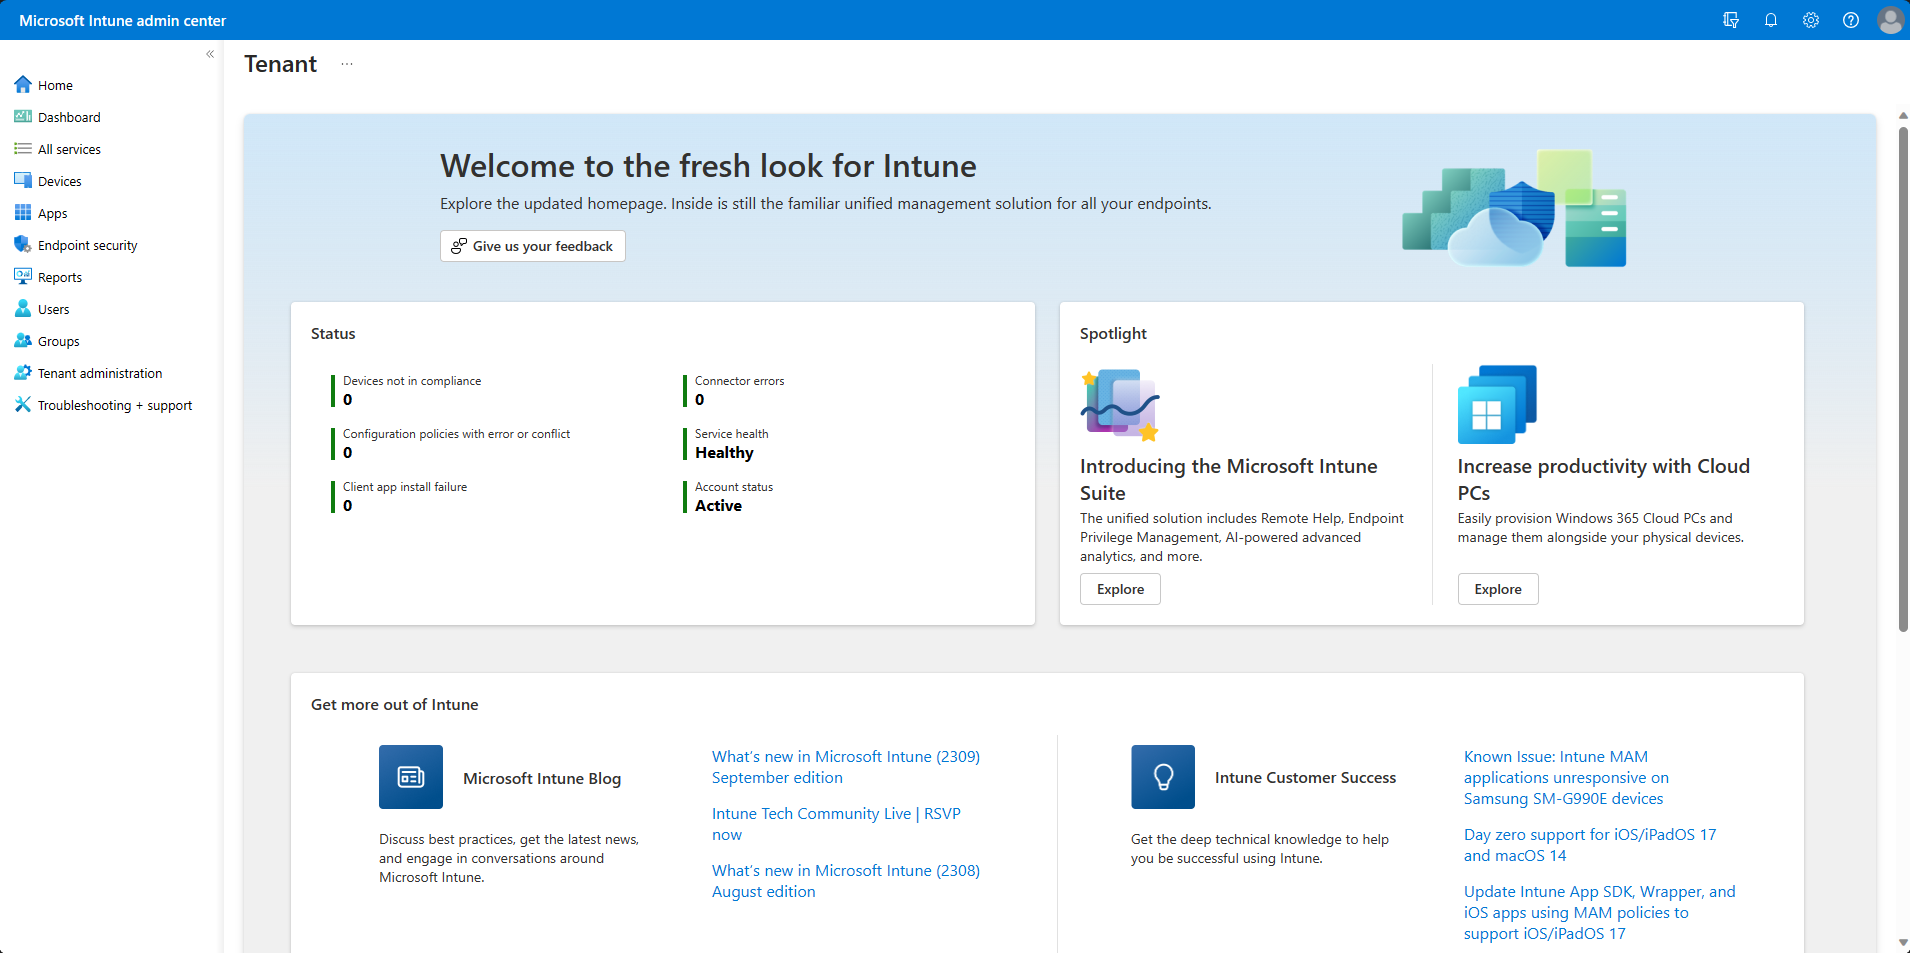
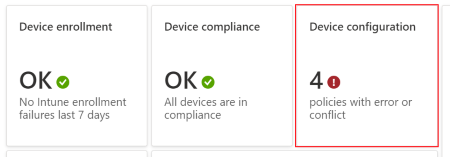
You can also get to this report in the Home page:
And the Dashboard:
Antivirus agent status report (Organizational)
The Antivirus agent status report provides the agent status of your organization's devices.
The report is available from the primary Microsoft Defender Antivirus workload, and provides filtering, searching, paging, and sorting. The data found in this report is timely and shows the following details:
- If a device has real-time or network protection, and the state
- The status of Windows Defender
- If Tamper protection is enabled
- If the device is a virtual machine, or a physical device
- Calls out the unhealthy device, the user name, and severity
This report shows data visualizations as a pie chart for a breakdown of agent status count across devices, and includes remote actions.
You can view the Antivirus agent status report using the following steps:
- Sign in to the Microsoft Intune admin center.
- Select Reports > Microsoft Defender Antivirus to open the default reports view, which is the Summary page. The Summary page displays aggregate details for the Antivirus reports, supports a Refresh, and reflects the data found in Antivirus agent status report.
- Select the Reports tab > Antivirus agent status to open the report.
- Select Generate report (or Generate again) to retrieve current data.
After you generate the report, you can select Columns to view the full list of details that are available in the report.
The information for this report is based on details available from the following CSPs, which are documented in the Windows client-management documentation:
Other reports for Microsoft Defender Antivirus include:
- Detected malware report, an organizational report detailed in this article.
- Antivirus policy reports, which are available in the Antivirus node under Endpoint security in the Microsoft Intune admin center.
Detected malware report (Organizational)
The Detected malware report provides the malware state of your organization's devices. This report shows the number of devices with detected malware, and malware details. The data found in this report is timely, calls out the device name and severity, and other malware related details. This report shows a pie chart for the count of devices in each malware state. The report is available from the primary Microsoft Defender Antivirus workload. This report also provides filtering, searching, paging, and sorting.
You can view the Detected malware report using the following steps:
- Sign in to the Microsoft Intune admin center.
- Select Reports > Microsoft Defender Antivirus to open the default reports view, which is the Summary page. The Summary page displays aggregate details for the Antivirus reports, supports a Refresh, and reflects the data found in the Antivirus agent status report.
- Select the Reports tab > Detected malware to open the report.
- Select Generate report (or Generate again) to retrieve current data.
The information for this report is based on details available from the Defender CSP, which is documented in the Windows client-management documentation.
Other reports for Microsoft Defender Antivirus include:
- Antivirus agent status report, an organizational report detailed in this article.
- Antivirus policy reports, which are available in the Antivirus node under Endpoint security in the Microsoft Intune admin center.
MDM Firewall status for Windows 10 and later (Organizational)
This report is also described in Endpoint security firewall policy along with the MDM devices running Windows 10 or later with firewall off report, which is only available from within the Endpoint security node.
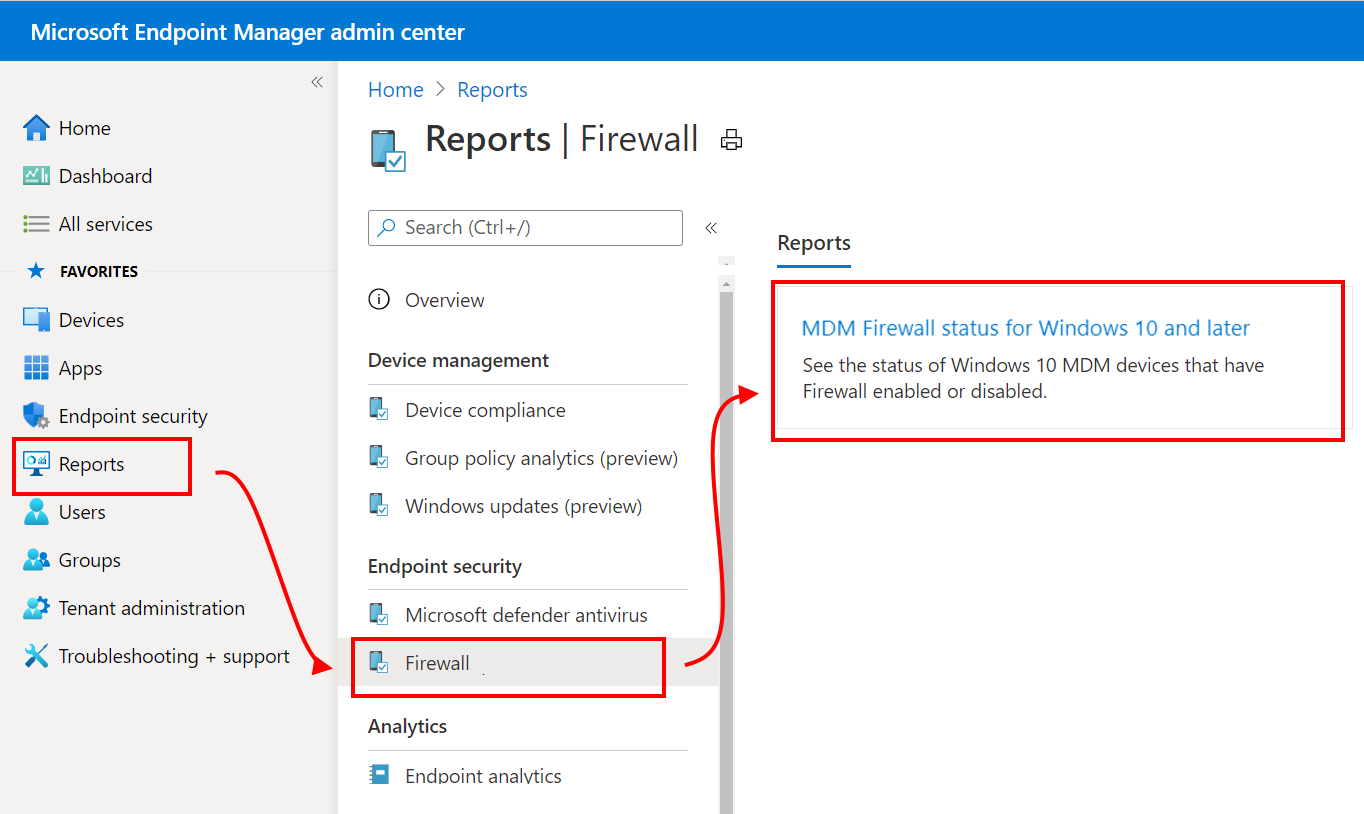
The MDM Firewall status for Windows 10 and later report provides a high-level view of the firewall status for your managed devices. To view this report, open the Microsoft Intune admin center, and then go to Reports > Firewall > MDM Firewall status for Windows 10 and later.
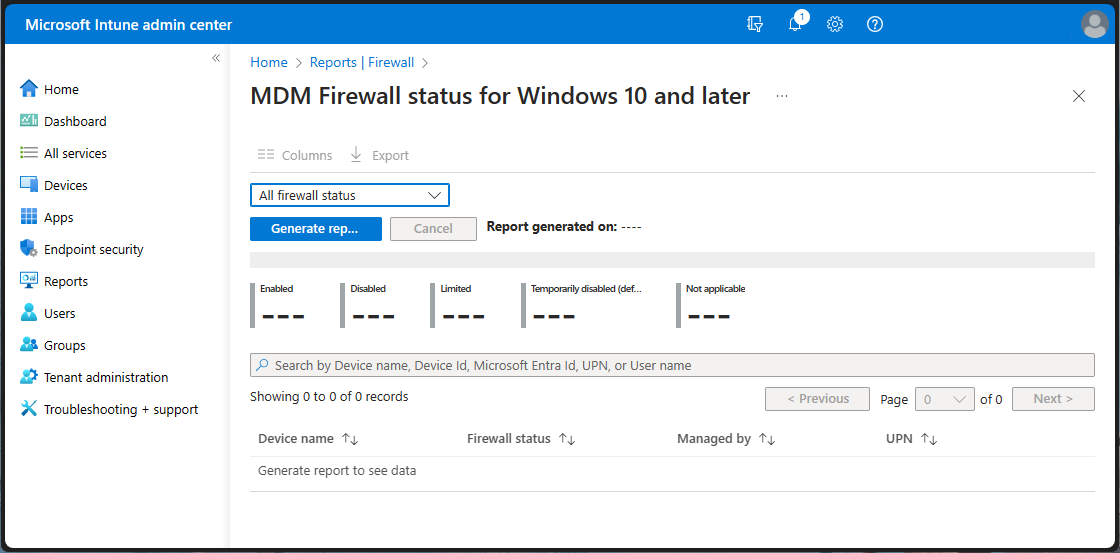
Data is reported through the Windows DeviceStatus CSP, and reports on the status of the firewall on your managed devices. You can filter returns for this report by using one or more of the status detail categories.
Status details include:
- Enabled – The firewall on, and successfully reporting.
- Disabled - The firewall is turned off.
- Limited – The firewall isn’t monitoring all networks, or some rules are turned off.
- Temporarily Disabled (default) – The firewall is temporarily not monitoring all networks
- Not applicable – The device doesn’t support firewall reporting.
Application reports
App Install Status report (Operational)
The App Install Status report provides a list of apps with versions and installation details. App installation details include Version, Publisher, and Platform. Additionally, the installation details provide the app install and failure totals for devices and users. You have the ability to sort and search this report as well.
To see a generated report, you can use the following steps:
- Sign in to the Microsoft Intune admin center.
- Select Apps > Monitor > App Install Status to view the current data.
Device Install Status report for apps (Operational)
Based on a selected app, the Device Install Status report provides a list of devices and status information related to the specific app. App installation details related to the device includes UPN, Platform, Version, Status, Status details, and Last check-in. You have the ability to sort, filter, and search this report as well.
To see a generated report of device state, you can use the following steps:
- Sign in to the Microsoft Intune admin center.
- Select Apps > All Apps > Select an app > Device Install status.
Note
If the device's platform differs from the application's platform, rather than showing Not Applicable for the Status details of the entry, the entry will not be provided. For example, if an Android app has been select and the app is targeted to an iOS device, rather than providing a Not Applicable device status value, the device status for that entry will not be shown in the Device Install Status report.
User Install Status for apps report (Operational)
Based on a selected app, the User Install Status report provides a list of users and status information related to the specific app. App installation details related to the user include Name, UPN, Failures, Installs, Pending, Not Installed, and Not Applicable. You have the ability to sort, filter, and search this report as well.
To see a generated report, you can use the following steps:
- Sign in to the Microsoft Intune admin center.
- Select Apps > All Apps > Select an app > User Install status.
Overview lists
All devices (Operational)
The All devices details provide a list of dozens of devices details listed by column in one report.
You can view details of all the devices you manage in this single report. By selecting a listed device, you can see more details and actions for the device, such as device action status, remote lock, sync, restart, and full scan. Choose Columns to provide more device details for the report. This report provides filtering, searching, paging, and sorting capabilities.
Note
The OS column of the All devices allows you to filter by specific device enrollment type for Android devices.
To view the All devices details:
- Sign in to the Microsoft Intune admin center.
- Select Devices > All devices.
Single policy reports
Device and user check-in status report (Operational)
The Device and user check-in status report combines information that was previously split into separate device status and user status reports. This report shows the list of device and user check-ins for the device configuration profile, with the check-in status and last check-in time. When you open the report, the aggregate chart will remain at the top of the page, and the data will be consistent with the list data. Use the filter column to view assignment filter options. You can also view more columns for device properties in the report: Model, Manufacturer, and Intune device ID. Tools are available to search across the entire dataset, sort on every column, use paging controls to navigate through data, view number of records within the report. Also, you can apply filters to the exported data.
To view the Device and user check-in status report:
- Sign in to the Microsoft Intune admin center.
- Select Devices > Device configuration profiles (preview) > select a configuration profile > Device and user check-in status.
Device assignment status report (Operational)
The Device assignment status report surfaces data on the latest status for assigned devices from the device configuration profile. To view this report, select theDevice assignment status card on the profile overview page. By default, the report will return empty until you generate the report with or without a filter for the assignment status. Once completed, the report will include a timestamp for when it was last generated. The reporting data will be available for up to three days before needing to be generated again.
Like the Device and user check-in status report, the Device assignment status report page includes an aggregate chart that summarizes the list data. The aggregate counts the number of device check-ins based on the last active user across Success, Error, Conflict, Not Applicable, and Pending states. A denominator shows the total count of assigned devices and primary users targeted by the policy. The list records reflect the same data, surfacing only one entry per device based on its last active user.
To view the Device assignment status report:
- Sign in to the Microsoft Intune admin center.
- Select Devices > Device configuration profiles (preview) > select a configuration profile > Device assignment status.
Per setting status report (Operational)
The Per setting status report surfaces the summary of device and user check-ins that are in Success, Conflict, Error states at the granular setting level within the device configuration profile. This report uses the same consistency and performance updates and navigation tools we’ve made available to other reports.
To view the Per setting status report:
- Sign in to the Microsoft Intune admin center.
- Select Devices > Device configuration profiles (preview) > Select a configuration profile > Per setting status.
Single device reports
Managed Apps report (Operational)
The Managed Apps report provides a report of apps on a specific device that are currently installed, not installed, or available for install. For the device, the report provides the following columns:
- Application
- Version
- Resolved intent
- Installation status
The Resolved intent column lists the needed installation result or availability of the app, such as Required install, Required uninstall, or Available. The Installation status column provides the last known state of the app on the device, such as Installed, Not installed, and Available for install.
You can switch between displaying managed app details for the primary user and other users on a device, or display app details for the device without any user. The generated app details will be displayed using the primary user of the device when the report is initially loaded, or displayed with no primary user if none exists.
When you select on an app in the report, you can view the Installation details pane, along with the ability to collect diagnostics when applicable (such as for Win32 apps). Installation details include the history of installation related actions for the app. For instance, details may include whether the app was successfully assigned, whether the Intune Management Extension was successfully installed (if required by the app), when the device check-in was last completed, when the app was created, or whether the app installation was successful. When an app fails to install, you can see more details by selecting Show details in the Installation details pane.
To see the report for a device, you can use the following steps:
- Sign in to the Microsoft Intune admin center.
- Select Devices > All devices > select a device > Managed Apps.
- To see the managed apps for a specific user, select a user from the dropdown box near the top of the report.
Note
The Managed Apps report also includes Enterprise App Catalog apps.
Device group membership report (Organizational)
The Group membership report provides the group membership of all Microsoft Entra groups for a specific managed device. The report provides the following columns:
- Name
- Object ID
- Membership Type
- Direct or Transitive
When you select on a group, you can see the Microsoft Entra pane for the group. You can identify whether the device's membership is assigned or dynamic and whether the device is a direct member or a transitive member. This report supports all device platforms and management types. This report provides filtering, searching, paging, and sorting capabilities. Also, you can drill down to help troubleshoot.
To see the report for a device, you can use the following steps:
- Sign in to the Microsoft Intune admin center.
- Select Devices > All devices > select a device > Group Membership.
Device configuration (Operational)
The Device configuration details provide both device configuration and endpoint security profiles in one report.
You can view all the policies applied to your device in the new single report that contains improved data. For instance, you can see the distinction of profile types in the new Policy type field. Also, selecting a policy will provide more details about settings applied to the device and status of the device. Role-based access control (RBAC) permissions have been applied to filter the list of profiles based on your permissions.
To view the Device configuration details:
- Sign in to the Microsoft Intune admin center.
- Select Devices > All devices > select a device > Device configuration.
Cloud attached devices reports
Co-management eligibility report (Organizational)
The Co-management eligibility report provides an eligibility evaluation for devices that can be co-managed. Devices must upgrade to Windows 10 and enroll in Microsoft Entra ID before becoming eligible. Some devices (like devices with Windows Server OS) aren't eligible for co-management. Co-management enables you to concurrently manage Windows 10 devices by using both Configuration Manager and Microsoft Intune.
To see a generated report of device state, you can use the following steps:
- Sign in to the Microsoft Intune admin center.
- Select Reports > Cloud attached devices (preview) > Reports tab > Co-Management Eligibility.
- Select Generate report (or Generate again) to retrieve current data.
For related information, see What is co-management?.
Note
This report is in preview.
Co-managed workloads report (Organizational)
The Co-Manage Workloads report provides a report of devices that are currently co-managed. For each device, the report shows the management authority for the Compliance, Resource Access, Device Configuration, Windows Update for Business, Endpoint Protection, Modern Apps, and Office Apps workloads. The report also aggregates all device workloads to show a summary of total workload management. Co-management enables you to concurrently manage Windows 10 and later devices by using both Configuration Manager and Microsoft Intune.
To see a generated report of device state, you can use the following steps:
- Sign in to the Microsoft Intune admin center.
- Select Reports > Cloud attached devices (preview) > Reports tab > Co-Managed Workloads.
- Select Generate report (or Generate again) to retrieve current data.
For related information, see What is co-management?
Note
This report is in preview.
Azure Monitor reports
Azure Monitor integration reports (Specialist)
You can customize your own reports to get the data you want. The data in your reports will optionally be available via Azure Monitor using Log Analytics and Azure Monitor workbooks. These solutions allow you to create custom queries, configure alerts, and make dashboards to show the device compliance data in the manner you want. Additionally, you can retain the activity logs in your Azure storage account, integrate with the reports using security information and event management (SIEM) tools, and correlate the reports to Microsoft Entra activity logs. Azure Monitor workbooks can be used in addition to importing dashboards for custom reporting needs.
Note
Complex reporting functionality require an Azure subscription.
An example specialist report could correlate a set of device details, including ownership data, with compliance data in a custom report. Then, this custom report could be displayed on an existing dashboard in the Microsoft Entra admin center.
You can create and view custom reports using the following steps:
Sign in to the Microsoft Intune admin center.
Select Reports > Diagnostic settings add a diagnostic setting.
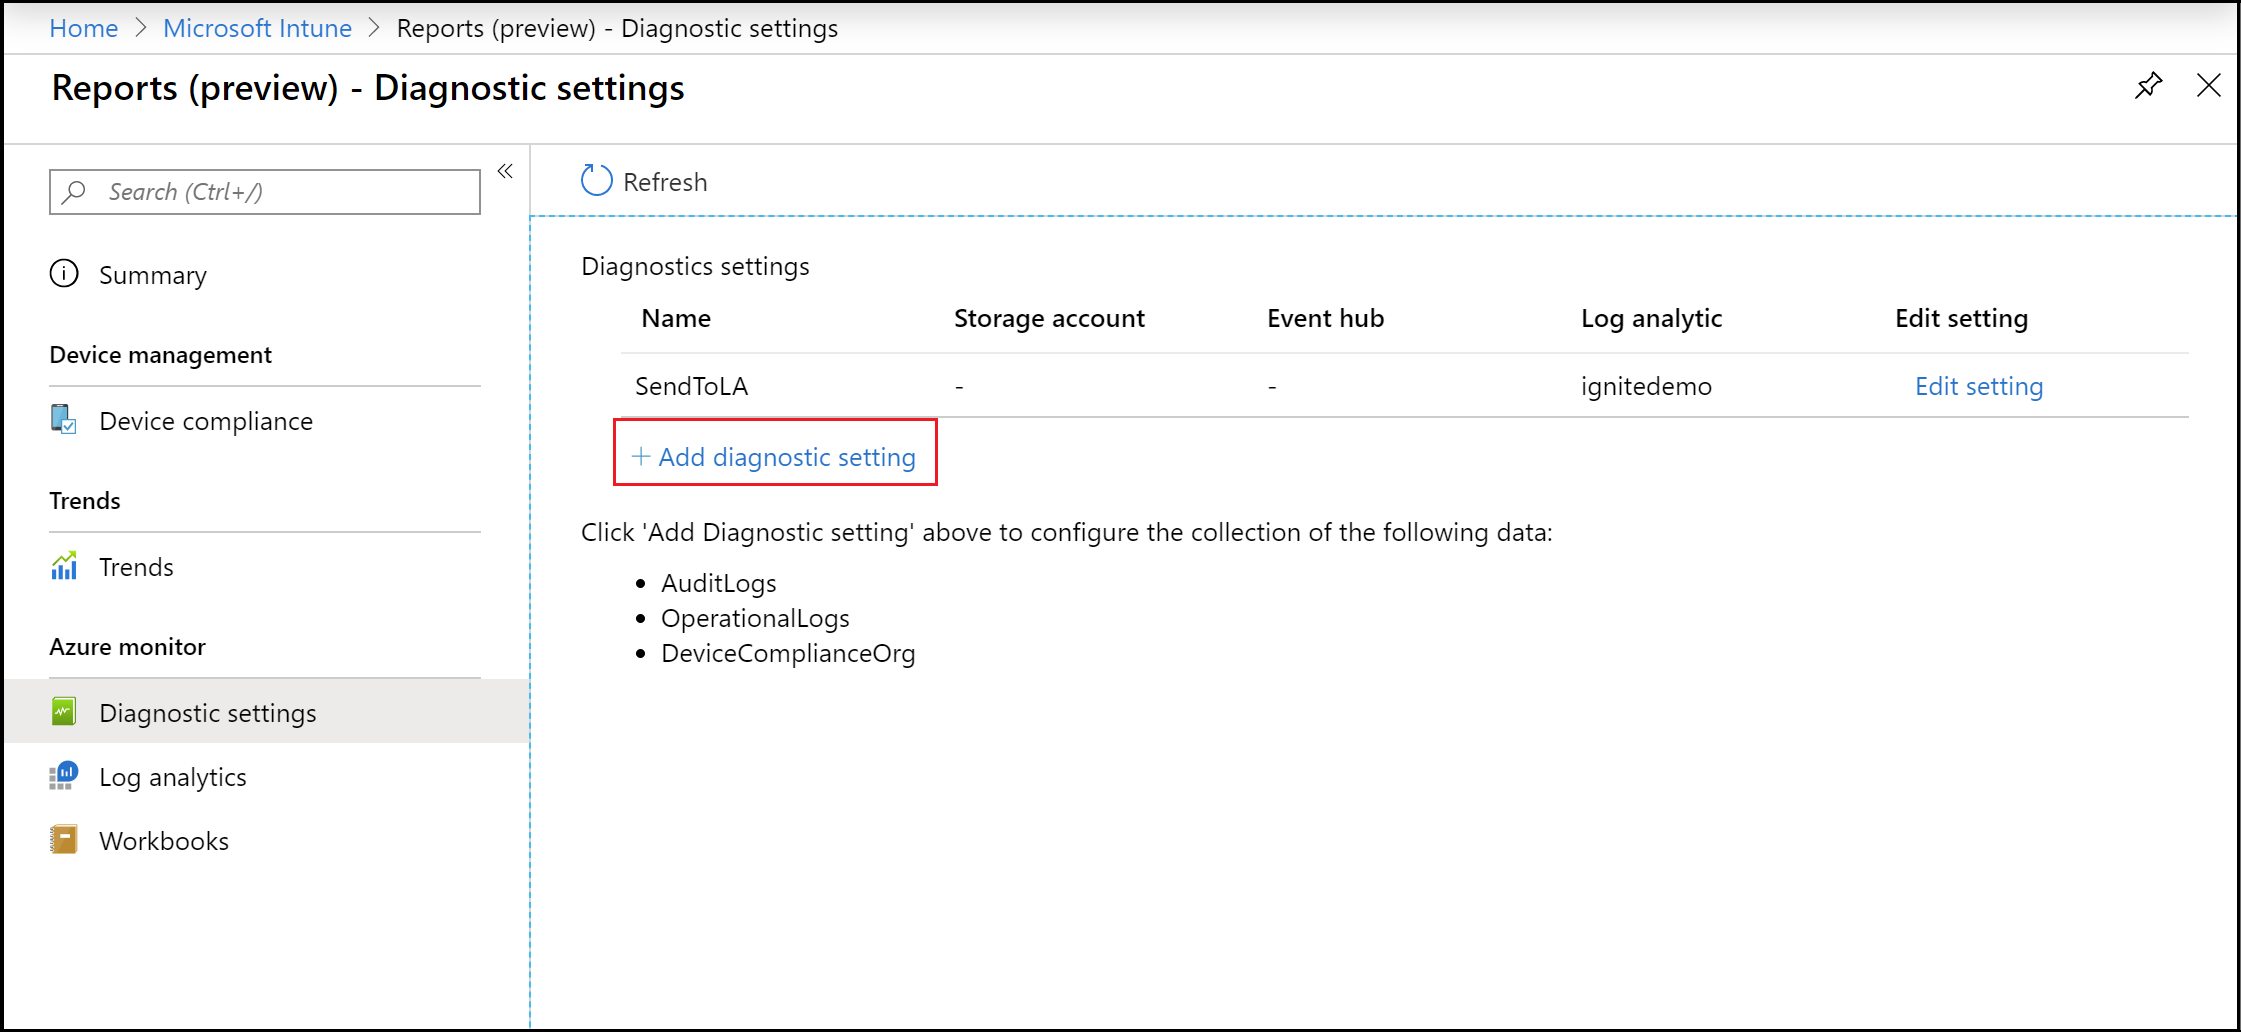
Select Add diagnostic setting to display the Diagnostic settings pane.
Note
An Azure subscription is required to use this capability.
Add a Name for the diagnostic settings.
Select the Send to Log Analytics and DeviceComplianceOrg settings.
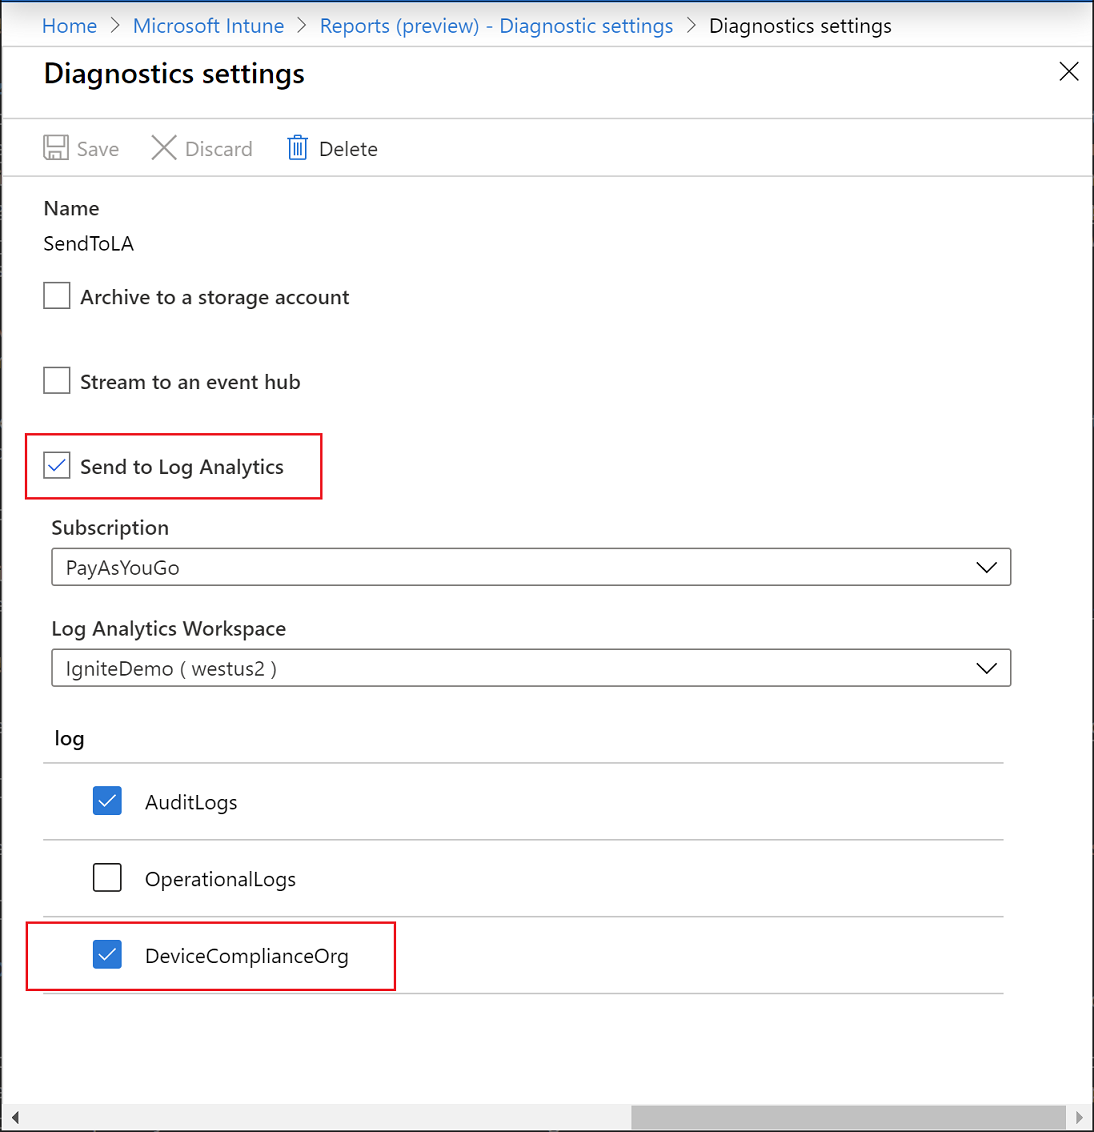
Select Save.
Next, select Log analytics to create and run a new log query using Log Analytics.
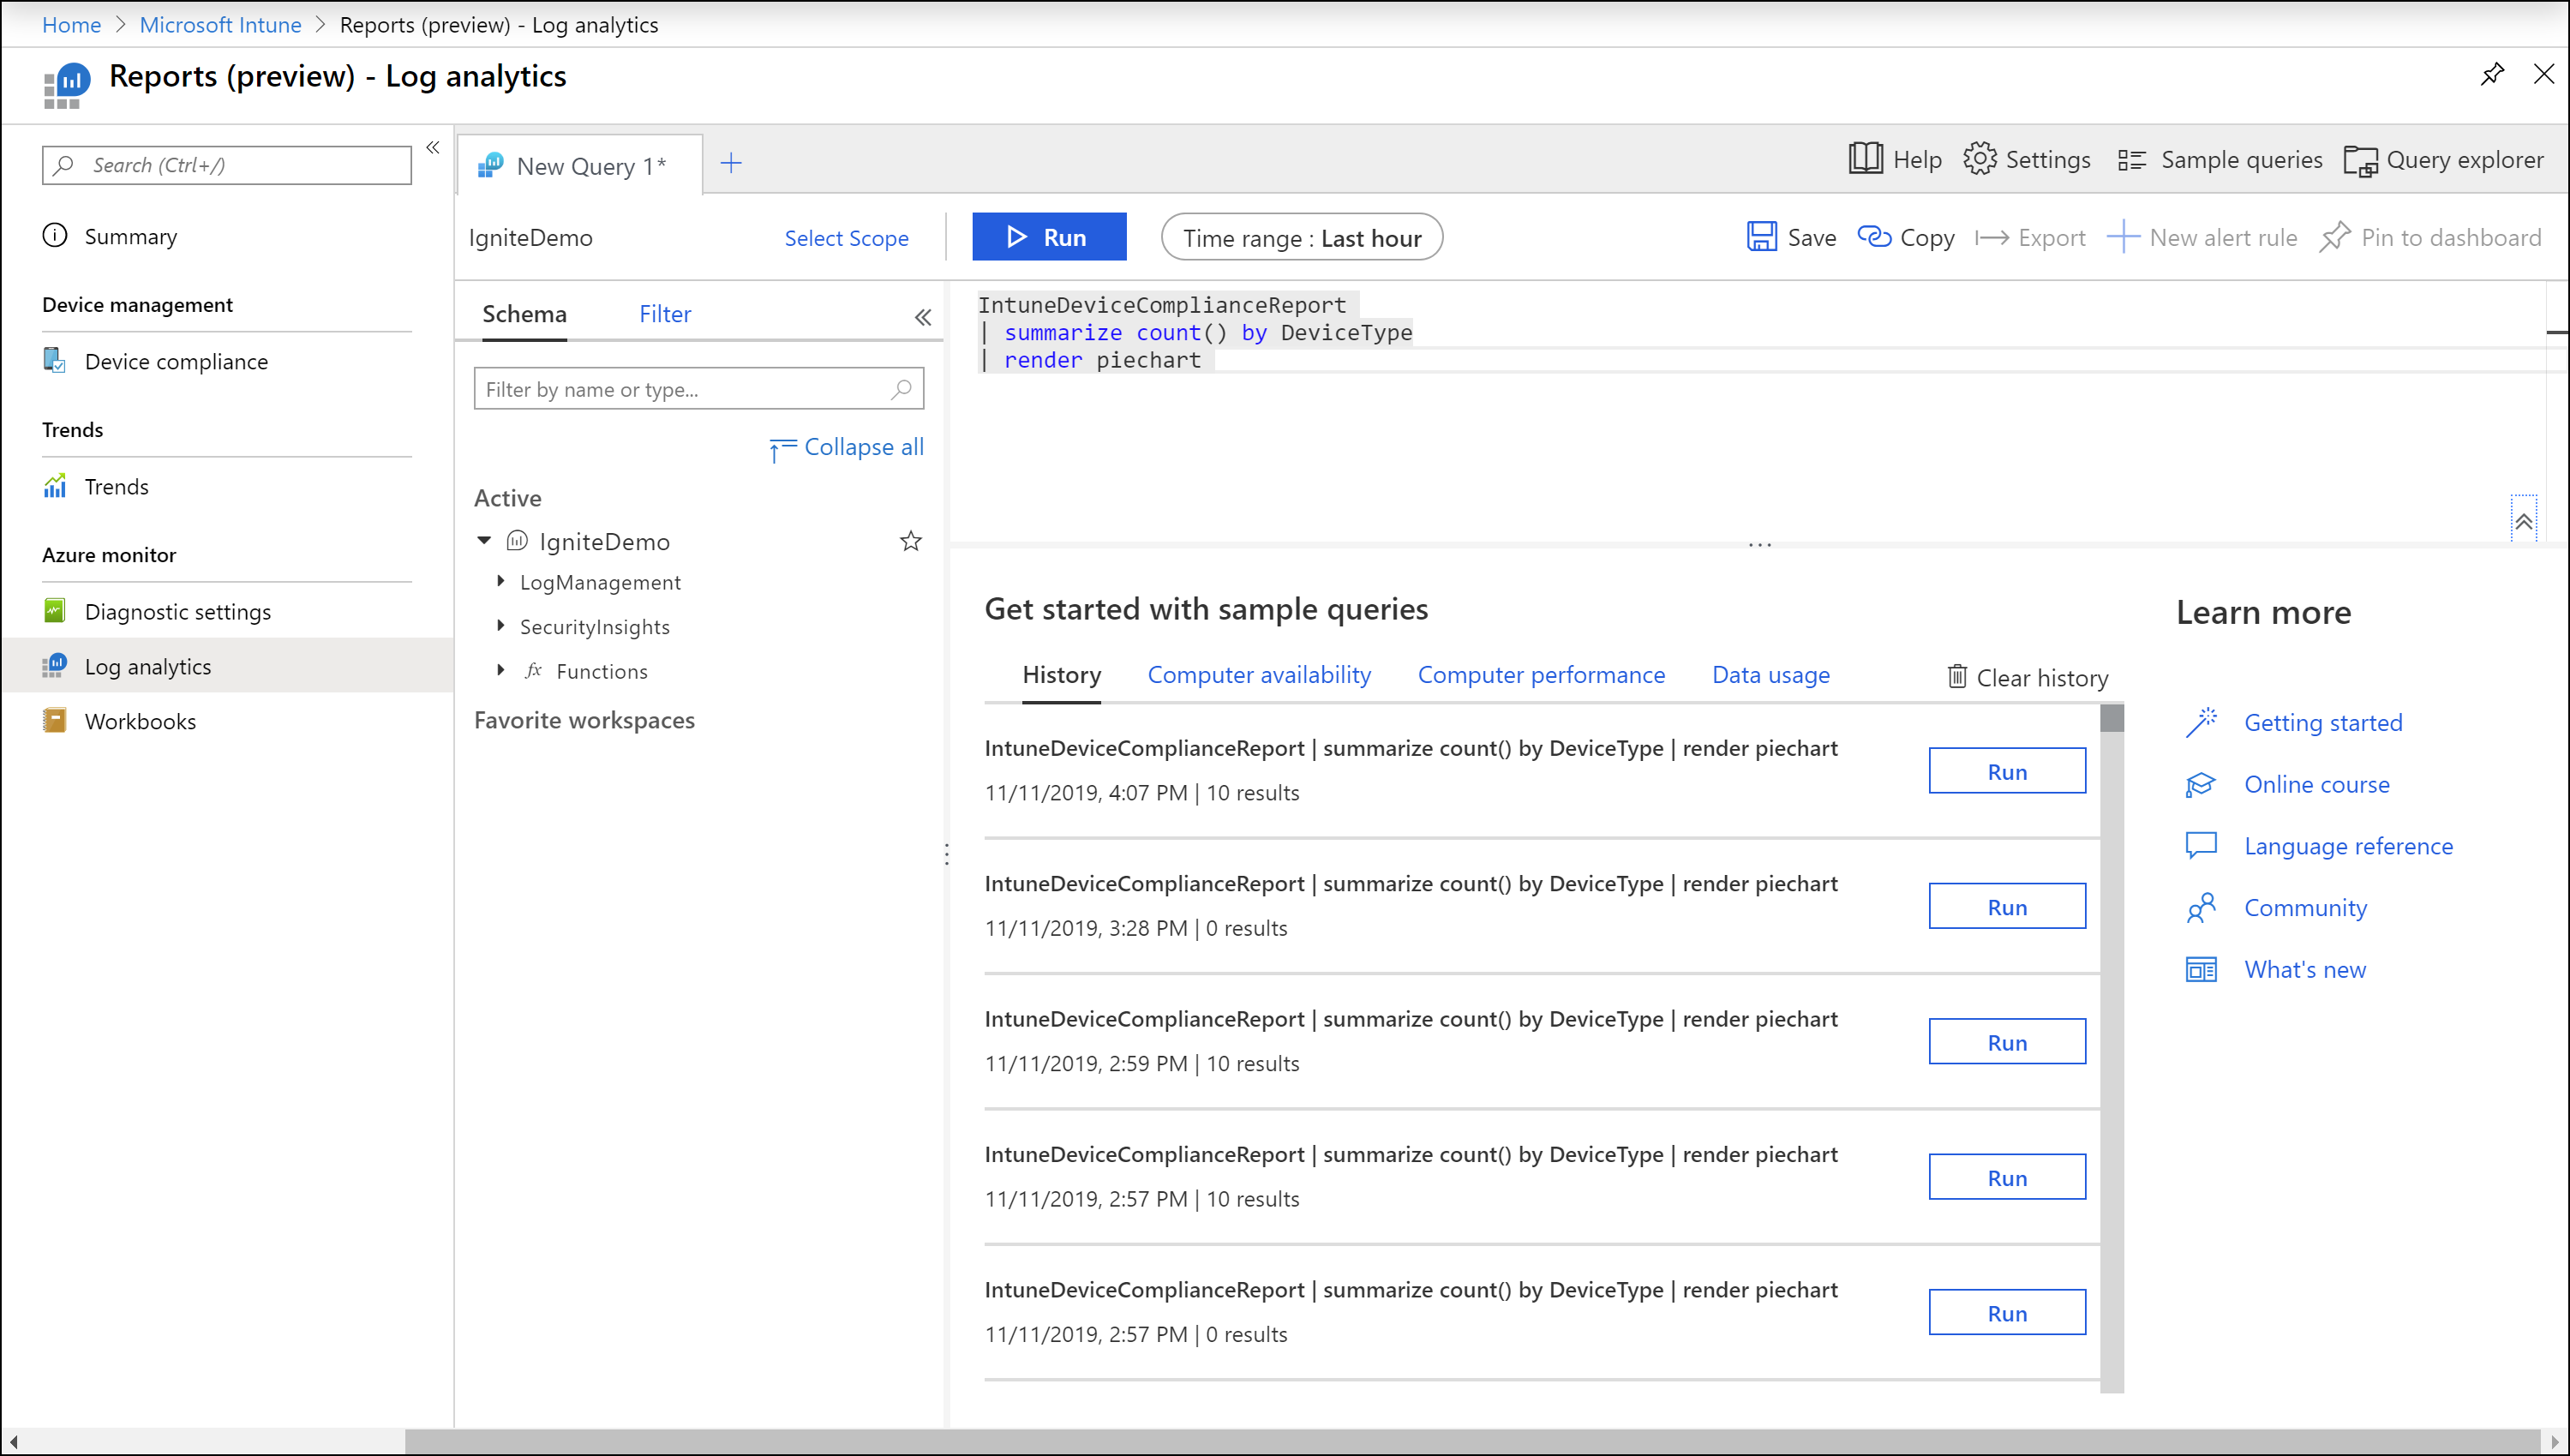
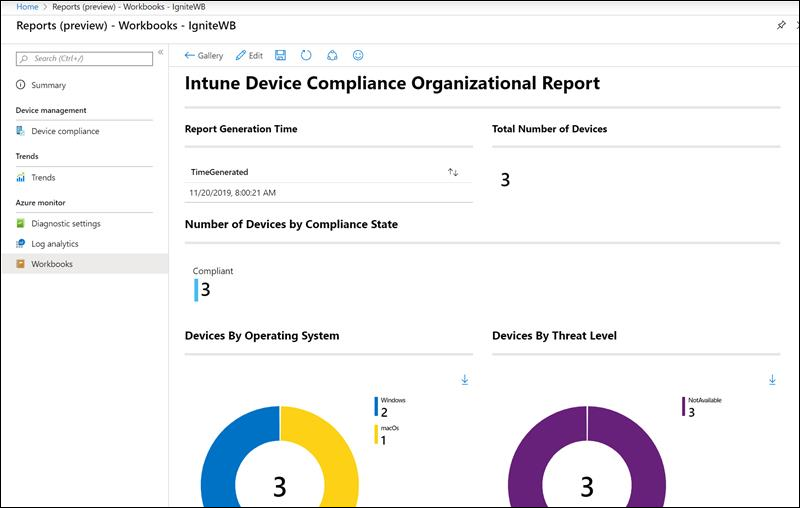
Select Workbooks to create or open an interactive report using Azure Monitor workbooks.
Diagnostic settings
Each Azure resource requires its own diagnostic setting. The diagnostic setting defines the following for a resource:
- Categories of logs and metric data sent to the destinations defined in the setting. The available categories will vary for different resource types.
- One or more destinations to send the logs. Current destinations include Log Analytics workspace, Event Hubs, and Azure Storage.
- Retention policy for data stored in Azure Storage.
A single diagnostic setting can define one of each of the destinations. If you want to send data to more than one of a particular destination type (for example, two different Log Analytics workspaces), then create multiple settings. Each resource can have up to five diagnostic settings.
For more information, about diagnostic settings, see Create diagnostic setting to collect platform logs and metrics in Azure.
Log Analytics
Log Analytics is the primary tool in the Azure portal for writing log queries and interactively analyzing the results of the queries. Even if a log query is used elsewhere in Azure Monitor, you'll typically write and test the query first using Log Analytics. For details about using Log Analytics and creating log queries, see Overview of log queries in Azure Monitor.
Workbooks
Workbooks combine text, Analytics queries, Azure Metrics, and parameters into rich interactive reports. Workbooks are editable by any other team members who have access to the same Azure resources. For more information about workbooks, see Azure Monitor workbooks. Also, you can work with and contribute to workbook templates. For more information, see Azure Monitor Workbook Templates.
Other reports
Device actions report
Use the Device Action report to view a list of requested device actions and their statuses. For each device action, the report provides the id, Device Name, User ID, IMEI, Action Status, Initiated By, and Date/Time. This device information is valuable to help maintain compliance, ensure security, and streamline your audit processes.
You can view the Device action report using the following steps:
- Sign in to the Microsoft Intune admin center.
- Select Devices > Monitor > Device actions.
Next steps
Learn more about the following technologies: