Connect to the Microsoft Copilot Dashboard for Microsoft 365 customers
Note
This feature is rolling out gradually to all customers with more than 100 Copilot assigned licenses.
Note
The Microsoft Copilot Dashboard in Viva Insights is available to any customer with a Microsoft 365 or Office 365 subscription for business or enterprise. Neither a paid Viva Insights license nor a Copilot license is required to view the dashboard. However, for tenants with more than 100 Copilot licenses or tenants with more than 10 Viva Insights licenses, the dashboard includes full capabilities with metrics and advanced filters. Learn more about which features are available based on your tenant’s assigned license.
Copilot for Microsoft 365 works alongside you to unleash your creativity and help you perform tasks faster. It helps summarize key points and action items in Microsoft Teams, draft new documents in Word, jumpstart replies in Outlook, and more.
The Microsoft Copilot Dashboard in Viva Insights helps organizations maximize the value of Copilot for Microsoft 365. It provides actionable insights to help your organization get ready to deploy AI, drive adoption based on how AI is transforming workplace behavior, and measure the impact of Copilot.
The dashboard covers the following categories of metrics: Readiness, adoption, impact, and sentiment. Metrics are aggregated at the tenant level or user level, depending on the licenses your tenant has. See the table below for more information.
Note
The Microsoft Copilot Dashboard is currently not available for national/regional cloud deployments including but not limited to Microsoft’s U.S. Government clouds and Office 365 operated by 21Vianet.
The types of insights and features provided by the dashboard vary depending on the number of Copilot licenses your tenant has, as well as whether your tenant has a paid Viva Insights license. The table below summarizes the availability of dashboard features based on your licenses.
Feature availability based on licenses
Note
A minimum of 10 assigned Viva Insights licenses, or 100 assigned Copilot licenses, is required for data processing to kick off. Data processing takes an estimated three to five days following license assignment.
| Total number of Copilot assigned licenses in tenant | Viva Insights assigned license in the tenant (Yes or No) | Availability of features in Microsoft Copilot Dashboard |
|---|---|---|
| N/A | Yes (at least 10) | All features: |
| 100 or more | N/A | All features: |
| Less than 100 | N/A | Limited features: |
Access the dashboard in Viva Insights
Applies to: Employee users
If you have access to the Copilot Dashboard, you can find it in the Teams or web app.
Open the Teams app on desktop or the web. If you have the Viva Insights app pinned, select it from the left bar.
If you don’t have the Viva Insight app pinned, select the ellipses on the left. Then in the search field, enter Microsoft Viva Insights, and select it.
On the left navigation panel, select Copilot Dashboard.
To learn more about the data in the dashboard, refer to Interpreting the dashboard data.
Delegate access to the dashboard
If you have access to the dashboard, you can also delegate access to the dashboard to other people in your company. Learn how.
How access to the Copilot dashboard is determined
For customers who use Microsoft Entra ID (formerly known as Azure Active Directory) to manage user profile data like organization or manager data, the Copilot Dashboard is automatically available to a limited number of users. Access is based on Microsoft Entra ID Data, specifically the manager hierarchy attribute. Global admins can disable access at any time.
Users who are senior leaders within large teams as determined by their Entra ID data manager attribute can automatically view the report. Tenants must meet all of the following criteria to qualify:
- Most users in the tenant have the Manager ID attribute assigned
- Most users in the tenant are part of a single reporting line
- The tenant has more than 2,500 seats
For those qualifying tenants, only users who meet both of the following criteria are enabled by default:
- The user’s in the top three levels in the organization
- The user has a significant portion of the organization in their reporting line
- Users who are assigned the Global administrator role also have access to the Microsoft Copilot Dashboard
The criteria above are analyzed on a weekly basis to capture any major org changes. Each week, any new users who meet the above criteria gain access to the dashboard. The Microsoft 365 Global Admin can revoke access to those users through the Microsoft 365 admin center and they are not added back unless the admin re-enables them. In addition, admins can disable access to the Copilot Dashboard for their entire organization.
Global admins can also enable or disable automatic access to the dashboard using PowerShell. If you’re a Microsoft 365 global admin, learn more about how to manage access to the dashboard.
Manage settings for the Copilot dashboard
As a Microsoft 365 global admin or Viva Insights admin, you can configure several features of the Microsoft Copilot Dashboard. Learn how.
Interpreting the data
Readiness
Note
Readiness data in the dashboard represents data over the previous 28 days. There’s a four-day data delay from the current date. For example, if you viewed the data on Wednesday, March 20, 2024, the dashboard represents activity between Saturday, February 17 and Friday, March 15.
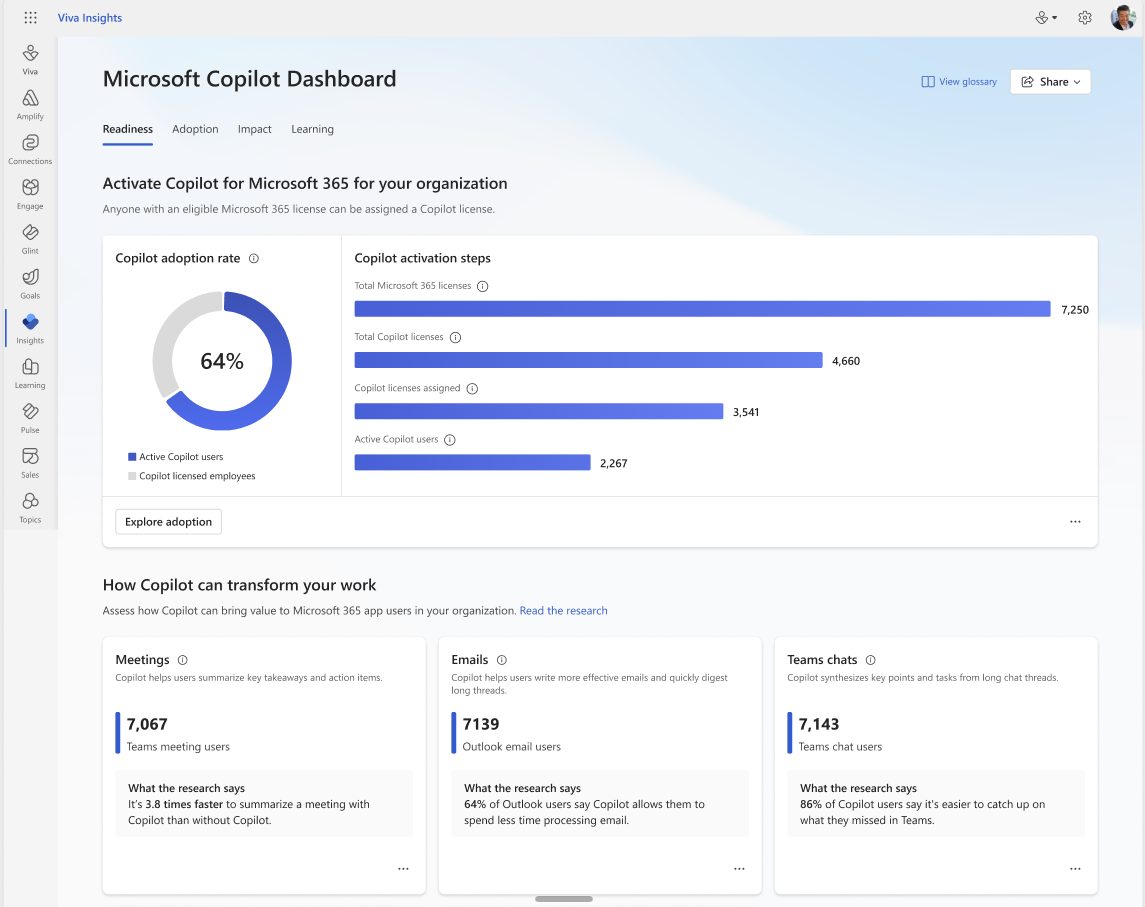
The information in this tab helps you assess your organization’s overall readiness for Copilot for Microsoft 365. The tab does not provide a comprehensive summary of all readiness and eligibility requirements. For a full set of requirements see this page: Microsoft 365 Copilot requirements.
Copilot activation progress
The metrics in this section summarize your organization’s progress towards activating Copilot for Microsoft 365 for your users. See detailed definitions in the table.
| Metric | Definition | More information |
|---|---|---|
| Total Microsoft 365 licenses | Number of prerequisite Microsoft 365 and Office 365 licenses purchased by your company. | Users must be assigned a prerequisite Microsoft 365 or Office 365 license in order to be assigned a Copilot for Microsoft 365 license. See the full list here. This metric represents a license count, not a user count, so the value shown here may be smaller or larger than your total employee count. The metric includes Microsoft 365 E3 and E5 Extra Features licenses in addition to standard Office 365 and Microsoft 365 licenses. |
| Total Copilot licenses | Number of Copilot for Microsoft 365 licenses purchased by your company. | This number may be smaller than the “Copilot licenses assigned” figure below because it's limited to Copilot for Microsoft 365 licenses, whereas the metric below may include users enabled for Copilot for Microsoft 365 service plans via other license types, like Copilot for Sales. |
| Copilot licenses assigned | Number of employees in your company who have been assigned a Copilot license. | This definition is consistent with the "assigned licenses" metric in the Copilot Readiness report in the Microsoft 365 Admin Center. This number may be larger than the number above (see explanation in row above). |
| Active Copilot users | Number of employees in your company who have completed at least one Copilot action over the previous 28 days. | A user is considered active if they performed an intentional action for an AI-powered capability in Copilot within Microsoft Teams, Copilot with Graph-grounded chat, Outlook, Word, Excel, PowerPoint, OneNote, or Loop. This is consistent with the definition used in Usage reports in the Microsoft 365 Admin Center. This number may exceed the number above because it counts all active users over the past 28 days, including users who have had their license removed after completing an action in Copilot, whereas the metric above is a snapshot of employees currently licensed to use Copilot for Microsoft 365. |
How Copilot can transform your work
This section of the tab summarizes how Copilot can benefit Microsoft 365 users in your organization based on Microsoft’s research on Copilot users. The list displayed on this page does not include all Microsoft 365 apps with Copilot capabilities; more will be added over time. Metric definitions are provided in the table.
| Metric | Definition |
|---|---|
| Count of Teams meeting users | Count of unique active users of Microsoft Teams meetings over the past 28 days. |
| Count of Teams chat users | Count of unique active users of Microsoft Teams chats over the past 28 days. |
| Count of Outlook email users | Count of unique active users of Outlook email capabilities over the past 28 days. |
| Count of Office app users | Count of unique active users of Word, Excel, PowerPoint, and OneNote over the past 28 days. |
Microsoft 365 admins can use the Copilot Readiness report in the Microsoft 365 Admin Center to create a licensing plan for users based on Microsoft 365 app usage and other readiness info.
Adoption and impact
The adoption and impact pages measure employees who have a Copilot license assigned.
Adoption page for companies with less than 100 assigned Copilot licenses
After your admin deploys Copilot in your organization, this page allows you to track user adoption trends per Microsoft 365 app and Copilot feature. Information is consistent with data points displayed in the Microsoft 365 admin center including the Copilot Usage report and Microsoft Adoption Score.
All metrics on this page represent aggregations over the past 28 days with a typical delay of 2-3 days. (For example, if you're viewing the report on a Monday, the data shown would represent the 28-day period ending on the most recent Friday or Saturday).
| Metric | Definition |
|---|---|
| User count per application | Count of active Copilot users per Microsoft 365 application over the past 28 days. An active user is someone who completed any intentional action in Copilot (for example, sending a prompt or generating a Word document) at least once during that timeframe. The applications included here are currently limited to Teams, Outlook, Word, Excel, PowerPoint, and OneNote. Microsoft Copilot is not yet included in the report. |
| User count per feature | Count of unique active users per Copilot feature. These counts are currently limited to activities in Teams, Word, PowerPoint, and Outlook. More features will be added over time. Feature definitions: • Summarize a Teams meeting: user used Copilot to summarize a Teams meeting. Learn more about this feature. • Summarize a Teams conversation: user used Copilot to summarize a Microsoft Teams chat or channel conversation. Learn more about this feature. • Summarize an Outlook email thread: user used Copilot to summarize an Outlook email thread. Learn more about this feature. • Summarize a Word document: user used Copilot to summarize a Word document. Learn more about this feature. • Draft a Word document: user used Copilot to create a new Word document. Learn more about this feature. • Create a PowerPoint presentation: user used Copilot to create a new PowerPoint presentation. Learn more about this feature. • Generate an Outlook email draft: user used Copilot to generate an email draft in Outlook. Learn more about this feature. • Rewrite a Word document: user used Copilot to rewrite text in a Word document. Learn more about this feature. |
| Actions per user per feature | Average number of actions completed per active user over the past 28 days for each of the features above. This metric only counts the initial step of prompting Copilot to complete some action; it does not include any post-prompt actions such as copying a meeting summary or inserting drafted email text into an email body. This metric helps you assess the intensity of use of each Copilot feature and the degree to which users have come to rely on Copilot for key productivity workflows. For example, if you have 100 users for the “Summarize a Teams meeting” feature and an actions per user value of 10, that means that on average each of those 100 users prompted Copilot in Teams meetings 10 times over the past 28 days (amounting to 1,000 prompts overall). |
Adoption page for companies with at least 100 assigned Copilot licenses or at least 10 assigned Viva Insights licenses
Note
Adoption and impact data underneath the filter represent the four complete weeks that ended on the last Saturday prior to the current date. For example, if someone viewed their data on Wednesday, March 20, 2024, the last Saturday would be March 16, and the dashboard would represent activity between Sunday, February 18 and Saturday, March 16.
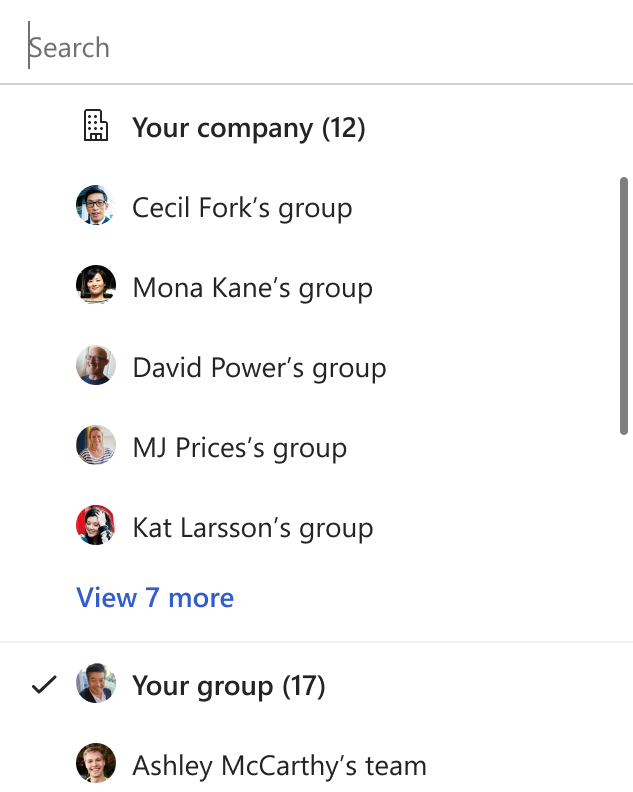
Select the filters for your analysis in the dashboard

At the top left of the adoption and impact page, next to Scope, select the dropdown to choose between viewing insights for individual teams within your entire company, or teams just within your group. You can also filter by team by selecting View by above the various metric reports.
By default, the Scope and Organization filters are determined by your Microsoft Entra ID. The advanced insights app can get organizational data in one of three ways:
- Through Microsoft Entra ID, which is the default setting
- Through an organizational data file in Microsoft 365 that your Global admin uploads
- Through an organizational data file that your Insights admin uploads
Note
If you upload an organizational data file, upload data for every employee in the company. Or, if your Insights admin has limited access to organizational data, upload data for every employee in your analysis, as well as managers in the hierarchy between those being analyzed, and the top-level leader in the company. This ensures that the Scope filter accurately reflects the hierarchy.
Note
If your Global admin and Viva Insights admin both upload organizational data, the dashboard will merge the uploads and prioritize the more recent data.
The Scope filter is based on the Microsoft Entra ID attribute "ManagerID" to populate "Your company" data and "Your group" data by default.
- If your Insights admin uploads a .csv file with the attribute of ManagerID, the "Your Group" data in the filter will update.
- If your Global admin uploads a .csv file with the attribute of Microsoft_ManagerEmail, the "Your Group" data in the filter will update.
The Organization filter corresponds to the Microsoft Entra ID data source field named "Department." If your Insights or Global admin uploads a .csv file with an organizational data attribute of "Organization," it will replace the Microsoft Entra ID data source.
- If your Insights admin uploads a .csv file with the attribute of Organization, the "Organization" data in the filter will update.
- If your Global admin uploads a .csv file with the attribute of Microsoft_Organization, the "Organization" data in the filter will update.
Finally, the Job function filter will only show if your Insights admin uploads a .csv file with the organizational data attribute of FunctionType or your Global admin uploads a .csv file with the organizational data attribute of JobDiscipline.
If your Insights admin uploads the file in the Advanced Insights app, they need to upload FunctionType attributes for you to see the Job function dropdowns.
If your Global admin uploads the file in the Microsoft 365 admin center, the need to upload Microsoft_JobDiscipline attributes for you to see the Job function dropdown.
With this version of the dashboard, three main insights are covered.
At the top of the page, you’ll see tallies for Copilot licensed employees, and Active Copilot users. Let’s define these terms.
- Copilot licensed employees: The total number of employees with a Copilot license.
- Active Copilot users: Employees who performed at least one Copilot activity in the previous 28 days.
Now let’s look at the insights provided by this page.
Insight #1: High-level overview of Copilot usage across the organization

Insight #2: Breakdown of Copilot usage across different Microsoft 365 apps
App totals reflect the total number of adoption metrics in the following Microsoft 365 apps: Microsoft Teams, Outlook, Word, Excel, PowerPoint, OneNote, Loop, and Copilot chat (formerly Microsoft 365 Chat).
Group totals reflect the sum of groups that are above the minimum group size.
Group with less than the minimum group size your Insights admin set won’t be included the sum total.
When a different “View by” attribute is selected, the Group totals might show different numbers. Because there might be people who don’t report to anyone as detected by Entra, there might be people missing the selected organizational attributes. Learn more about uploading organizational data.

Key metrics for this page:
| Metric | Definition |
|---|---|
| Copilot licensed employees | The number of users who have a Copilot license in the past 28 days. |
| Percentage of Copilot licensed employees | The percentage of Copilot licensed users out of the total measured population in that group (Copilot and non-Copilot users). |
| Active Copilot users | The number of users who used Copilot at least once in any of the following Microsoft 365 apps during the last 28 days: Microsoft Teams, Microsoft Outlook, Microsoft Office, and Microsoft Copilot. |
| Percentage of active Copilot users | The percentage of active Copilot users out of the number of Copilot licensed users for the given time period. |
| Inactive Copilot users | The number of users who have a Copilot license and haven’t been active in Copilot in the last 28 days. |
| Non-Copilot users | The number of users who don't have a Copilot license in the last 28 days. |
| Copilot actions taken | The number of actions in Microsoft Copilot completed by active Copilot users. |
| Meetings summarized by Copilot | The number of meetings summarized by Copilot. |
| Meeting hours summarized by Copilot | The number of hours of meetings summarized by Copilot. |
| Meeting summaries created by Copilot | The number of times users summarized meetings using Copilot. |
| Emails sent using Copilot | The number of emails sent with assistance from Copilot. |
| Email drafts generated by Copilot | The number email drafts users generated using Copilot. |
| Email coaching actions taken using Copilot | The number of times users selected coaching by Copilot in Outlook. |
| Email thread summaries created by Copilot | The number of times users summarized email conversations using Copilot. |
| Document drafts created by Copilot | The number of times users drafted Word documents with Copilot. |
| Document summaries created by Copilot | The number of times users summarized Word documents using Copilot. |
| Presentations created by Copilot | The number of times users created PowerPoint presentations using Copilot. |
| Rewrite text actions taken using Copilot | The number of times users modified text in Word documents using Copilot. |
| Presentation summaries created by Copilot | The number of times users summarized PowerPoint presentations using Copilot. |
| Excel formulas created by Copilot | The number of times users generated new columns with formulas based on Excel data using Copilot. |
| Excel analysis actions taken using Copilot | The number of times users analyzed data to show insights as charts, PivotTable objects, summaries, trends, or outliers in Excel using Copilot. |
| Excel formatting actions taken using Copilot | The number of times users highlighted, sorted, and filtered tables in Excel using Copilot. |
| Copilot chat queries submitted | Number of Copilot chat queries submitted by users. |
| Chat conversation summaries created by Copilot | The number of times users summarized chats and channel conversations in Teams using Copilot. |
| Chat message drafts composed using Copilot | The number of chat and channel message drafts created in Teams using Copilot. |
| Chat conversations summarized by Copilot | The number of chats and channel conversations summarized by Copilot. |
| Chats sent | The number of chat messages sent by users using Copilot. |
Key actions users can take in the report:
| Action | What can they do |
|---|---|
| View by | Default view: Group Users can change this to view the data by other organizational attributes like Organization and Job function. |
| Filters | Default view: No filters applied. Users can apply filters on three organizational attributes if available: Group, Organization, and Job function. |
The organizational attributes described above are generated from either Microsoft Entra ID or the attributes uploaded by your Viva Insights or Global admin. If the attributes are generated from Microsoft Entra ID, only “Organization” attribute will be populated. If you want to use other attributes like Job function, the Viva Insights or Global admin needs to upload this data.
The default attributes available in the dashboard are Organization and Job function. If you need to perform an analysis using different attributes uploaded by your admin, you can set up a custom person query.
Impact page for companies with less than 100 assigned Copilot licenses
Located within the Impact page, the Sentiment section provides information that helps you assess Copilot impact from the perspective of users' subjective experiences. In the main table on this page, you’ll see a list of Microsoft’s recommended Copilot survey questions along with the results from your own organization’s latest survey (if an admin chooses to upload results for visualization here) and Microsoft’s own benchmark results from a study of early Copilot users.
Suggested Copilot survey questions
To measure Copilot user sentiment in your organization, we recommend delivering a survey to users in which you ask them to indicate the extent to which they agree with the following four statements:
- Using Copilot helps improve the quality of my work or output
- Using Copilot helps me spend less mental effort on mundane or repetitive tasks
- Using Copilot allows me to complete tasks faster
- When using Copilot I am more productive
For each of these, we recommend allowing users to indicate whether or not they Strongly Disagree, Disagree, Neither Agree Nor Disagree, Agree, or Strongly Agree with the statement. You can then combine the “Agree” and “Strongly Agree” responses to compute the % of users who agreed with each statement and compare results with the Microsoft benchmarks shown in this tab.
Your user survey does not need to be limited to these four statements, but we recommend including them at a minimum for easy comparison with Microsoft’s benchmark results.
Upload tenant-level survey results through the Microsoft 365 admin center
Microsoft 365 global admins can upload aggregated survey results through Adoption Score in the Microsoft 365 admin center. Learn how.
Impact page for companies with at least 100 assigned Copilot licenses
This page helps you assess Copilot impact by layering the results of Microsoft's quantitative and qualitative research on top of your organization's Copilot and Microsoft 365 usage patterns.
At the top of the page, you’ll see tallies for Active Copilot users, Copilot actions taken, and Copilot assisted hours. Let’s define these terms.
Active Copilot users: The total number of employees who performed at least one Copilot activity in the previous 28 days.
Copilot actions taken: The total number of actions taken using Copilot across Microsoft 365 apps.
Copilot assisted hours: This is an estimate of the total time employees were assisted by using Copilot over the past 28 days. Employees can re-invest time savings from Copilot in learning, training, skilling, and having a greater business impact. The metric is computed based on your employees’ actions in Copilot and multipliers derived from Microsoft’s research on Copilot users. The metric should be viewed as a general estimate based on the most relevant Copilot usage data and research currently available. The underlying calculation methodology will evolve over time as new information becomes available. Select How do we estimate this to see a breakdown of how the total figure is calculated. See more information on the calculation below.
Details on the "Copilot assisted hours" metric
The Copilot assisted hours metric is a general estimate that tries to leverage the latest research on AI and productivity to describe your employees’ use of three types of Copilot capabilities described in the table below. Copilot usage metrics are aggregated within each category, then multiplied by an assistance factor to determine hours assisted per category. The three resulting values are then added together to produce the final Copilot assisted hours metric. Please note that these are broad approximations based on the best available research rather than precise calculations. As more research becomes available, we will update our approach.
| Copilot capability | Metric(s) counted | Assistance factor | Source of assistance factor (if applicable) |
|---|---|---|---|
| Meeting summaries | Meeting hours summarized by Copilot | The full duration of each meeting summarized is counted towards total assisted hours (e.g. if a user summarizes an hour-long meeting after it has ended, that counts as one assisted hour). | N/A |
| Search and summaries | Copilot chat queries submitted Email thread summaries created by Copilot Document summaries generated by Copilot Presentations summarized by Copilot Spreadsheet analyses completed using Copilot Chat threads summarized by Copilot |
6 minutes per search or summary action | In a study of 163 knowledge workers, users were able to retrieve information across files, emails, and calendars 6 minutes faster with Copilot versus without Copilot. See study #4 in section 2 of this blog post. |
| Creation | Email coaching actions using Copilot Email drafts generated by Copilot Documents drafted by Copilot Presentations created using Copilot Rewrite text actions taken using Copilot Excel formula calculations completed using Copilot Excel formatting actions completed using Copilot Chat messages composed using Copilot |
6 minutes per creation action | In a study of 147 knowledge workers, people were able to complete a writing task (drafting a blog post) 6 minutes faster with Copilot versus without Copilot. See study #1 in section 2 of this blog post. Creation is especially difficult to summarize in a single number, so this number should be in particular understood to be a broad estimate. As research improves, we will adjust our methodology. |
Key insights for this page:
On any card, select Explore more to dive into these metrics.
Important
Copilot is not likely to be solely responsible for any metric differences shown in the dashboard. In addition to Copilot, multiple organizational factors, such as seasonality, role shifts, or organizational changes, may influence changes in these metrics.
Comparison between groups
This analysis helps you compare usage patterns between two groups. Analysts can use this to compare usage patterns between Copilot and non-Copilot users, or even two different Copilot user groups.
There are the four categories of users:
Copilot licensed employees: Employees who have been assigned a Copilot license
Non-Copilot users: Employees who have not been assigned a Copilot license
Active Copilot users: Employees who performed at least one Copilot activity in the previous 28 days
Inactive Copilot users: Employees assigned a Copilot license but who have not performed at least one Copilot activity in the previous 28 days
Comparison between Copilot and non-Copilot users
This analysis helps you compare collaboration activities between employees who use Copilot and those who don’t, based on a specific metric. For instance, you can select Meeting hours as your metric to analyze the meeting hours per person for both Copilot users and non-Copilot users across the filters you’ve selected.
Key Copilot metrics for this page:
| Category | Metric | Definition |
|---|---|---|
| Meetings | Meetings summarized by Copilot | The number of meetings summarized by Copilot. |
| Attended meetings | The number of meetings users attended in Teams which had two or more attendees. | |
| Conflicting meeting hours | The number of meeting hours where users had overlapping meetings on their calendar. The count includes only the amount of time that overlaps. | |
| Meeting hours | The number of hours users spent in meetings with at least one other person during and outside of working hours. | |
| Multitasking meeting hours | The number of hours users spent sending or reading emails or chats, posting or replying to Teams channels messages, or visiting Teams channels during a meeting or Teams call. | |
| Meeting hours summarized by Copilot | The number of hours of meetings summarized by Copilot. | |
| Chat | Chat conversation summaries created by Copilot | The number of times users summarized chats and channel conversations in Teams using Copilot. |
| Chats sent | The number of chat messages sent by users using Copilot. | |
| Chat conversations summarized by Copilot | The number of chats and channel conversations summarized by Copilot. | |
| Emails | Emails sent using Copilot | The number of emails sent with assistance from Copilot. |
| Email coaching actions taken using Copilot | The number of times users selected coaching by Copilot in Outlook. | |
| Emails sent | The number of emails sent by users. | |
| Email drafts generated by Copilot | The number email drafts users generated using Copilot. | |
| Email thread summaries created by Copilot | The number of times users summarized email conversations using Copilot. | |
| Documents | Document drafts created by Copilot | The number of times users drafted Word documents with Copilot. |
| Document summaries created by Copilot | The number of times users summarized Word documents using Copilot. | |
| Presentations created by Copilot | The number of times users created PowerPoint presentations using Copilot. | |
| Presentation summaries created by Copilot | The number of times users summarized PowerPoint presentations using Copilot. | |
| Excel analysis actions taken using Copilot | The number of times users analyzed data to show insights as charts, PivotTable objects, summaries, trends, or outliers in Excel using Copilot. | |
| Excel formulas created by Copilot | The number of times users generated new columns with formulas based on Excel data using Copilot. | |
| Excel formatting actions taken using Copilot | The number of times users highlighted, sorted, and filtered tables in Excel using Copilot. |
Key behavior metrics for this page:
| Category | Metric | Definition |
|---|---|---|
| Meetings | Conflicting meeting hours | The number of meeting hours where employees had overlapping meetings on their calendar. The count includes only the amount of time that overlaps. |
| Attended meetings | The number of meetings users attended in Teams that had two or more attendees. | |
| Meeting hours | The number of hours employees spent in meetings with at least one other person during and outside of working hours. | |
| Total meetings | The number of meetings an employee organized, accepted, or joined. | |
| Multitasking meeting hours | The number of hours employees spent sending or reading emails or chats, posting or replying to Teams channels messages, or visiting Teams channels during a meeting or Teams call. | |
| Chat | Chats sent | The number of chat messages sent by employees using Copilot. |
| Emails | Emails sent | The number of emails sent by employees. |
Sentiment
Located within the Impact page, this section provides information that helps you assess Copilot impact from the perspective of users' subjective experiences. In the main table on this page you’ll see a list of Microsoft’s recommended Copilot survey questions along with the results from your own organization’s latest survey (if an admin chooses to upload results for visualization here) and Microsoft's own benchmark results from a study of early Copilot users.
Sentiment results by group
With a Viva Insights subscription, this section of the dashboard also lets you explore the breakdown of sentiment across organizational attributes. You can use custom filters to isolate the results for specific parts of the organization or for specific employee groups. The results are shown in a “heat map.”

Upload user-level survey results with the advanced insights app
Applies to: Viva Insights admin
If you have a Viva Insights subscription and you’re a Viva Insights admin, you can upload survey results as a .csv file.
Your survey should include each of the following statements:
Using Copilot helps improve the quality of my work or output
Using Copilot helps me spend less mental effort on mundane or repetitive tasks
Using Copilot allows me to complete tasks faster
When using Copilot I am more productive
If you upload survey results via .csv file, regardless of the format of survey responses you received, the data needs to be uploaded in a standard format that Viva Insights can understand. It’s possible that different survey tools provide outputs in different formats for the survey. Some tools might provide a 5-point scale, some may provide output as a string (“Strongly agree,” “agree,” “neutral,” “disagree,” or “strongly disagree”), and tools like Glint would provide a precalculated score as the output.
Therefore, the admin must convert the survey responses to a 100-point scale, with 100 representing the most positive survey response.
This is how they can convert the scores into a 100-point scale:
If the survey output is a 5-point rating:
| Survey output (rating) | Normalized 100-point scale |
|---|---|
| 1 | 0 |
| 2 | 25 |
| 3 | 50 |
| 4 | 75 |
| 5 | 100 |
Or, if the survey output is in a string format:
| Survey output (strings) | Normalized 100-point scale |
|---|---|
| Strongly disagree | 0 |
| Disagree | 25 |
| Neutral | 50 |
| Agree | 75 |
| Strongly agree | 100 |
Important
The admin must upload the questions in the same order in which they’re shown below.
| Column name in CSV file | Actual question |
|---|---|
| Question 1 | Using Copilot helps improve the quality of my work or output |
| Question 2 | Using Copilot helps me spend less mental effort on mundane or repetitive tasks |
| Question 3 | Using Copilot allows me to complete tasks faster |
| Question 4 | When using Copilot I am more productive |
Format of the .csv file: The.csv file itself should also be formatted like this:
| User AAD ID/Email address | Question 1 | Question 2 | Question 3 | Question 4 |
|---|---|---|---|---|
| abc@test.com | 75 (Normalized score) | 25 (Normalized score) | 0 (Normalized score) | 100 (Normalized score) |
| xyz@test.com | 25 | 75 | N/A | 100 |
The cells for the responses may contain “N/A” values for employees who did not respond to the question.
For additional guidance on how to format your .csv file, refer to this example formatted .csv: Impact Dashboard survey sample file.
Once you’ve formatted the .csv file accordingly, use these steps to upload it:
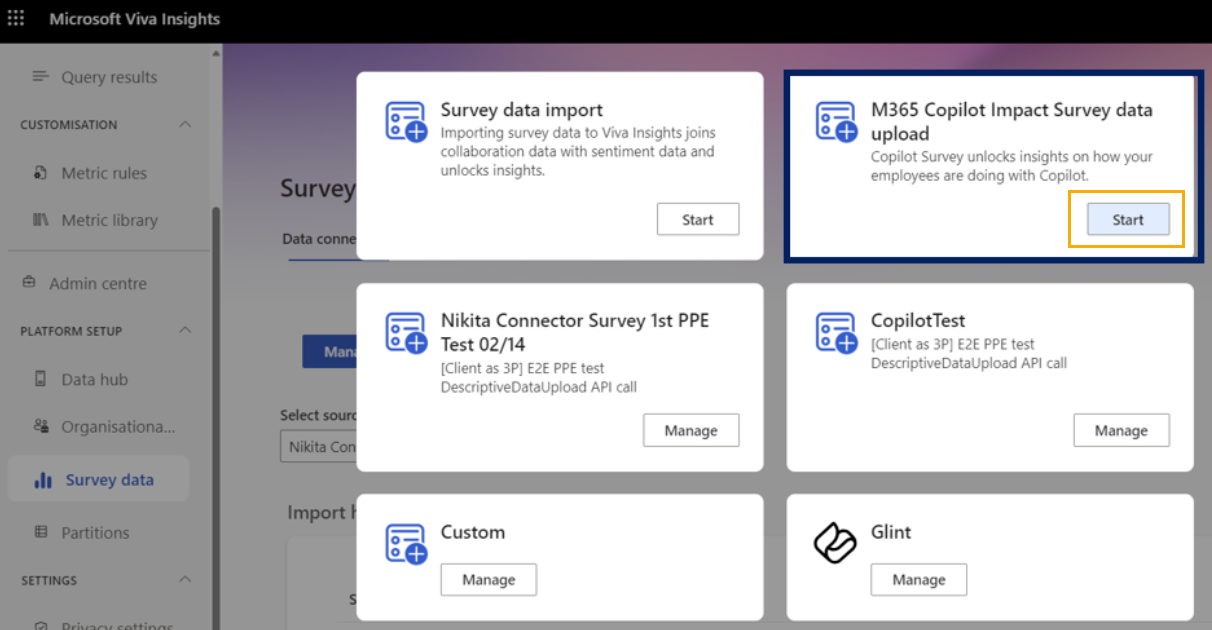
In the Viva Insights analyst experience, select Survey data.
Under Survey data at the top, select Data connections, then select Manage data sources.
Under M365 Copilot Impact Survey data upload, select Start. If you previously uploaded survey data, this new import will replace the old data.
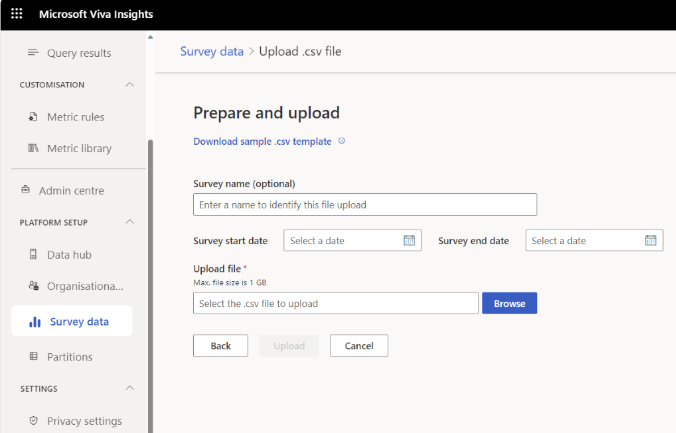
On the next page, enter an optional survey name and start and end dates. Then browse to find your .csv file, and select Upload.

News & research
Under the Learning tab, here you find research around the impacts of AI on workplace productivity. Use this page to stay up to speed on the latest findings from Microsoft’s own AI research teams.
Add Copilot metrics to your custom person query
Applies to: Viva Insights analyst
You can also add Microsoft 365 Copilot metrics to your custom person query. Learn how in Add metrics.
FAQs
Data upload
Q1. If I’ve already uploaded HR data for Viva Insights licensed users, how do I upload it for all Copilot users and non-Copilot users?
Your Viva Insights admin can continue to use the advanced Insights app to upload the data for Copilot and non-Copilot users. Or, if you no longer have a Viva Insights license, your Global admin can upload the data through the Microsoft 365 admin center.
Q2. I previously had a Viva Insights trial license that has expired. Do I need to re-upload organizational or survey data?
No. However, if you’d like to upload more recent data for additional employees, your Global admin can do this through the Microsoft 365 admin center.
Setup and licenses
Q1. How does data in the Copilot dashboard compare to usage reports in the admin center? Both the Microsoft Copilot dashboard and the admin center usage reports leverage the same underlying data set, but they're intended for different audiences. The Copilot dashboard is intended for organizational leaders and technology decision makers, while the admin center report is intended for IT admins. Also, differences in each report’s prerequisites and time periods might cause data discrepancies.
Differences in the data are often caused by at least one of the following:
- Users must be assigned a Viva Insights license to be measured in the Copilot dashboard. This prerequisite is not required for the admin center report, so the number of measured employees might be different.
- The Copilot dashboard measures Copilot activities only for employees who have a Viva Insights license at the time the report is run. The admin center report, however, processes data for employees who had a Copilot license at any point during the reporting period.
- The time frame for which the analysis is being applied may be different. Refer to the time frame provided on each report’s dashboard. The Copilot dashboard represents data over the previous 28 days. The admin center, however, uses a rolling window for its reports, for the last 7, 30, 90, or 180 days. There might also be differences in data delays. The admin center report is produced within 72 hours, while the Copilot dashboard might have an additional delay of one to two days.
- Data in the Copilot dashboard is aggregated to meet a minimum privacy threshold.
Q2. Where can users access the Microsoft Copilot Dashboard? Employees can view the dashboard in the Viva Insights Teams or web app.
Q3. How long after enablement can users access the Copilot dashboard? Users can access the dashboard less than 24 hours after being enabled.
Q4. Do I need a paid Viva Insights subscription in order to access the report's aggregated, tenant-level, or user-level insights?
No, a Viva Insights subscription is not required to access Copilot dashboard. Your ability to view tenant-level or user-level insights depends on the number of assigned Copilot licenses within your tenants. Learn more here.
Q5. In the Sentiment section I only see metrics related to changes in employee behavior after using Copilot, but no survey responses. Why?
Your admin has not uploaded any survey data for your organization. Use the steps above to upload it.
Q6. Who is considered a Copilot licensed employee? Any employee who has been assigned a Copilot license, including the following service plans:
- Microsoft 365 Copilot in Productivity Apps
- Microsoft 365 Copilot in Microsoft Teams
- Connectors and Plugins for Microsoft 365 Copilot
- Business Chat
- Intelligent Search
Q7. After I assign new Viva Insights licenses for the first time, how long will it take for the Copilot Dashboard to turn on with the data? To start data processing, you'll need to assign at least 10 licenses. Once you do that, the process could take up to a week. Learn how to assign licenses.
Q8. After the dashboard is turned on with the data, if I subsequently assign new Viva Insights licenses, how long will it take for the new data to reflect in the dashboard? Once you assign a new license to your employees, it will take up to two weeks to update and include the employees with the new assigned license.
Q9. If I assign new Copilot licenses to people, when will I see their data in the dashboard? Once you assign a new Copilot license to your employees, it will take up to one week to update and include the employees with the new assigned license.
Q10. If I reassign Copilot licenses to different employees who did not previously have Copilot licenses, how does that impact the measured group on each page of the dashboard? The measured period includes all employees who were enabled for Copilot at any point during that time period. This means that employees who had a license that was reassigned will still be included in the metrics.
Q11. If I don’t assign any new licenses, when and how often does the dashboard data update? The dashboard refreshes with updated data every Tuesday.
Q12. What can enabled users see in the dashboard? The dashboard’s advanced features provide more granular views of Copilot adoption, usage patterns, user sentiment, and return on investment across groups, functional roles, and more. Business leaders who have a Viva Insights license and access to the dashboard can apply filters and group the Copilot adoption and impact metrics by organizational attributes such as organization and job function. And, Viva Insights analysts can create custom reports based on these metrics.
Q13. How often is the default-on enablement updated? To capture organizational changes, we refresh the default-on enablement on a weekly basis.
Q14. If a user is removed, will the default-on enablement refresh impact their access settings? No. Once an admin disables a user, that setting is permanent until the admin adds the user back. In the Microsoft 365 admin center, the admin can view a list of who has been disabled in the Deleted tab.
Missing data
Q1. The values I'm seeing are just "--," with a banner that reads, "It looks like your organization doesn’t use Copilot in Microsoft 365 yet." What's happening? In this scenario, your employees don't have a Copilot license assigned or they haven't used Copilot yet.
Q2. Why can't I see my senior leadership members as a selectable option within the Scope dropdown menu? In this scenario, your Entra data is not reliable, or it does not accurately reflect the reporting structure at your company. Please reach out to your global admin to see how your Entra data is set up.
Metrics
Q1. Which apps are the Copilot chat metrics based on? Copilot chat metrics are based on use of Copilot with Graph-ground chat across all apps where the capability is available including Teams, Windows, Microsoft365.com, and more. All prompts submitted via Copilot with Graph-grounded chat are counted towards Copilot chat usage in the Copilot Dashboard, in alignment with the Copilot Usage report in the Microsoft 365 Admin Center. Copilot chat metrics do not include usage of Microsoft Copilot with commercial data protection, which is made available to users with an eligible Microsoft 365 license and does not require a Copilot for Microsoft 365 license. In certain product environments such as Copilot in the Edge browser, users enabled for Copilot for Microsoft 365 may see a “work/web” toggle. The “work” toggle is a feature of Copilot with Graph-grounded chat usage and thus usage of this feature is accounted for in the Copilot Dashboard. The "web” toggle, however, is a feature of Copilot with commercial data protection and use of this feature is not yet accounted for in the Copilot Dashboard.
Q2. Within the Copilot metrics tab of the comparison between groups table, why does the % difference not show what I'm expecting to see?
The values under the first two columns (Group 1 & Group 2) are calculated using the sum. To compare groups of different sizes, the percentage difference is calculated using the per user per month average.
Q3. On the adoption page, why don’t the app usage totals match the sum of the usage of the individual features below each app?
There are two reasons for this:
The app total figure is the count of the total number of unique users who leverage Copilot within that app. The feature total also tallies the total number of unique users who leverage Copilot for that particular feature. Therefore, if the same person uses multiple Copilot features within a single app, they are still only counted once in the total app figure.
The app total refers to the total number of unique users who are active on any Copilot feature for that app, and the list of features below the app might not include every feature.
Related topic
משוב
בקרוב: במהלך 2024, נפתור בעיות GitHub כמנגנון המשוב לתוכן ונחליף אותו במערכת משוב חדשה. לקבלת מידע נוסף, ראה: https://aka.ms/ContentUserFeedback.
שלח והצג משוב עבור