Tutorial: Analyze data in Azure Monitor Logs using a notebook
Članak
Notebooks are integrated environments that let you create and share documents with live code, equations, visualizations, and text. Integrating a notebook with a Log Analytics workspace lets you create a multi-step process that runs code in each step based on the results of the previous step. You can use such streamlined processes to build machine learning pipelines, advanced analysis tools, troubleshooting guides (TSGs) for support needs, and more.
Integrating a notebook with a Log Analytics workspace also lets you:
Run KQL queries and custom code in any language.
Introduce new analytics and visualization capabilities, such as new machine learning models, custom timelines, and process trees.
Integrate data sets outside of Azure Monitor Logs, such as an on-premises data sets.
Take advantage of increased service limits using the Query API limits compared to the Azure portal.
In Azure Monitor Logs: The Logs Analytics Contributor role to read data from and send data to your Logs Analytics workspace. For more information, see Manage access to Log Analytics workspaces.
In Azure Machine Learning:
A resource group-level Owner or Contributor role, to create a new Azure Machine Learning workspace if needed.
A Contributor role on the Azure Machine Learning workspace where you run your notebook.
Kqlmagic library lets you run KQL queries directly inside a notebook in the same way you run KQL queries from the Log Analytics tool.
MSTICPY library provides templated queries that invoke built-in KQL time series and machine learning capabilities, and provides advanced visualization tools and analyses of data in Log Analytics workspace.
Other Microsoft notebook experiences for advanced analysis include:
1. Integrate your Log Analytics workspace with your notebook
Set up your notebook to query your Log Analytics workspace:
Install the Azure Monitor Query, Azure Identity and Azure Monitor Ingestion client libraries along with the Pandas data analysis library, Plotly visualization library:
Set the LOGS_WORKSPACE_ID variable below to the ID of your Log Analytics workspace. The variable is currently set to use the Azure Monitor Demo workspace, which you can use to demo the notebook.
Python
LOGS_WORKSPACE_ID = "DEMO_WORKSPACE"
Set up LogsQueryClient to authenticate and query Azure Monitor Logs.
This code sets up LogsQueryClient to authenticate using DefaultAzureCredential:
Python
from azure.core.credentials import AzureKeyCredential
from azure.core.pipeline.policies import AzureKeyCredentialPolicy
from azure.identity import DefaultAzureCredential
from azure.monitor.query import LogsQueryClient

if LOGS_WORKSPACE_ID == "DEMO_WORKSPACE":
    credential = AzureKeyCredential("DEMO_KEY")
    authentication_policy = AzureKeyCredentialPolicy(name="X-Api-Key", credential=credential)
else:
    credential = DefaultAzureCredential()
    authentication_policy = None

logs_query_client = LogsQueryClient(credential, authentication_policy=authentication_policy)
LogsQueryClient typically only supports authentication with Microsoft Entra token credentials. However, we can pass a custom authentication policy to enable the use of API keys. This allows the client to query the demo workspace. The availability and access to this demo workspace is subject to change, so we recommend using your own Log Analytics workspace.
Define a helper function, called query_logs_workspace, to run a given query in the Log Analytics workspace and return the results as a Pandas DataFrame.
Python
import pandas as pd
import plotly.express as px
from azure.monitor.query import LogsQueryStatus
from azure.core.exceptions import HttpResponseError
defquery_logs_workspace(query):try:
response = logs_query_client.query_workspace(LOGS_WORKSPACE_ID, query, timespan=None)
if response.status == LogsQueryStatus.PARTIAL:
error = response.partial_error
data = response.partial_data
print(error.message)
elif response.status == LogsQueryStatus.SUCCESS:
data = response.tables
for table in data:
my_data = pd.DataFrame(data=table.rows, columns=table.columns)
except HttpResponseError as err:
print("something fatal happened")
print (err)
return my_data
2. Explore and visualize data from your Log Analytics workspace in your notebook
Let's look at some data in the workspace by running a query from the notebook:
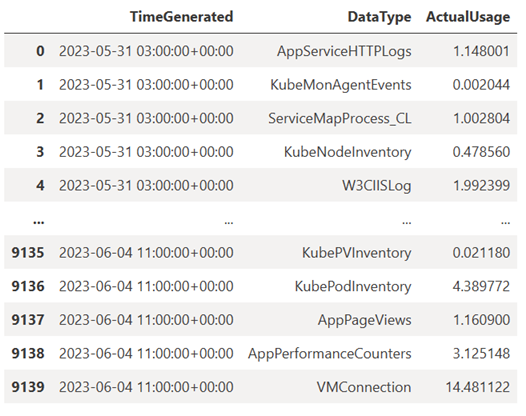
This query checks how much data (in Megabytes) you ingested into each of the tables (data types) in your Log Analytics workspace each hour over the past week:
Python
TABLE = "Usage"

QUERY = f"""
let starttime = 7d; // Start date for the time series, counting back from the current date
let endtime = 0d; // today
{TABLE} | project TimeGenerated, DataType, Quantity
| where TimeGenerated between (ago(starttime)..ago(endtime))
| summarize ActualUsage=sum(Quantity) by TimeGenerated=bin(TimeGenerated, 1h), DataType
"""

df = query_logs_workspace(QUERY)
display(df)
The resulting DataFrame shows the hourly ingestion in each of the tables in the Log Analytics workspace:
Now, let's view the data as a graph that shows hourly usage for various data types over time, based on the Pandas DataFrame:
Python
df = df.sort_values(by="TimeGenerated")
graph = px.line(df, x='TimeGenerated', y="ActualUsage", color='DataType', title="Usage in the last week - All data types")
graph.show()
The resulting graph looks like this:
You've successfully queried and visualized log data from your Log Analytics workspace in your notebook.
3. Analyze data
As a simple example, let's take the first five rows:
Define the constants you need for the Logs Ingestion API:
Python
os.environ['AZURE_TENANT_ID'] = "<Tenant ID>"; #ID of the tenant where the data collection endpoint resides
os.environ['AZURE_CLIENT_ID'] = "<Application ID>"; #Application ID to which you granted permissions to your data collection rule
os.environ['AZURE_CLIENT_SECRET'] = "<Client secret>"; #Secret created for the application
os.environ['LOGS_DCR_STREAM_NAME'] = "<Custom stream name>"##Name of the custom stream from the data collection rule
os.environ['LOGS_DCR_RULE_ID'] = "<Data collection rule immutableId>"# immutableId of your data collection rule
os.environ['DATA_COLLECTION_ENDPOINT'] = "<Logs ingestion URL of your endpoint>"# URL that looks like this: https://xxxx.ingest.monitor.azure.com
Ingest the data into the custom table in your Log Analytics workspace:
Python
from azure.core.exceptions import HttpResponseError
from azure.identity import ClientSecretCredential
from azure.monitor.ingestion import LogsIngestionClient
import json


credential = ClientSecretCredential(
    tenant_id=AZURE_TENANT_ID,
    client_id=AZURE_CLIENT_ID,
    client_secret=AZURE_CLIENT_SECRET
)

client = LogsIngestionClient(endpoint=DATA_COLLECTION_ENDPOINT, credential=credential, logging_enable=True)

body = json.loads(analyzed_df.to_json(orient='records', date_format='iso'))

try:
   response =  client.upload(rule_id=LOGS_DCR_RULE_ID, stream_name=LOGS_DCR_STREAM_NAME, logs=body)
   print("Upload request accepted")
except HttpResponseError as e:
    print(f"Upload failed: {e}")
Napomena
When you create a table in your Log Analytics workspace, it can take up to 15 minutes for ingested data to appear in the table.
Verify that the data now appears in your custom table.
Pridružite se seriji susreta kako biste s kolegama programerima i stručnjacima izgradili skalabilna rješenja umjetne inteligencije temeljena na stvarnim slučajevima upotrebe.
Write log queries to gain insights into your business, IT operations, and performance. Use Kusto Query Language (KQL) to extract log data in Azure Monitor Log Analytics.
Manage data ingestion and preparation, model training and deployment, and machine learning solution monitoring with Python, Azure Machine Learning and MLflow.
This reference information for Kusto Query Language used by Azure Monitor includes elements specific to Azure Monitor and elements not supported in Azure Monitor log queries.
In this article, query data in Azure Monitor (Application Insights resource and Log Analytics workspace) by creating Azure Data Explorer cross product queries.