Azure DevOps Server 2020 Release Notes
Developer Community | System Requirements | License Terms | DevOps Blog | SHA-1 Hashes
In this article, you will find information regarding the newest release for Azure DevOps Server.
To learn more about installing or upgrading an Azure DevOps Server deployment, see Azure DevOps Server Requirements. To download Azure DevOps products, visit the Azure DevOps Server Downloads page.
Direct upgrade to Azure DevOps Server 2020 is supported from Azure DevOps Server 2019 or Team Foundation Server 2015 or newer. If your TFS deployment is on TFS 2010 or earlier, you need to perform some interim steps before upgrading to Azure DevOps Server 2019. To learn more, see Install and configure Azure DevOps on-premises.
Safely Upgrade from Azure DevOps Server 2019 to Azure DevOps Server 2020
Azure DevOps Server 2020 introduces a new pipeline run (build) retention model that works based on project-level settings.
Azure DevOps Server 2020 handles build retention differently, based on pipeline-level retention policies. Certain policy configurations lead to pipeline runs being deleted after the upgrade. Pipeline runs that have been manually retained or are retained by a release will not be deleted after the upgrade.
Read our blog post for more information on how to safely upgrade from Azure DevOps Server 2019 to Azure DevOps Server 2020.
Azure DevOps Server 2020 Update 0.2 Patch 6 Release Date: November 14, 2023
We have released a patch for Azure DevOps Server 2020 Update 0.2 that includes fixes for the following.
- Extended the PowerShell tasks allowed list of characters for Enable shell tasks arguments parameter validation.
Note
To implement fixes for this patch you will have to follow a number of steps to manually update tasks.
Install patches
Important
We released updates to the Azure Pipelines agent with Patch 4 released on September 12, 2023. If you didn't install the agent updates as described in the release notes for Patch 4, we recommend that you install these updates before you install Patch 6. The new version of the agent after installing Patch 4 will be 3.225.0.
Configure TFX
- Follow steps in the upload tasks to project collection documentation to install and login with tfx-cli.
Update tasks using TFX
| File | SHA-256 Hash |
|---|---|
| Tasks20231103.zip | 389BA66EEBC32622FB83402E21373CE20AE040F70461B9F9AF9EFCED5034D2E5 |
- Download and extract Tasks20231103.zip.
- Change directory into the extracted files.
- Execute the following commands to upload the tasks:
tfx build tasks upload --task-zip-path AzureFileCopyV1.1.230.0.zip
tfx build tasks upload --task-zip-path AzureFileCopyV2.2.230.0.zip
tfx build tasks upload --task-zip-path AzureFileCopyV3.3.230.0.zip
tfx build tasks upload --task-zip-path AzureFileCopyV4.4.230.0.zip
tfx build tasks upload --task-zip-path AzureFileCopyV5.5.230.0.zip
tfx build tasks upload --task-zip-path BashV3.3.226.2.zip
tfx build tasks upload --task-zip-path BatchScriptV1.1.226.0.zip
tfx build tasks upload --task-zip-path PowerShellV2.2.230.0.zip
tfx build tasks upload --task-zip-path SSHV0.0.226.1.zip
tfx build tasks upload --task-zip-path WindowsMachineFileCopyV1.1.230.0.zip
tfx build tasks upload --task-zip-path WindowsMachineFileCopyV2.2.230.0.zip
Pipeline Requirements
To use the new behavior, a variable AZP_75787_ENABLE_NEW_LOGIC = true must be set in pipelines that use the affected tasks.
On classic:
Define the variable in the variable tab in the pipeline.
YAML example:
variables:
- name: AZP_75787_ENABLE_NEW_LOGIC
  value: true
Azure DevOps Server 2020 Update 0.2 Patch 5 Release Date: October 10, 2023
Important
We released updates to the Azure Pipelines agent with Patch 4 released on September 12, 2023. If you didn't install the agent updates as described in the release notes for Patch 4, we recommend that you install these updates before you install Patch 5. The new version of the agent after installing Patch 4 will be 3.225.0.
We have released a patch for Azure DevOps Server 2020 Update 0.2 that includes fixes for the following.
- Fixed a bug where "Analysis Owner" identity shows as Inactive Identity on patch upgrade machines.
Azure DevOps Server 2020 Update 0.2 Patch 4 Release Date: September 12, 2023
We have released a patch for Azure DevOps Server 2020 Update 0.2 that includes fixes for the following.
- CVE-2023-33136: Azure DevOps Server Remote Code Execution Vulnerability.
- CVE-2023-38155: Azure DevOps Server and Team Foundation Server Elevation of Privilege Vulnerability.
Important
Please deploy the patch to a test environment and ensure that the environment’s pipelines work as expected before applying the fix to production.
Note
To implement fixes for this patch you will have to follow a number of steps to manually update the agent and tasks.
Install patches
- Download and install Azure DevOps Server 2020 Update 0.2 patch 4.
Update the Azure Pipelines agent
- Download the agent from: https://github.com/microsoft/azure-pipelines-agent/releases/tag/v3.225.0 - Agent_20230825.zip
- Use the steps outlined in the self-hosted Windows agents documentation to deploy the agent.
Note
The AZP_AGENT_DOWNGRADE_DISABLED must be set to “true” to prevent the agent from being downgraded. On Windows, the following command can be used in an administrative command prompt, followed by a reboot. setx AZP_AGENT_DOWNGRADE_DISABLED true /M
Configure TFX
- Follow steps in the upload tasks to project collection documentation to install and login with tfx-cli.
Update tasks using TFX
- Download and extract Tasks_20230825.zip.
- Change directory into the extracted files.
- Execute the following commands to upload the tasks:
tfx build tasks upload --task-zip-path AzureFileCopyV1.1.226.3.zip
tfx build tasks upload --task-zip-path AzureFileCopyV2.2.226.2.zip
tfx build tasks upload --task-zip-path AzureFileCopyV3.3.226.2.zip
tfx build tasks upload --task-zip-path AzureFileCopyV4.4.226.2.zip
tfx build tasks upload --task-zip-path AzureFileCopyV5.5.226.2.zip
tfx build tasks upload --task-zip-path BashV3.3.226.2.zip
tfx build tasks upload --task-zip-path BatchScriptV1.1.226.0.zip
tfx build tasks upload --task-zip-path PowerShellV2.2.226.1.zip
tfx build tasks upload --task-zip-path SSHV0.0.226.1.zip
tfx build tasks upload --task-zip-path WindowsMachineFileCopyV1.1.226.2.zip
tfx build tasks upload --task-zip-path WindowsMachineFileCopyV2.2.226.2.zip
Pipeline Requirements
To use the new behavior, a variable AZP_75787_ENABLE_NEW_LOGIC = true must be set in pipelines that use the affected tasks.
On classic:
Define the variable in the variable tab in the pipeline.
YAML example:
variables:
- name: AZP_75787_ENABLE_NEW_LOGIC
  value: true
Azure DevOps Server 2020 Update 0.2 Patch 3 Release Date: August 8, 2023
We have released a patch for Azure DevOps Server 2020 Update 0.2 that includes fixes for the following.
- Fixed a bug that interfered with pushing packages when upgrading from 2018 or earlier.
Azure DevOps Server 2020 Update 0.2 Patch 2 Release Date: June 13, 2023
We have released a patch for Azure DevOps Server 2020 Update 0.2 that includes fixes for the following.
- Fixed a bug that interfered with pushing packages when upgrading from 2018 or earlier.
Azure DevOps Server 2020 Update 0.2 Patch 1 Release Date: October 18, 2022
We have released a patch for Azure DevOps Server 2020 Update 0.2 that includes fixes for the following.
- Resolve issue with newly added AD identities not appearing in security dialog identity pickers.
- Fix an issue with Requested by Member of Group filter in the web hook settings.
- Fix Gated check-in builds error when the Organization settings for pipeline had job authorization scope configured as Limit job authorization scope to current project for non-release pipelines.
Azure DevOps Server 2020.0.2 Release Date: May 17, 2022
Azure DevOps Server 2020.0.2 is a roll up of bug fixes. You can directly install Azure DevOps Server 2020.0.2 or upgrade from Azure DevOps Server 2020 or Team Foundation Server 2013 or newer.
Note
The Data Migration Tool will be available for Azure DevOps Server 2020.0.2 about three weeks after this release. You can see our list of currently supported versions for import here.
This release includes fixes for the following:
Unable to skip build queue using the the "Run next" button. Previously, the "Run next" button was enabled for project collection administrators only.
Revoke all personal access tokens after a user's Active Directory account is disabled.
Azure DevOps Server 2020.0.1 Patch 9 Release Date: January 26, 2022
We have released a patch for Azure DevOps Server 2020.0.1 that includes fixes for the following.
- Email notifications were not sent when using the @mention control in a work item.
- Fix TF400813 error when switching accounts. This error occurred when upgraded from TFS 2018 to Azure DevOps Server 2020.0.1.
- Fix issue with the Project Overview summary page failing to load.
- Improvement to Active Directory user sync.
- Addressed Elasticsearch vulnerability by removing the jndilookup class from log4j binaries.
Installation steps
- Upgrade the server with Patch 9.
- Check the registry value at
HKLM:\Software\Elasticsearch\Version. If the registry value is not there, add a string value and set the Version to 5.4.1 (Name = Version, Value = 5.4.1). - Run the update command
PS C:\Program Files\{TFS Version Folder}\Search\zip> .\Configure-TFSSearch.ps1 -Operation updateas provided in the readme file. It may return a warning like: Unable to connect to the remote server. Don't close the window, as the update is performing retries until it is completed.
Note
If Azure DevOps Server and Elasticsearch are installed on different machines, follow the steps outlined below.
- Upgrade the server with Patch 9..
- Check the registry value at
HKLM:\Software\Elasticsearch\Version. If the registry value is not there, add a string value and set the Version to 5.4.1 (Name = Version, Value = 5.4.1). - Copy the content of the folder named zip, located on
C:\Program Files\{TFS Version Folder}\Search\zipto the Elasticsearch remote file folder. - Run
Configure-TFSSearch.ps1 -Operation updateon the Elasticsearch server machine.
SHA-256 Hash: B0C05A972C73F253154AEEB7605605EF2E596A96A3720AE942D7A9DDD881545E
Azure DevOps Server 2020.0.1 Patch 8 Release Date: December 15, 2021
Patch 8 for Azure DevOps Server 2020.0.1 includes fixes for the following.
- Localization issue for custom work items layout states.
- Localization issue in email notification template.
- Issue with console logs getting truncated when there are multiple identical links in a row.
- Issue with NOTSAMEAS rules evaluation when multiple NOTSAMEAS rules were defined for a field.
Azure DevOps Server 2020.0.1 Patch 7 Release Date: October 26, 2021
Patch 7 for Azure DevOps Server 2020.0.1 includes fixes for the following.
- Previously, Azure DevOps Server could only create connections to GitHub Enterprise Server. With this patch, project administrators can create connections between Azure DevOps Server and repositories on GitHub.com. You can find this setting in the GitHub connections page under Project Settings.
- Resolve issue with Test Plan widget. The test execution report was showing an incorrect user on results.
- Fix issue with the Project Overview summary page failing to load.
- Fix issue with emails not being sent to confirm product upgrade.
Azure DevOps Server 2020.0.1 Patch 6 Release Date: September 14, 2021
Patch 6 for Azure DevOps Server 2020.0.1 includes fixes for the following.
- Fix Artifacts download/upload failure.
- Resolve issue with inconsistent Test Results data.
Azure DevOps Server 2020.0.1 Patch 5 Release Date: August 10, 2021
Patch 5 for Azure DevOps Server 2020.0.1 includes fixes for the following.
- Fix build definition UI error.
- Changed browsing history to display files instead of the root repository.
- Fix issue with email delivery jobs for some work item types.
Azure DevOps Server 2020.0.1 Patch 4 Release Date: June 15, 2021
Patch 4 for Azure DevOps Server 2020.0.1 includes fixes for the following.
- Fix issue with data import. Data import was taking a long time for customers that have lots of stale test cases. This was due to references which increased the size of the
tbl_testCaseReferencestable. With this patch, we removed references to stale test cases to help speed the data import process.
Azure DevOps Server 2020.0.1 Patch 3 Release Date: May 11, 2021
We have released a patch for Azure DevOps Server 2020.0.1 that fixes the following.
- Inconsistent Test Results data when using Microsoft.TeamFoundation.TestManagement.Client.
If you have Azure DevOps Server 2020.0.1, you should install Azure DevOps Server 2020.0.1 Patch 3.
Verifying Installation
Option 1: Run
devops2020.0.1patch3.exe CheckInstall, devops2020.0.1patch3.exe is the file that is downloaded from the link above. The output of the command will either say that the patch has been installed, or that is not installed.Option 2: Check the version of the following file:
[INSTALL_DIR]\Azure DevOps Server 2020\Application Tier\bin\Microsoft.Teamfoundation.Framework.Server.dll. Azure DevOps Server 2020.0.1 is installed toc:\Program Files\Azure DevOps Server 2020by default. After installing Azure DevOps Server 2020.0.1 Patch 3, the version will be 18.170.31228.1.
Azure DevOps Server 2020.0.1 Patch 2 Release Date: April 13, 2021
Note
If you have Azure DevOps Server 2020, you should first update to Azure DevOps Server 2020.0.1 . Once on 2020.0.1, install Azure DevOps Server 2020.0.1 Patch 2
We have released a patch for Azure DevOps Server 2020.0.1 that fixes the following.
- CVE-2021-27067: Information disclosure
- CVE-2021-28459: Elevation of privilege
To implement fixes for this patch you will have to follow the steps listed below for general patch installation, AzureResourceGroupDeploymentV2 and AzureResourceManagerTemplateDeploymentV3 task installations.
General patch installation
If you have Azure DevOps Server 2020.0.1, you should install Azure DevOps Server 2020.0.1 Patch 2.
Verifying Installation
Option 1: Run
devops2020.0.1patch2.exe CheckInstall, devops2020.0.1patch2.exe is the file that is downloaded from the link above. The output of the command will either say that the patch has been installed, or that is not installed.Option 2: Check the version of the following file:
[INSTALL_DIR]\Azure DevOps Server 2020\Application Tier\bin\Microsoft.Teamfoundation.Framework.Server.dll. Azure DevOps Server 2020.0.1 is installed toc:\Program Files\Azure DevOps Server 2020by default. After installing Azure DevOps Server 2020.0.1 Patch 2, the version will be 18.170.31123.3.
AzureResourceGroupDeploymentV2 task installation
Note
All the steps mentioned below need to be performed on a Windows machine
Install
Extract the AzureResourceGroupDeploymentV2.zip package to a new folder on your computer. For example: D:\tasks\AzureResourceGroupDeploymentV2.
Download and install Node.js 14.15.1 and npm (included with the Node.js download) according to your machine.
Open a command prompt in administrator mode and run the following command to install tfx-cli.
npm install -g tfx-cli
Create a personal access token with Full access privileges and copy it. This Personal access token will be used when running the tfx login command.
Run the following from the command prompt. When prompted, enter the Service URL and Personal access token.
~$ tfx login
Copyright Microsoft Corporation

> Service URL: {url}
> Personal access token: xxxxxxxxxxxx
Logged in successfully
- Run the following command to upload the task on the server. Use the path of the extracted .zip file from step 1.
~$ tfx build tasks upload --task-path *<Path of the extracted package>*
AzureResourceManagerTemplateDeploymentV3 task installation
Note
All the steps mentioned below need to be performed on a Windows machine
Install
Extract the AzureResourceManagerTemplateDeploymentV3.zip package to a new folder on your computer. For example:D:\tasks\AzureResourceManagerTemplateDeploymentV3.
Download and install Node.js 14.15.1 and npm (included with the Node.js download) as appropriate for your machine.
Open a command prompt in administrator mode and run the following command to install tfx-cli.
npm install -g tfx-cli
Create a personal access token with Full access privileges and copy it. This Personal access token will be used when running the tfx login command.
Run the following from the command prompt. When prompted, enter the Service URL and Personal access token.
~$ tfx login
Copyright Microsoft Corporation

> Service URL: {url}
> Personal access token: xxxxxxxxxxxx
Logged in successfully
- Run the following command to upload the task on the server. Use the path of the extracted .zip file from step 1.
~$ tfx build tasks upload --task-path *<Path of the extracted package>*
Azure DevOps Server 2020.0.1 Patch 1 Release Date: February 9, 2021
We have released a patch for Azure DevOps Server 2020.0.1 that fixes the following. Please see the blog post for more information.
- Resolve the issue reported in this Developer Community feedback ticket| New Test Case button not working
- Include fixes released with Azure DevOps Server 2020 Patch 2.
Azure DevOps Server 2020 Patch 3 Release Date: February 9, 2021
We have released a patch for Azure DevOps Server 2020 that fixes the following. Please see the blog post for more information.
- Resolve the issue reported in this Developer Community feedback ticket| New Test Case button not working
Azure DevOps Server 2020.0.1 Release Date: January 19, 2021
Azure DevOps Server 2020.0.1 is a roll up of bug fixes. You can directly install Azure DevOps Server 2020.0.1 or upgrade from an existing installation. Supported versions for upgrade are Azure DevOps Server 2020, Azure DevOps Server 2019, and Team Foundation Server 2012 or newer.
This release includes fixes for the following bugs:
- Resolve an upgrade problem from Azure DevOps Server 2019 where Git proxy may stop working after upgrade.
- Fix System.OutOfMemoryException exception for non-ENU collections prior to Team Foundation Server 2017 when upgrading to Azure DevOps Server 2020. Resolves the issue reported in this Developer Community feedback ticket.
- Servicing failure caused by missing Microsoft.Azure.DevOps.ServiceEndpoints.Sdk.Server.Extensions.dll. Resolves the issue reported in this Developer Community feedback ticket.
- Fix invalid column name error in Analytics while upgrading to Azure DevOps Server 2020. Resolves the issue reported in this Developer Community feedback ticket.
- Stored XSS when displaying test case steps in test case results.
- Upgrade step failure while migrating points results data to TCM.
Azure DevOps Server 2020 Patch 2 Release Date: January 12, 2021
We have released a patch for Azure DevOps Server 2020 that fixes the following. Please see the blog post for more information.
- Test run details do not display test step details for test data migrated using OpsHub Migration
- Exception on initializer for 'Microsoft.TeamFoundation.TestManagement.Server.TCMLogger'
- Unretained builds are immediately deleted after migration to Azure DevOps Server 2020
- Fix data provider exception
Azure DevOps Server 2020 Patch 1 Date: December 8, 2020
We have released a patch for Azure DevOps Server 2020 that fixes the following. Please see the blog post for more information.
- CVE-2020-17145: Azure DevOps Server and Team Foundation Services Spoofing Vulnerability
Azure DevOps Server 2020 Release Date: October 6, 2020
Azure DevOps Server 2020 is a roll up of bug fixes. It includes all features in the Azure DevOps Server 2020 RC2 previously released.
Note
Azure DevOps 2020 Server has an issue with installing one of the assemblies used by the Git Virtual File System (GVFS).
If you are upgrading from Azure DevOps 2019 (any release) or an Azure DevOps 2020 release candidate and installing to the same directory as the previous release, the assembly Microsoft.TeamFoundation.Git.dll will not be installed. You can verify that you have hit the issue by looking for Microsoft.TeamFoundation.Git.dll in <Install Dir>\Version Control Proxy\Web Services\bin, <Install Dir>\Application Tier\TFSJobAgent and <Install Dir>\Tools folders. If the file is missing, you can run a repair to restore the missing files.
To run a repair, go to Settings -> Apps & Features on the Azure DevOps Server machine/VM and run a repair on Azure DevOps 2020 Server. Once the repair has completed, you can restart the machine/VM.
Azure DevOps Server 2020 RC2 Release Date: August 11, 2020
Azure DevOps Server 2020 RC2 is a roll up of bug fixes. It includes all features in the Azure DevOps Server 2020 RC1 previously released.
Azure DevOps Server 2020 RC1 re-release Release Date: July 10, 2020
We have re-releasing Azure DevOps Server 2020 RC1 to fix this Developer Community feedback ticket.
Previously, after upgrading from Azure DevOps Server 2019 Update 1.1 to Azure DevOps Server 2020 RC1, you were not able to view files in the Repos, Pipelines and Wiki of the Web UI. There was an error message indicating an unexpected error has occurred within this region of the page. You can try reloading this component or refreshing the entire page. With this release we have fixed this issue. Please see the blog post for more information.
Azure DevOps Server 2020 RC1 Release Date: June 30, 2020
Summary of What's New in Azure DevOps Server 2020
Azure DevOps Server 2020 introduces many new features. Some of the highlights include:
- Multi-stage pipelines
- Continuous deployment in YAML
- Track the progress of parent items using Rollup on Boards backlog
- Add "Parent Work Item" filter to the task board and sprint backlog
- New Web UI for Azure Repos landing pages
- Cross-repo branch policy administration
- New Test Plan page
- Rich editing for code wiki pages
- Pipeline failure and duration reports
You can also jump to individual sections to see all the new features for each service:
General
Azure DevOps CLI general availability
In February, we introduced the Azure DevOps extension for Azure CLI. The extension lets you interact with Azure DevOps from the command line. We've collected your feedback that helped us improve the extension and add more commands. We are now happy to announce that the extension is generally available.
To learn more about Azure DevOps CLI, see the documentation here.
Use publish profile to deploy Azure WebApps for Windows from the Deployment Center
Now you can use publish profile-based authentication to deploy your Azure WebApps for Windows from the Deployment Center. If you have permission to deploy to an Azure WebApp for Windows using its publish profile, you will be able to setup the pipeline using this profile in the Deployment Center workflows.
Boards
Add "Parent Work Item" filter to the task board and sprint backlog
We added a new filter to both the Sprint board and the Sprint backlog. This allows you to filter requirements level backlog items (first column on the left) by their parent. For example, in the screen shot below, we have filtered the view to only show user stories where the parent is "My big feature".

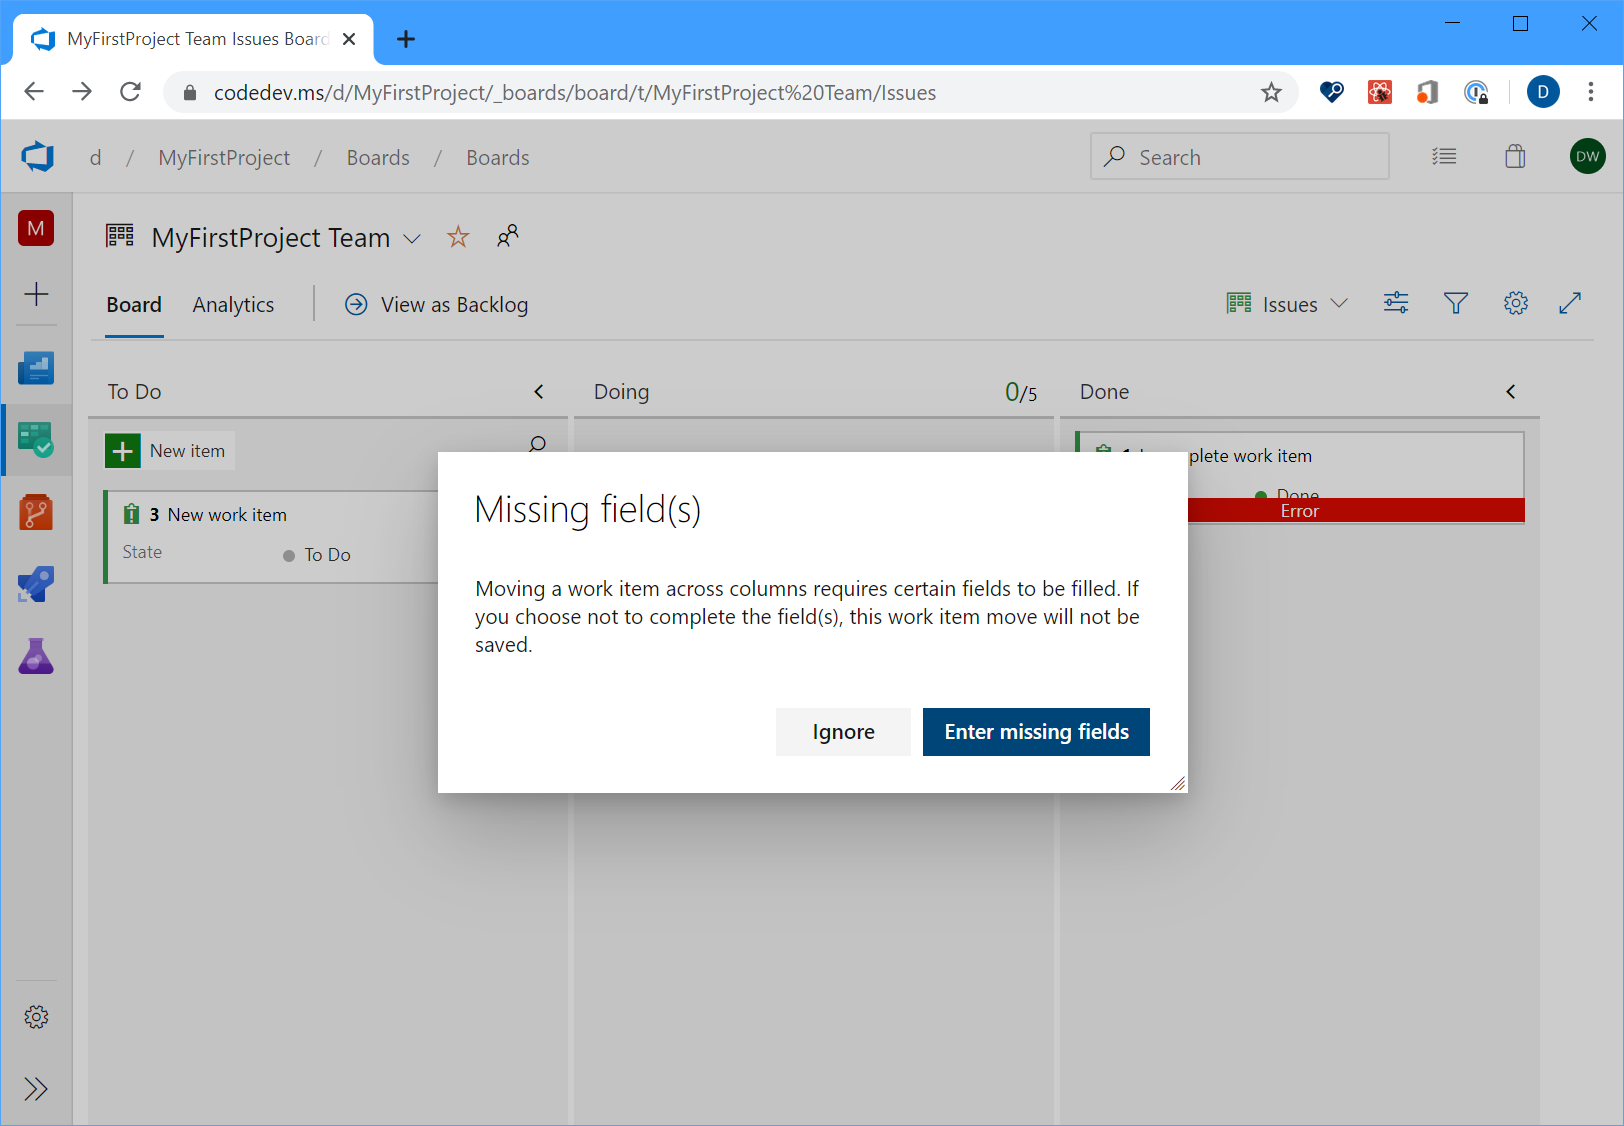
Improve error handling experience –– required fields on Bug/Task
Historically, from the Kanban board, if you moved a work item from one column to another where the state change triggered field rules, the card would just show a red error message which will force you to open up the work item to understand the root cause. In sprint 170, we improved the experience so you can now click on the red error message to see the details of the error without having to open up the work item itself.
Work item live reload
Previously, when updating a work item, and a second team member was making changes to the same work item, the second user would lose their changes. Now, as long as you are both editing different fields, you will see live updates of the changes made to the work item.

Manage iteration and area paths from the command line
You can now manage iteration and area paths from the command line by using the az boards iteration and az boards area commands. For example, you can setup and manage iteration and area paths interactively from the CLI, or automate the entire setup using a script. For more details about the commands and the syntax, see the documentation here.
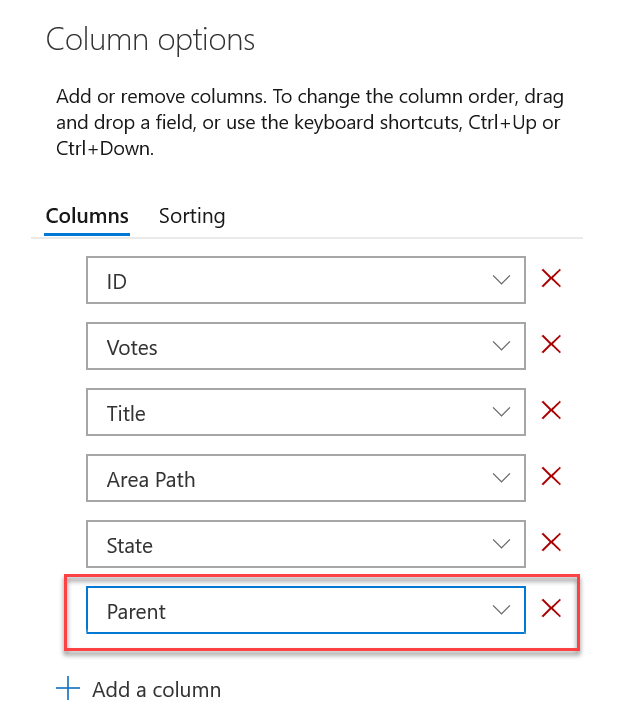
Work item parent column as column option
You now have the option to see the parent of every work item in your product backlog or sprint backlog. To enable this feature, go to Column Options on the desired backlog, then add the Parent column.

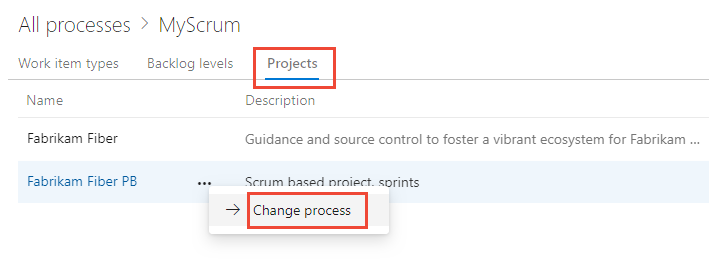
Change the process used by a project
Your tools should change as your team does, you can now switch your projects from any out-of-the-box process template to any other out-of-the-box process. For example, you can change your project from using Agile to Scrum, or Basic to Agile. You can find full step-by-step documentation here.
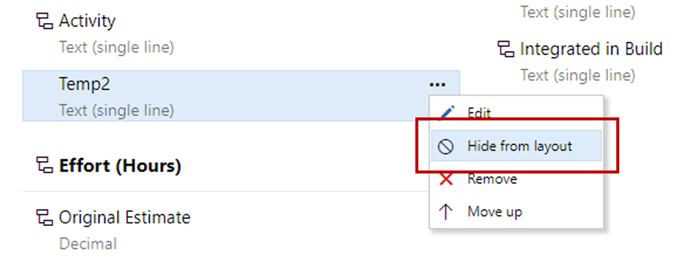
Hide custom fields from layout
You can now hide custom fields from the form layout when customizing your process. The field will still be available from queries and REST APIs. This comes in handy for tracking extra fields when you are integrating with other systems.
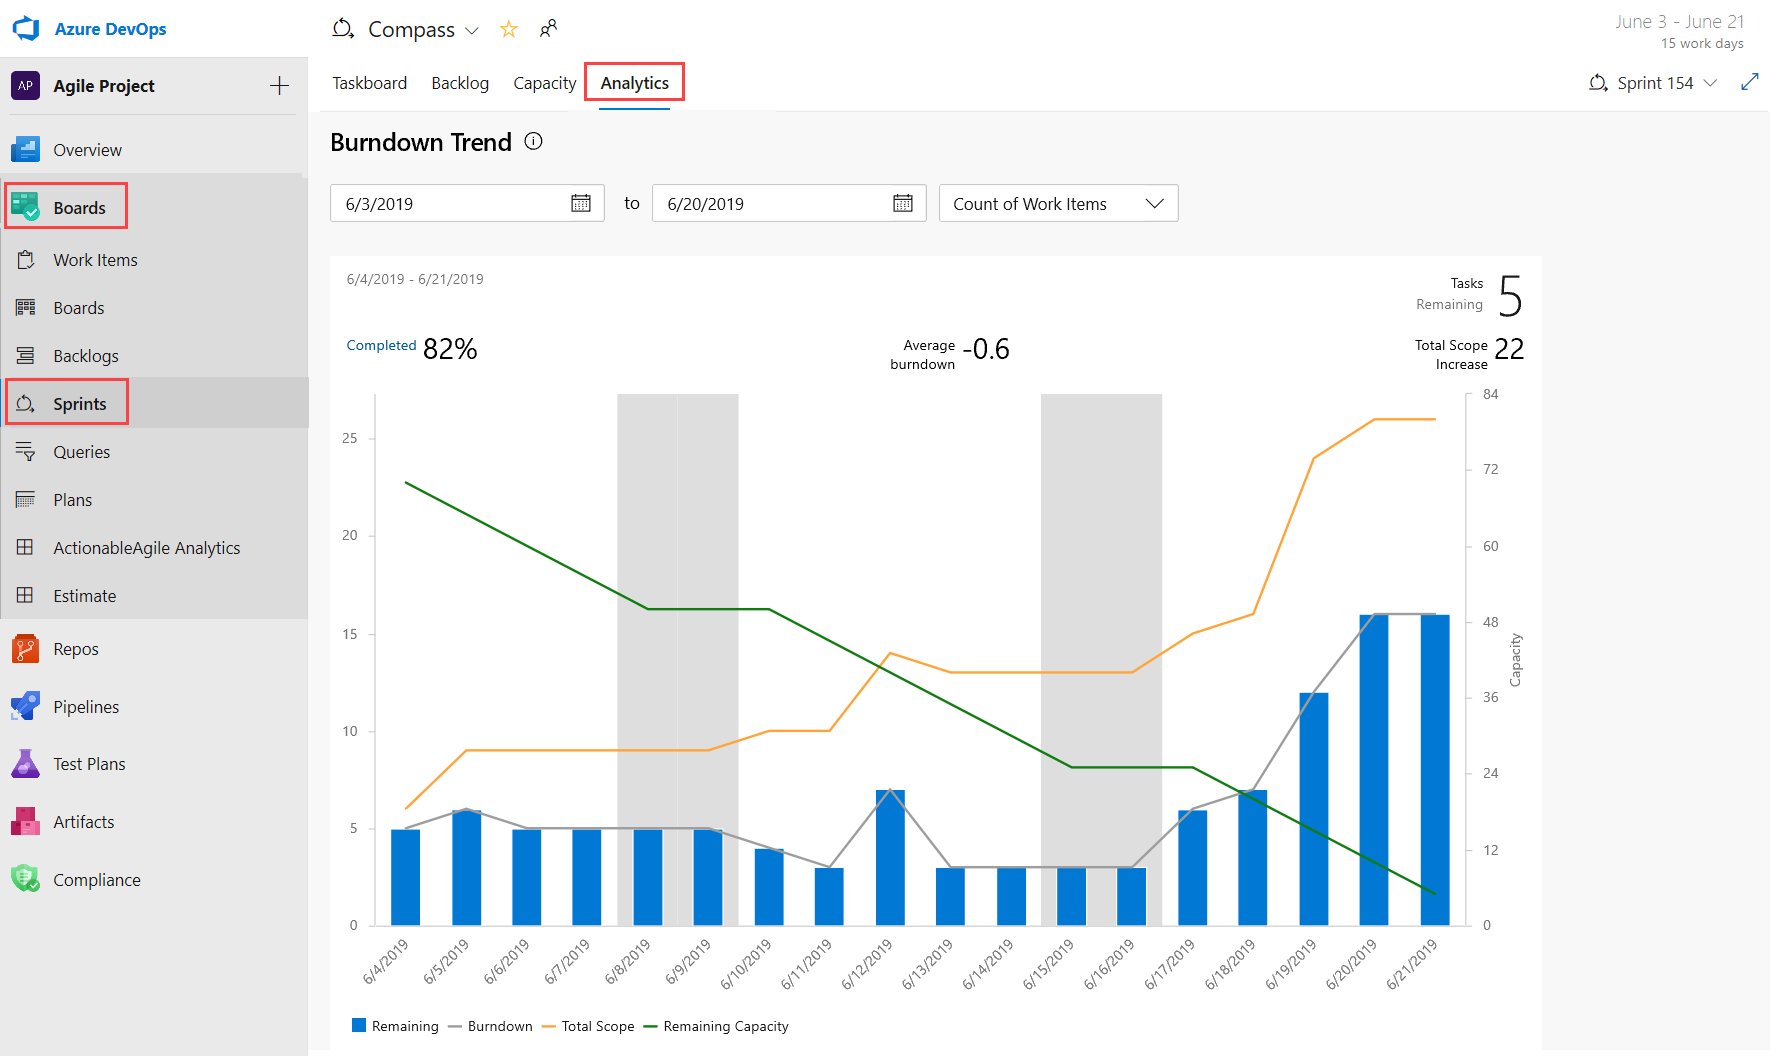
Get insights into your team’s health with three new Azure Boards reports
You can’t fix what you can’t see. Therefore, you want to keep a close eye on the state and health of their work processes. With these reports, we are making it easier for you to track important metrics with minimal effort in Azure Boards.
The three new interactive reports are: Burndown, Cumulative Flow Diagram (CFD) and Velocity. You can see the reports in the new analytics tab.
Metrics like sprint burndown, flow of work and team velocity give you the visibility into your team's progress and help answer questions such as:
- How much work do we have left in this sprint? Are we on track to complete it?
- What step of the development process is taking the longest? Can we do something about it?
- Based on previous iterations, how much work should we plan for next the sprint?
Note
The charts previously shown in the headers have been replaced with these enhanced reports.
The new reports are fully interactive and allow you to adjust them for your needs. You can find the new reports under the Analytics tab in each hub.
The burndown chart can be found under the Sprints hub.
The CFD and Velocity reports can be accessed from the Analytics tab under Boards and Backlogs by clicking on the relevant card.
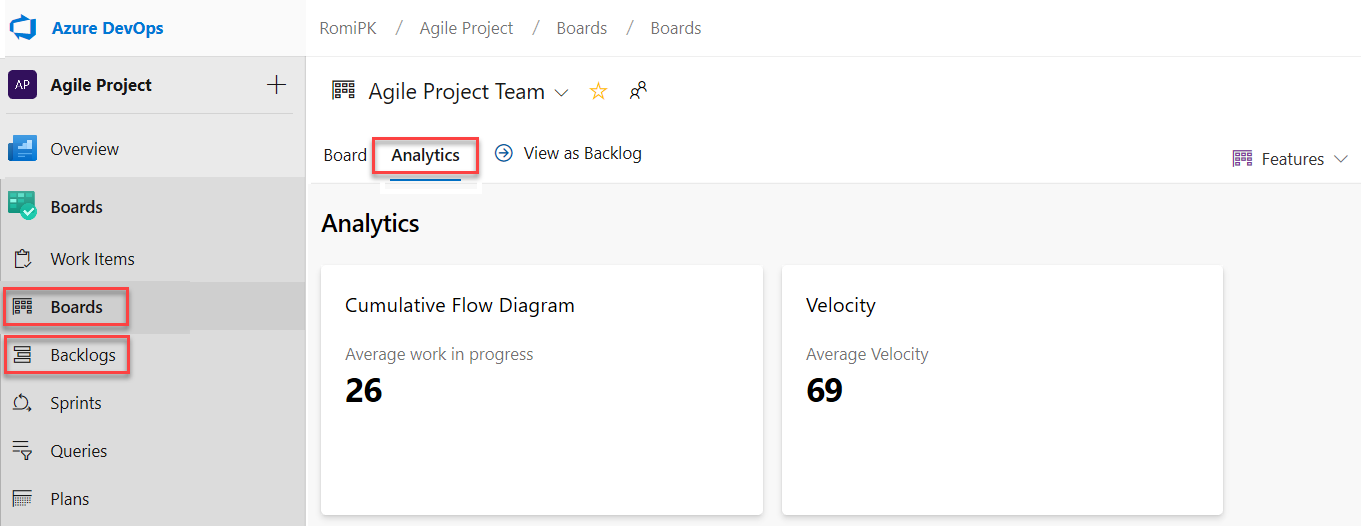
With the new reports you have more control and information about your team. Here are some examples:
- The Sprint Burndown and the Velocity reports can be set to use count of work items or sum of remaining work.
- You can adjust the timeframe of the sprint burndown without affecting the project dates. So, if your team usually spends the first day of each sprint planning, you can now match the chart to reflect that.
- The Burndown chart now has a watermark showing weekends.
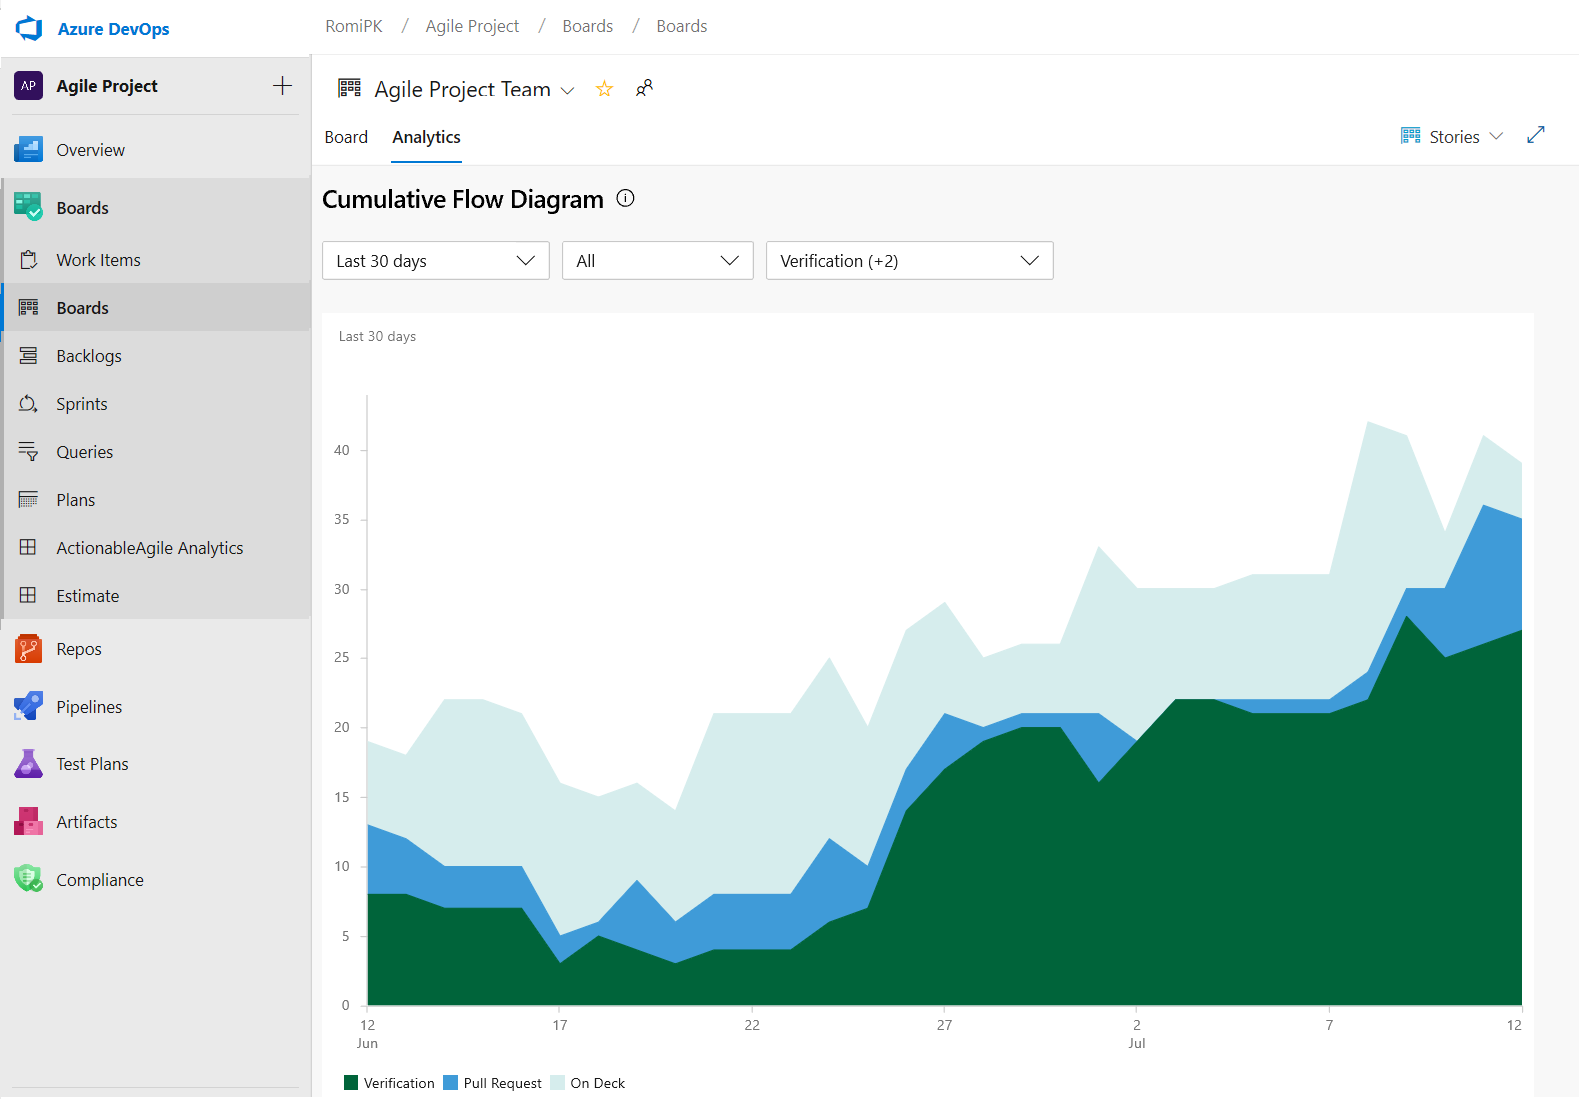
- The CFD report lets you remove board columns like Design to gain more focus on the flow the teams have control on.
Here is an example of the CFD report showing the flow for the last 30 days of the Stories backlog.
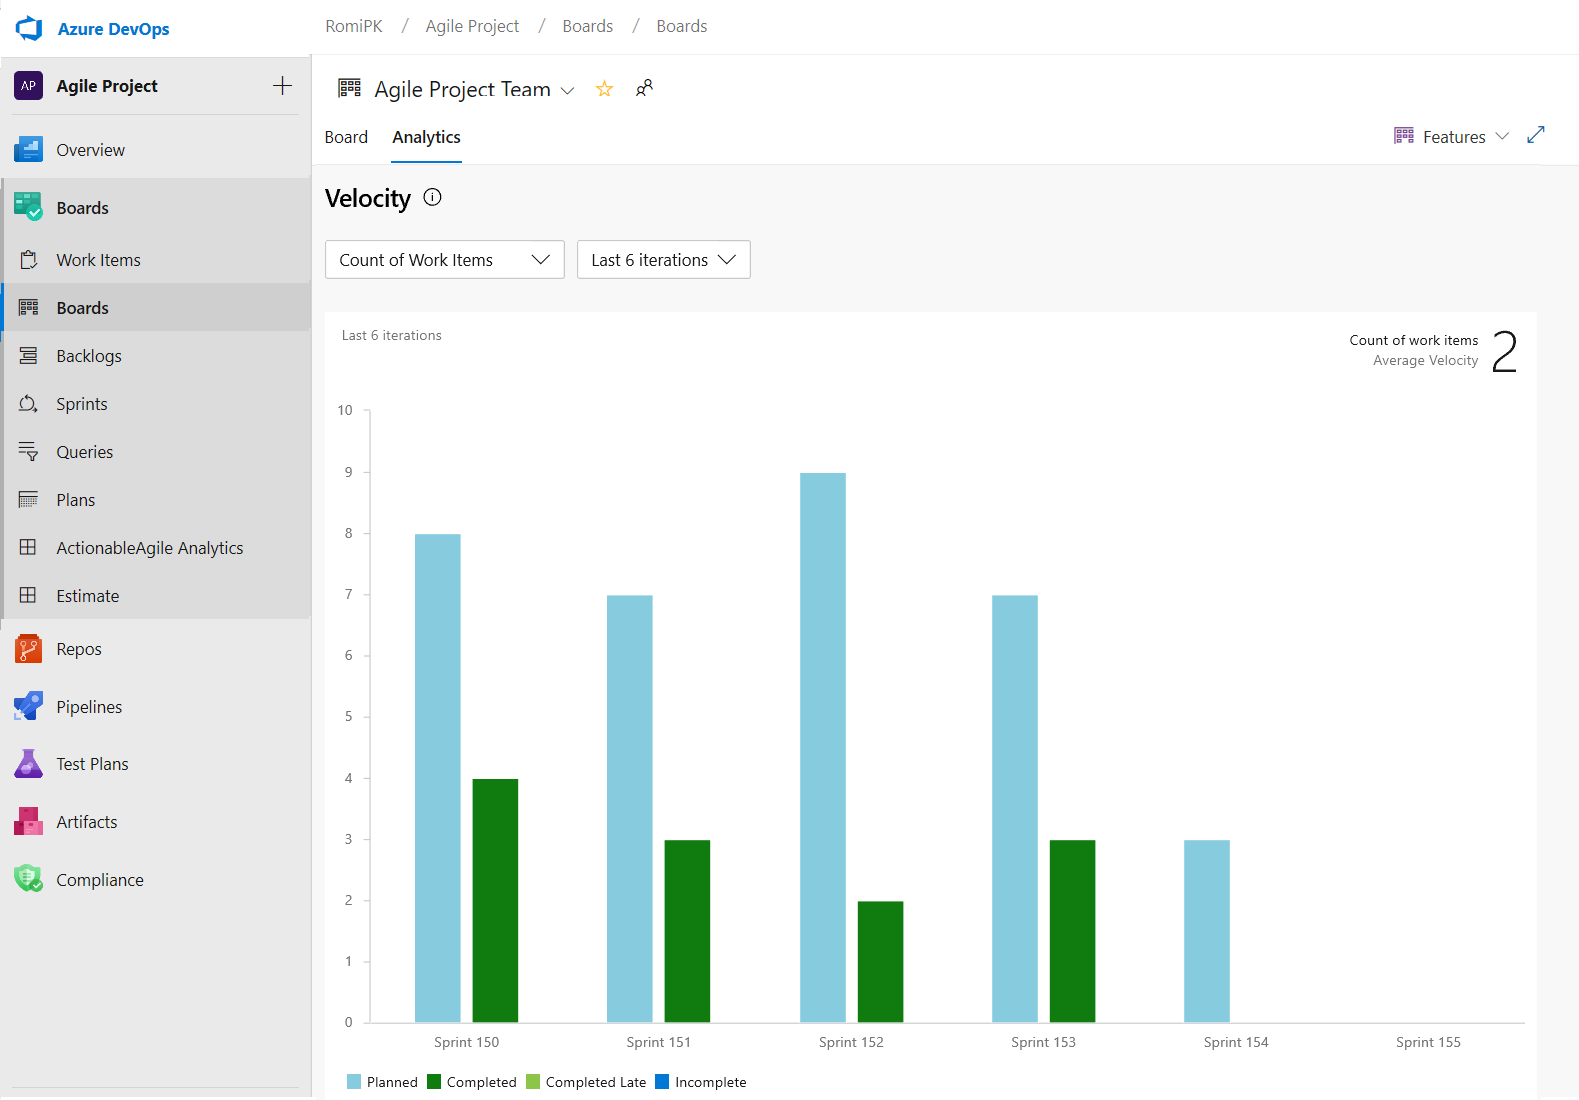
The Velocity chart can now be tracked for all backlog levels. For example, you can now add both Features and Epics whereas before the previous chart supported only Requirements. Here is an example of a velocity report for the last 6 iterations of the Features backlog.
Customize Taskboard columns
We're excited to announce that we added an option to let you customize the columns on the Taskboard. You can now add, remove, rename, and reorder the columns.
To configure the columns on your Taskboard, go to Column Options.

This feature was prioritized based on a suggestion from the Developer Community.
Toggle to show or hide completed child work items on the backlog
Many times, when refining the backlog, you only want to see items that have not been completed. Now, you have the ability to show or hide completed child items on the backlog.
If the toggle is on, you will see all child items in a completed state. When the toggle is off, all child items in a completed state will be hidden from the backlog.

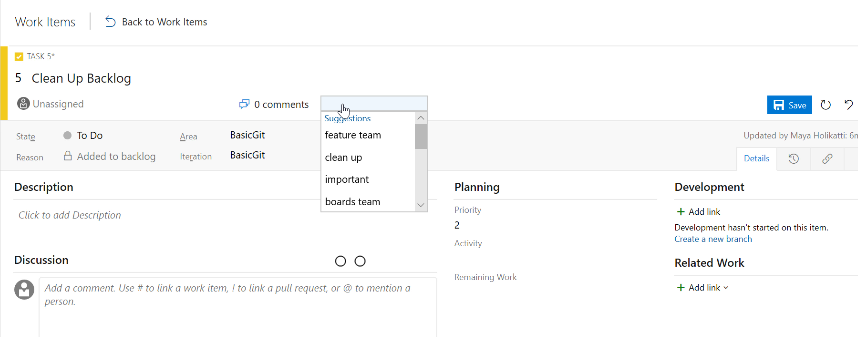
Most recent tags displayed when tagging a work item
When tagging a work item, the auto-complete option will now display up to five of your most recently used tags. This will make it easier to add the right information to your work items.
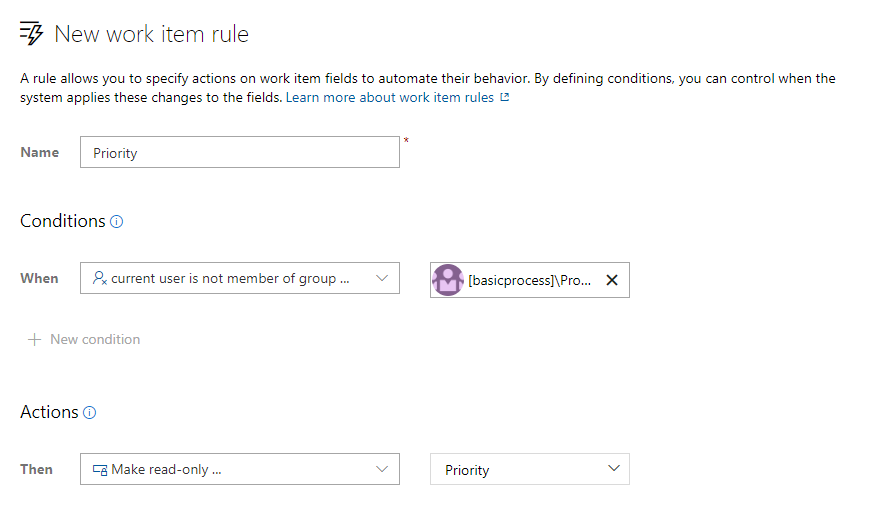
Read-only and required rules for group membership
Work item rules let you set specific actions on work item fields to automate their behavior. You can create a rule to set a field to read-only or required based on group membership. For example, you may want to grant product owners the ability to set the priority of your features while making it read-only for everyone else.
Customize system picklist values
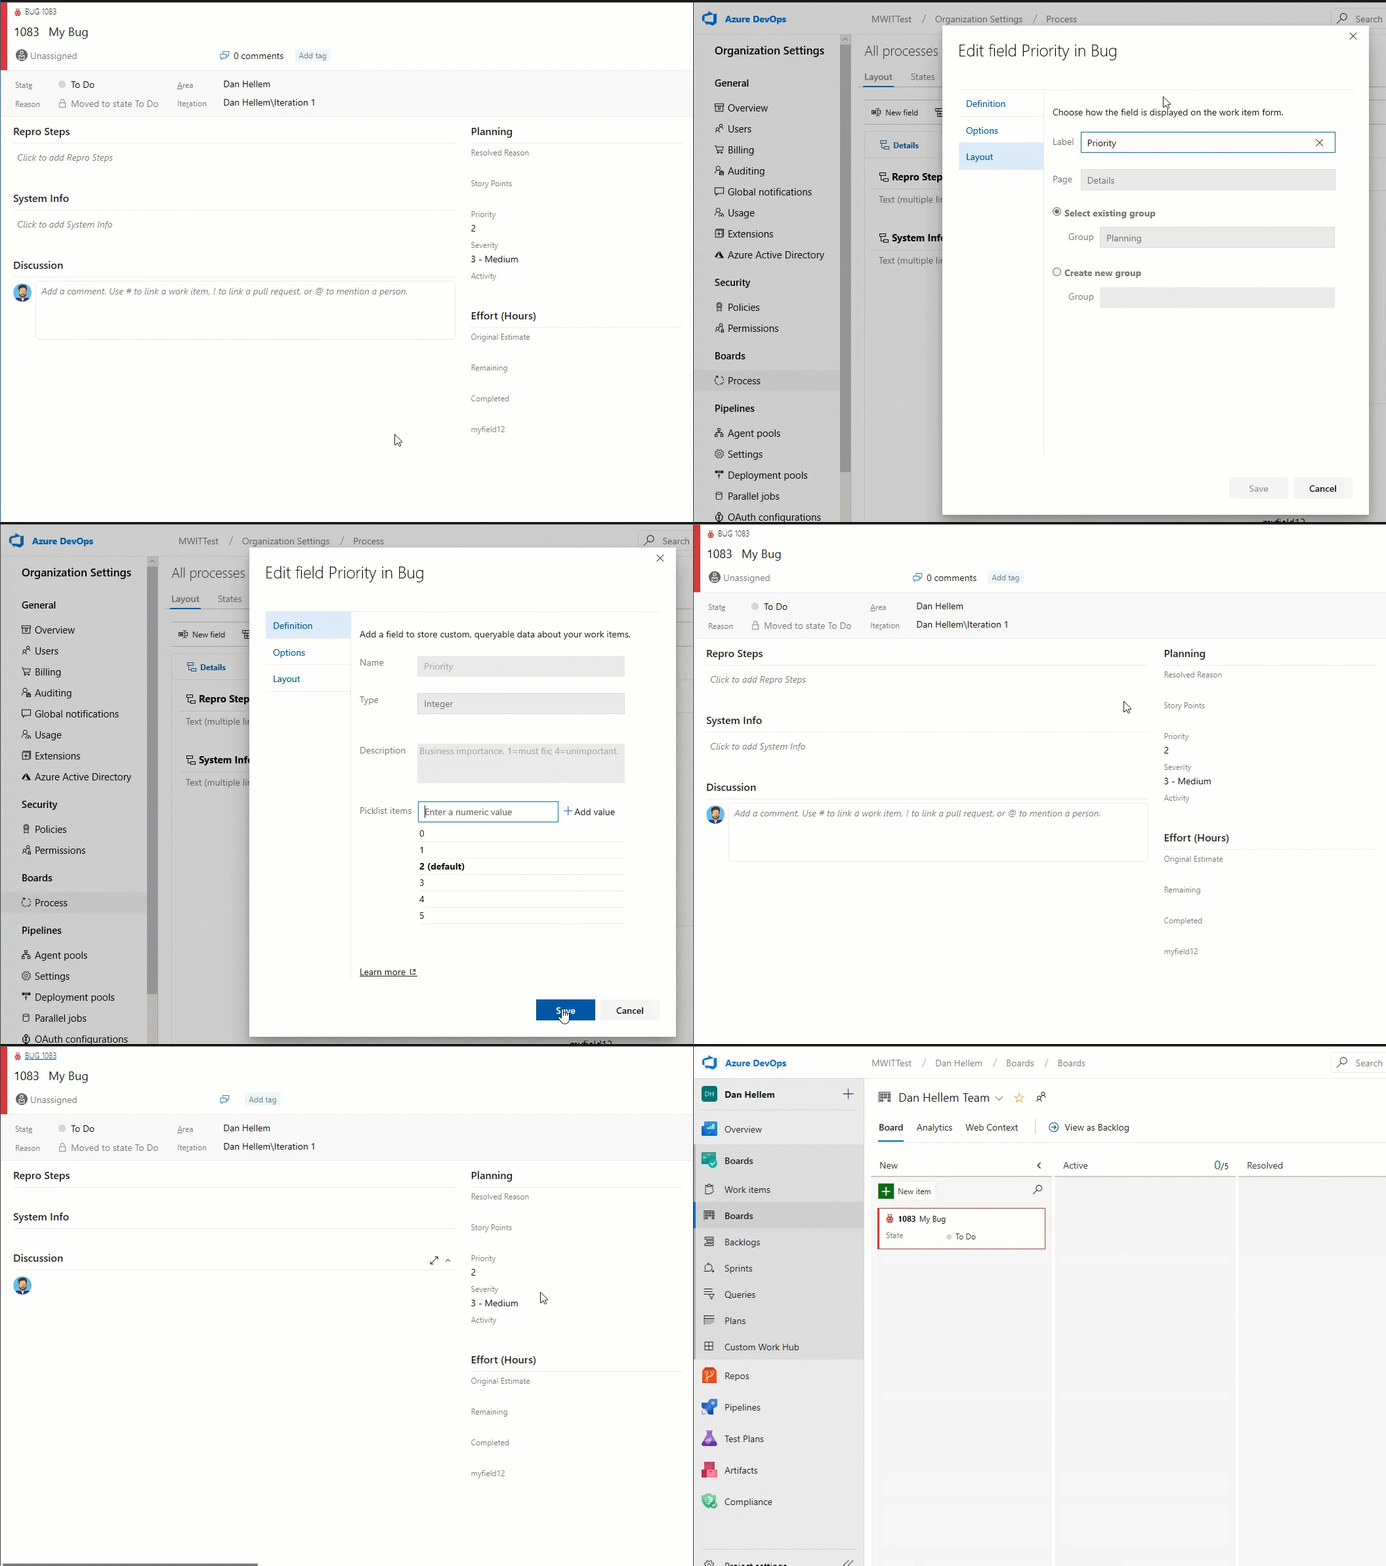
You can now customize the values for any system picklist (except the reason field) such as Severity, Activity, Priority, etc. The picklist customizations are scoped so that you can manage different values for the same field for each work item type.
New work item URL parameter
Share links to work items with the context of your board or backlog with our new work item URL parameter. You can now open a work item dialog on your board, backlog, or sprint experience by appending the parameter ?workitem=[ID] to the URL.
Anyone you share the link with will then land with the same context you had when you shared the link!
Mention people, work items and PRs in text fields
As we listened to your feedback, we heard that you wanted the ability to mention people, work items, and PRs in the work item description area (and other HTML fields) on the work item and not just in comments. Sometimes you are collaborating with someone on a work item, or want to highlight a PR in your work item description, but didn't have a way to add that information. Now you can mention people, work items, and PRs in all long text fields on the work item.
You can see an example here.
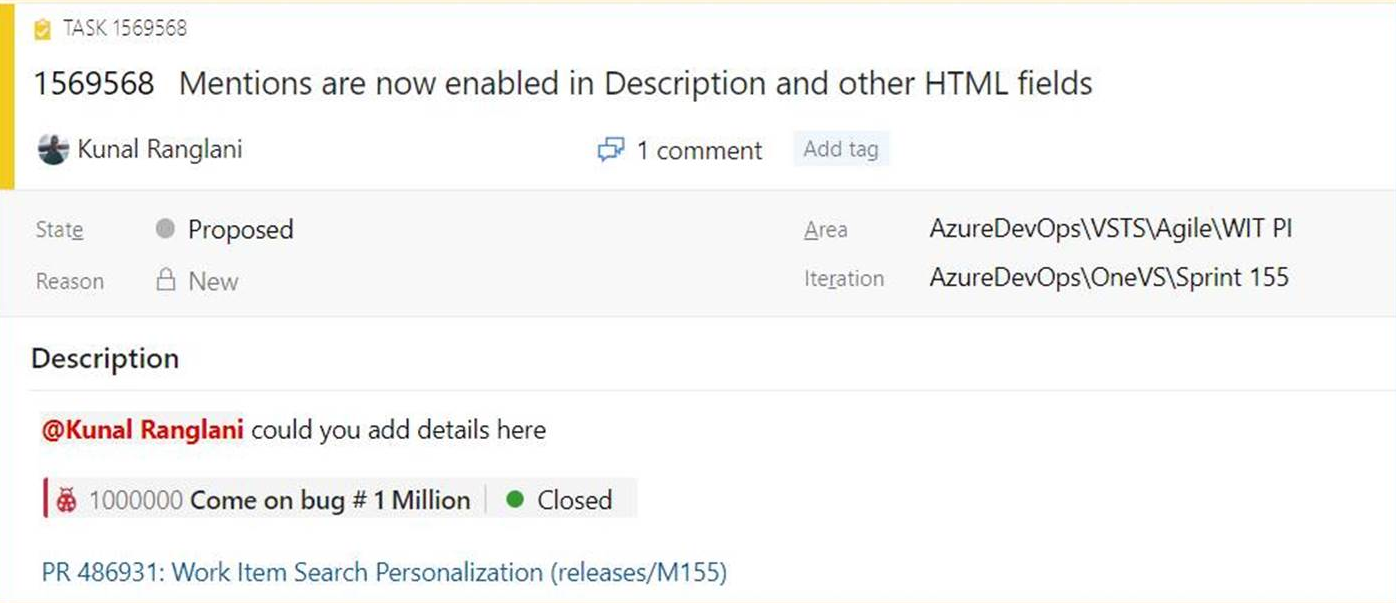
- To use people mentions, type the @ sign and the person's name you want to mention. @mentions in work item fields will generate email notifications like what it does for comments.
- To use work item mentions, type the # sign followed by the work item ID or title. #mentions will create a link between the two work items.
- To use PR mentions, add a ! followed by your PR ID or name.
Reactions on discussion comments
One of our main goals is to make the work items more collaborative for teams. Recently we conducted a poll on Twitter to find out what collaboration features you want in discussions on the work item. Bringing reactions to comments won the poll, so we add them! Here are the results of the Twitter poll.
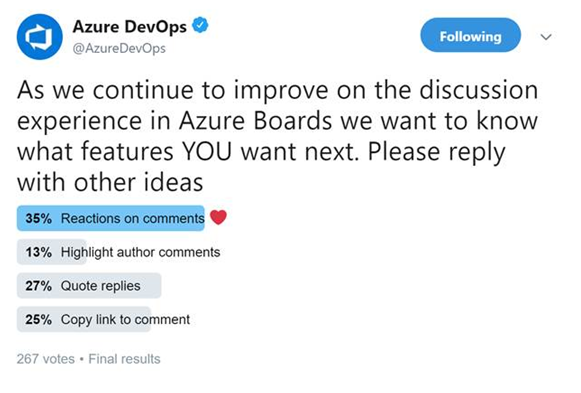
You can add reactions to any comment, and there are two ways to add your reactions – the smiley icon at the top right corner of any comment, as well as at the bottom of a comment next to any existing reactions. You can add all six reactions if you like, or just one or two. To remove your reaction, click on the reaction on the bottom of your comment and it will be removed. Below you can see the experience of adding a reaction, as well as what the reactions look like on a comment.

Pin Azure Boards reports to the dashboard
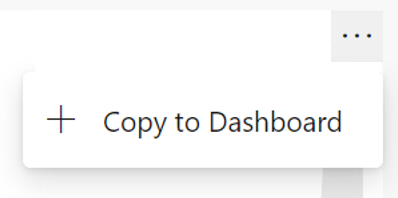
In the Sprint 155 Update, we included updated versions of the CFD and Velocity reports. These reports are available under the Analytics tab of Boards and Backlogs. Now you can pin the reports directly to your Dashboard. To pin the reports, hover over the report, select the ellipsis "..." menu, and Copy to Dashboard.
Track the progress of parent items using Rollup on Boards backlog
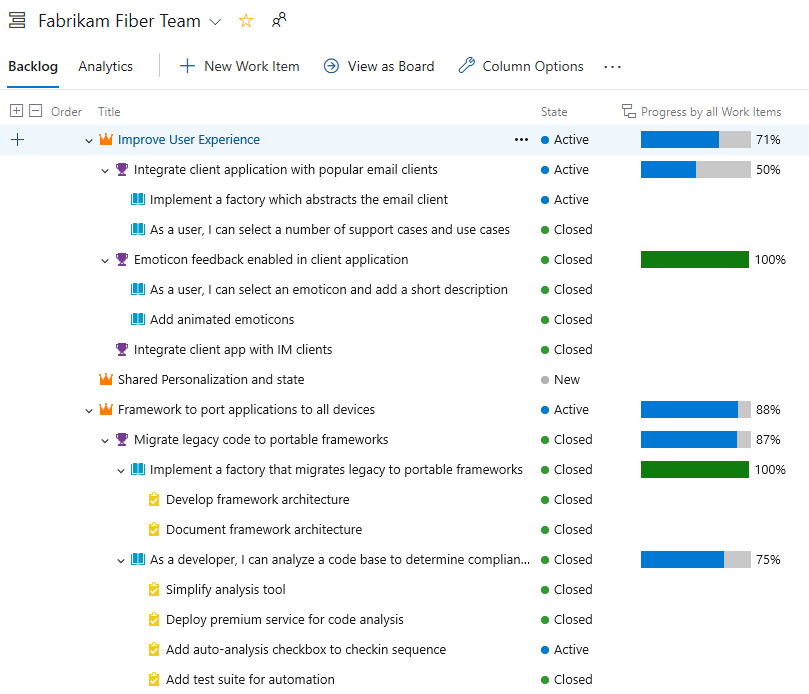
Rollup columns show progress bars and/or totals of numeric fields or descendant items within a hierarchy. Descendant items correspond to all child items within the hierarchy. One or more rollup columns can be added to a product or portfolio backlog.
For example, here we show Progress by Work Items which displays progress bars for ascendant work items based on the percentage of descendant items that have been closed. Descendant items for Epics includes all child Features and their child or grand child work items. Descendant items for Features includes all child User Stories and their child work items.
Taskboard live updates
Your taskboard now automatically refreshes when changes occur! As other team members move or reorder cards on the taskboard, your board will automatically update with these changes. You no longer have to press F5 to see the latest changes.
Support for custom fields in Rollup columns
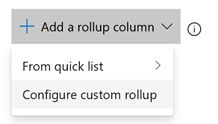
Rollup can now be done on any field, including custom fields. When adding a Rollup column, you can still pick a Rollup column from the Quick list, however if you want to rollup on numeric fields that are not part of the out of the box process template, you can configure your own as follows:
- On your backlog click "Column options". Then in the panel click "Add Rollup column" and Configure custom rollup.
- Pick between Progress Bar and Total.
- Select a work item type or a Backlog level (usually backlogs aggregate several work item types).
- Select the aggregation type. Count of work items or Sum. For Sum you'll need to select the field to summarize.
- The OK button will bring you back to the column options panel where you can reorder your new custom column.
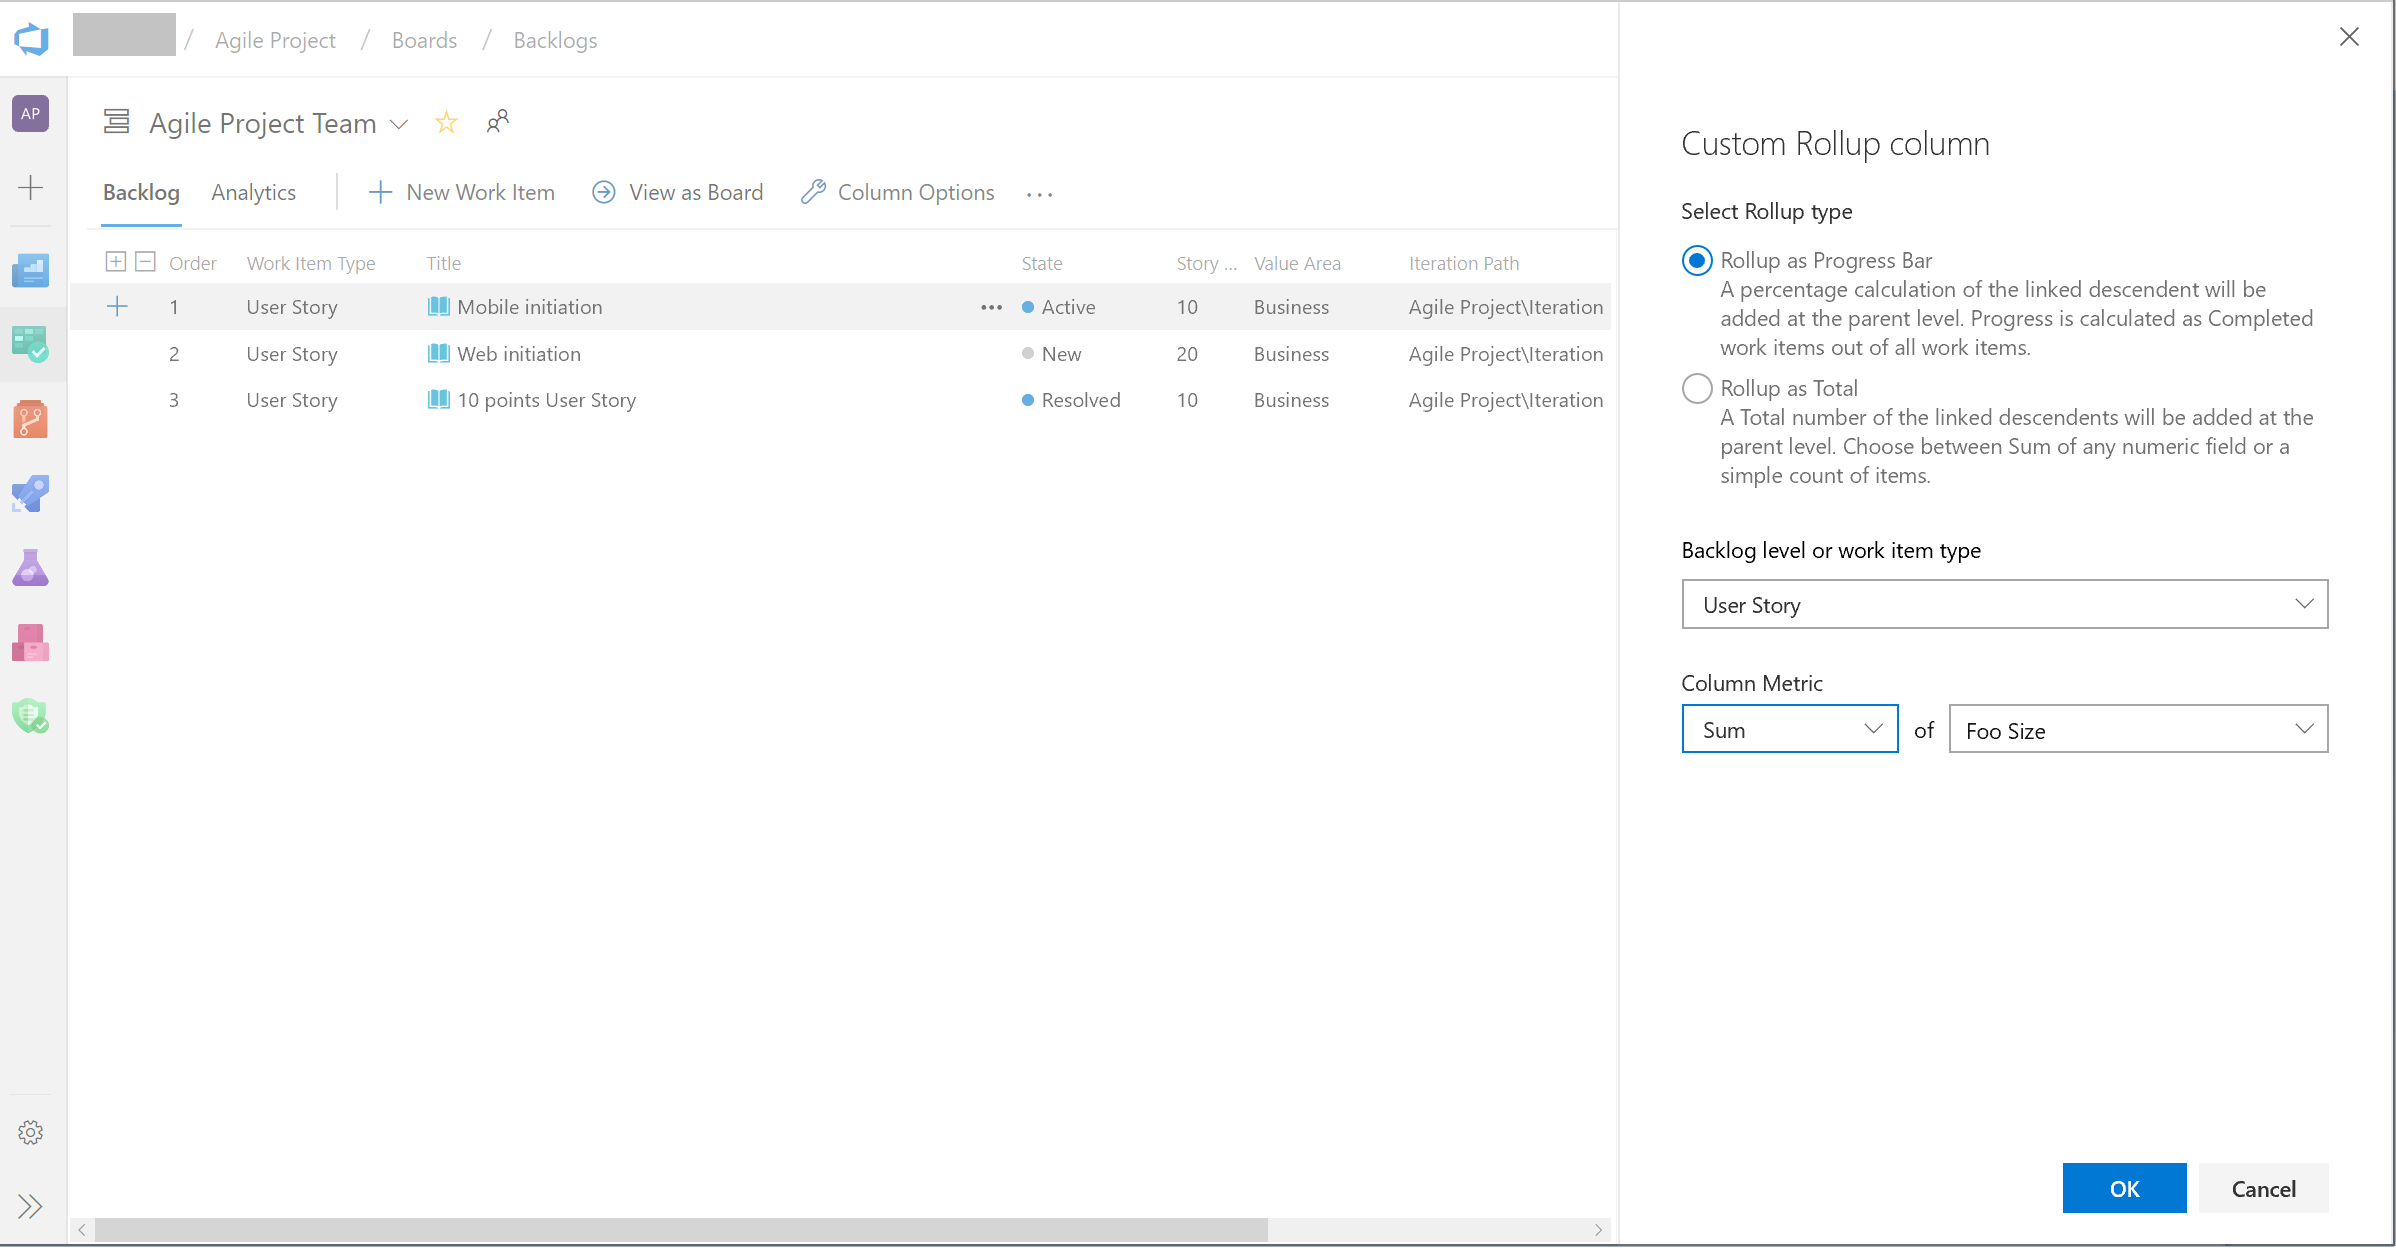
Note that you can't edit your custom column after clicking OK. If you need to make a change, remove the custom column and add another one as desired.
New rule to hide fields in a work item form based on condition
We've added a new rule to the inherited rules engine to let you hide fields in a work item form. This rule will hide fields based on the users group membership. For example, if the user belongs to the "product owner" group, then you can hide a developer specific field. For more details see the documentation here.
Custom work item notification settings
Staying up to date on work items relevant to you or your team is incredibly important. It helps teams collaborate and stay on track with projects and makes sure all the right parties are involved. However, different stakeholders have different levels of investment in different efforts, and we believe that should be reflected in your ability to follow the status of a work item.
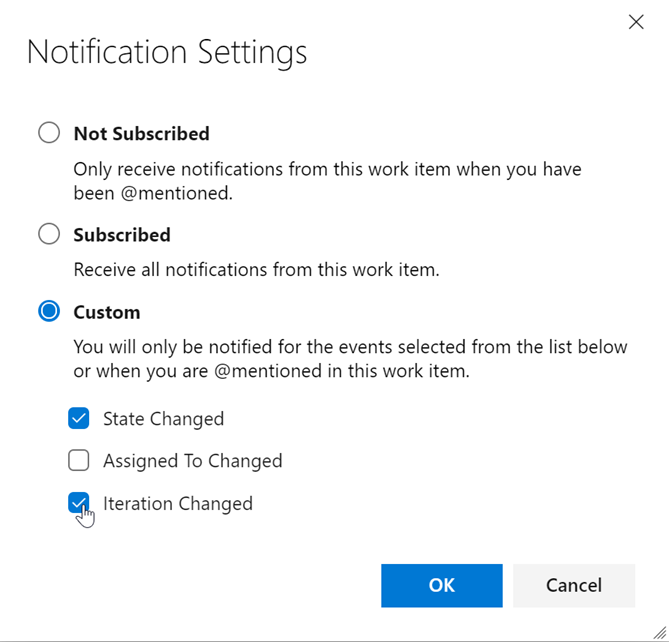
Previously, if you wanted to follow a work item and get notifications on any changes made, you would get email notifications for any and all changes made to the work item. After considering your feedback, we are making following a work item more flexible for all stakeholders. Now, you will see a new settings button next to the Follow button on the top right corner of the work item. This will take you to a pop up that will let you configure your follow options.

From Notification Settings, you can choose from three notification options. First, you can be completely unsubscribed. Second, you can be fully subscribed, where you get notifications for all work item changes. Lastly, you can choose to get notified for some of the top and crucial work item change events. You can select just one, or all three options. This will let team members follow work items at a higher level and not get distracted by every single change that gets made. With this feature, we will eliminate unnecessary emails and allow you to focus on the crucial tasks at hand.
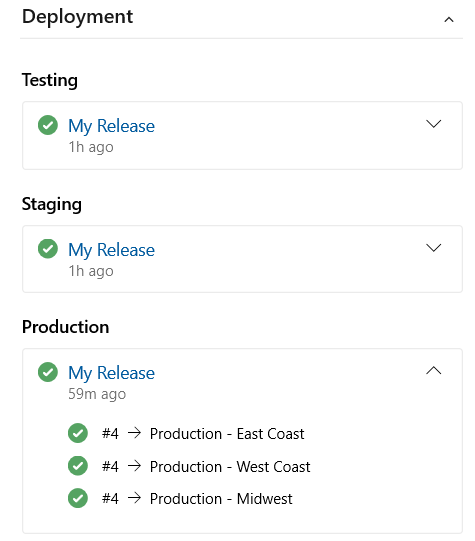
Link work items to deployments
We are excited to release Deployment control on the work item form. This control links your work items to a release and enables you to easily track where your work item has been deployed. To learn more see the documentation here.
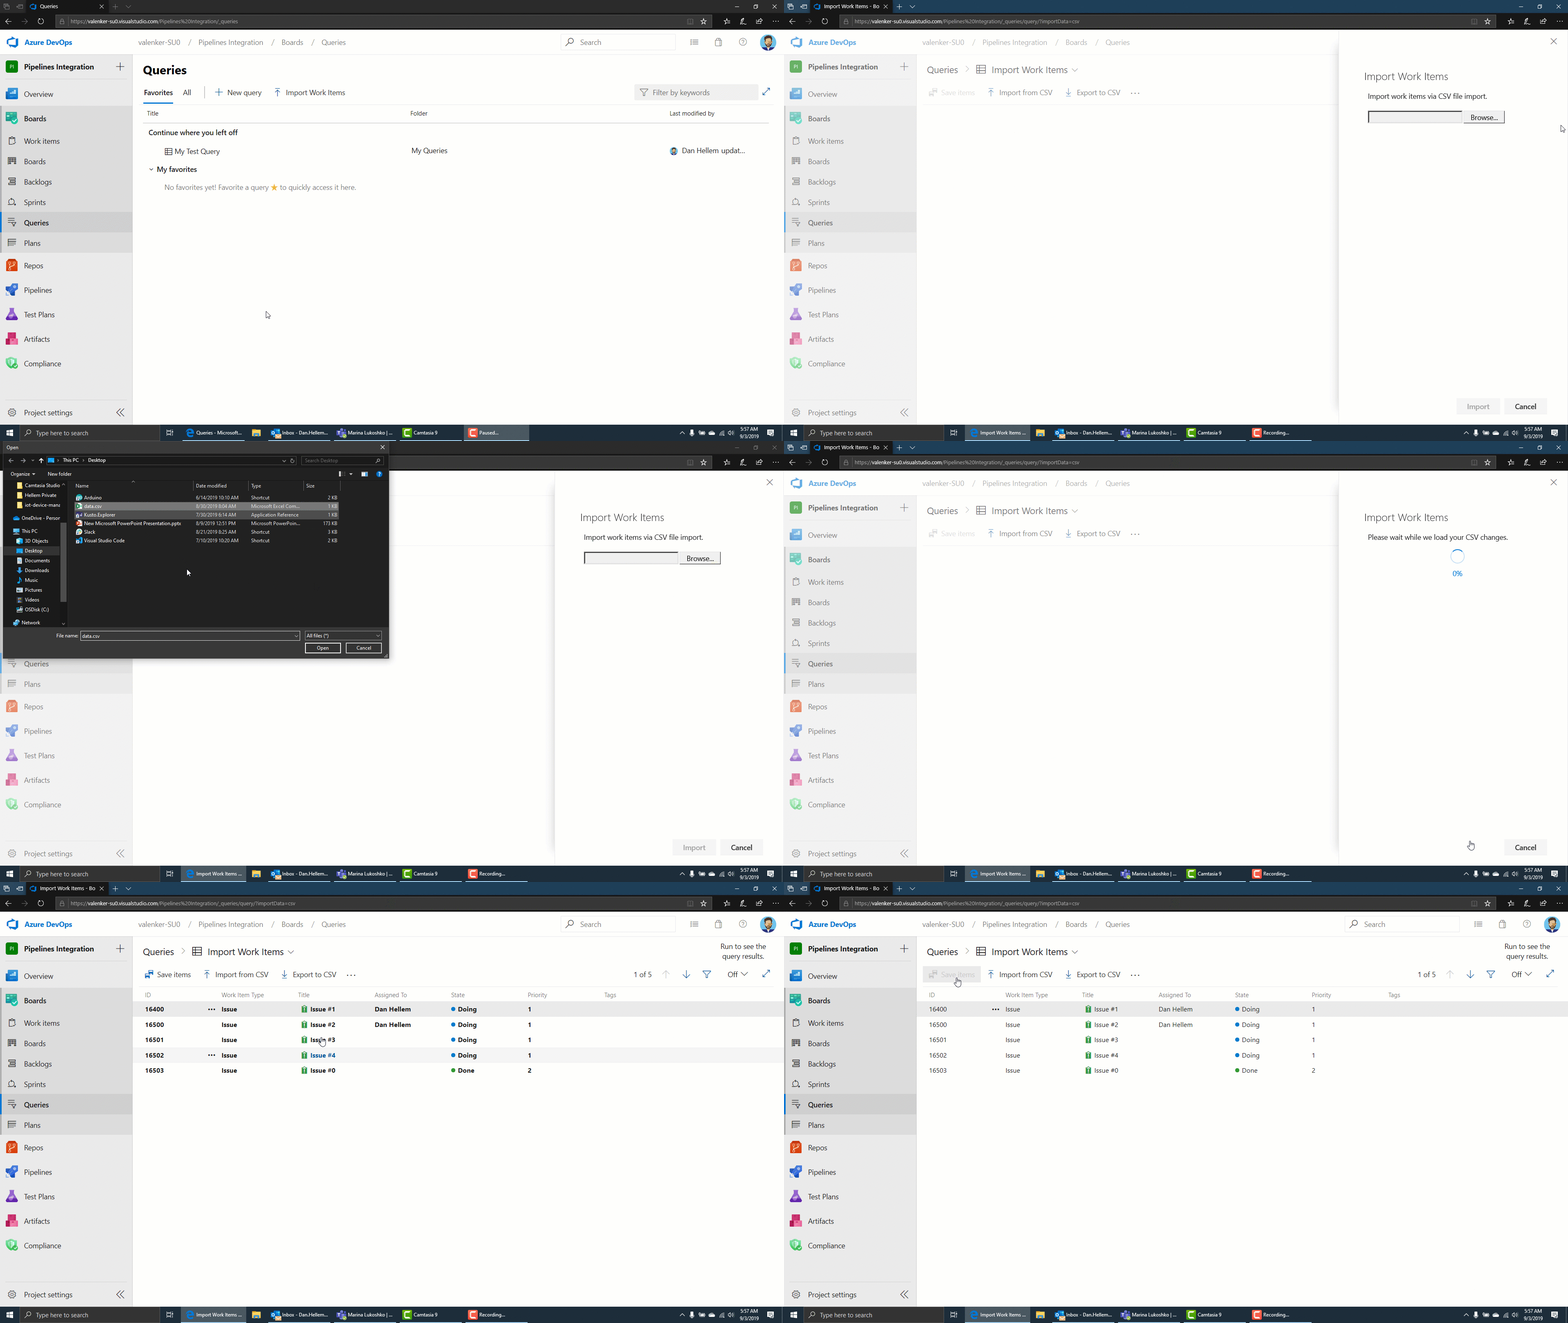
Import work items from a CSV file
Until now, importing work items from a CSV file was dependent on using the Excel plugin. In this update we are providing a first class import experience directly from Azure Boards so you can import new or update existing work items. To learn more, see the documentation here.
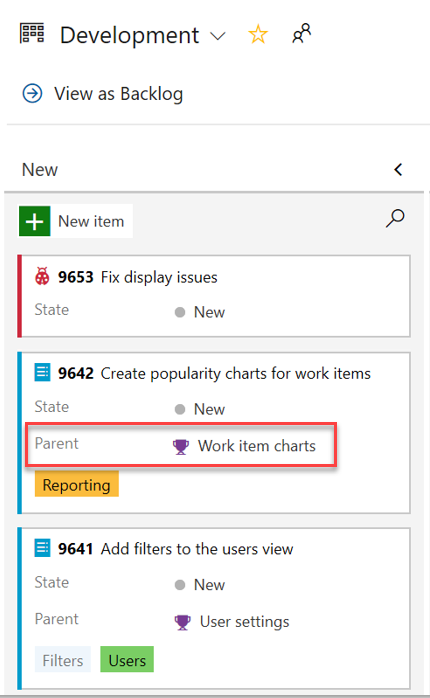
Add parent field to work item cards
Parent context is now available within your Kanban board as a new field for work item cards. You can now add the Parent field to your cards, bypassing the need to use workarounds such as tags and prefixes.
Add parent field to backlog and queries
The parent field is now available when viewing backlogs and query results. To add the parent field, use the Column options view.
Repos
Code coverage metrics and branch policy for pull requests
You can now see code coverage metrics for changes within the pull request (PR) view. This ensures that you have adequately tested your changes through automated tests. Coverage status will appear as a comment in the PR overview. You can view details of coverage information for every code line that is changed in the file diff view.


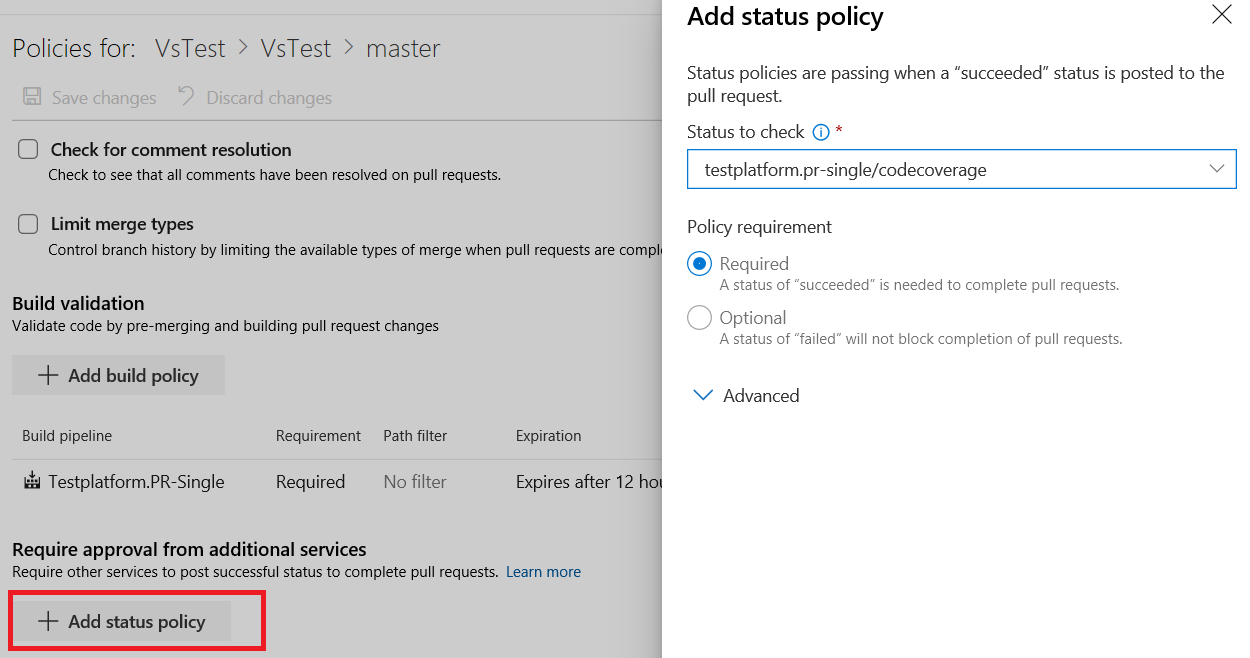
Additionally, repo owners can now set code coverage policies and prevent large, untested changes from being merged into a branch. Desired coverage thresholds can be defined in an azurepipelines-coverage.yml settings file that is checked in at the root of the repo and coverage policy can be defined using the existing configure a branch policy for additional services capability in Azure Repos.
Filter comment notifications from pull requests
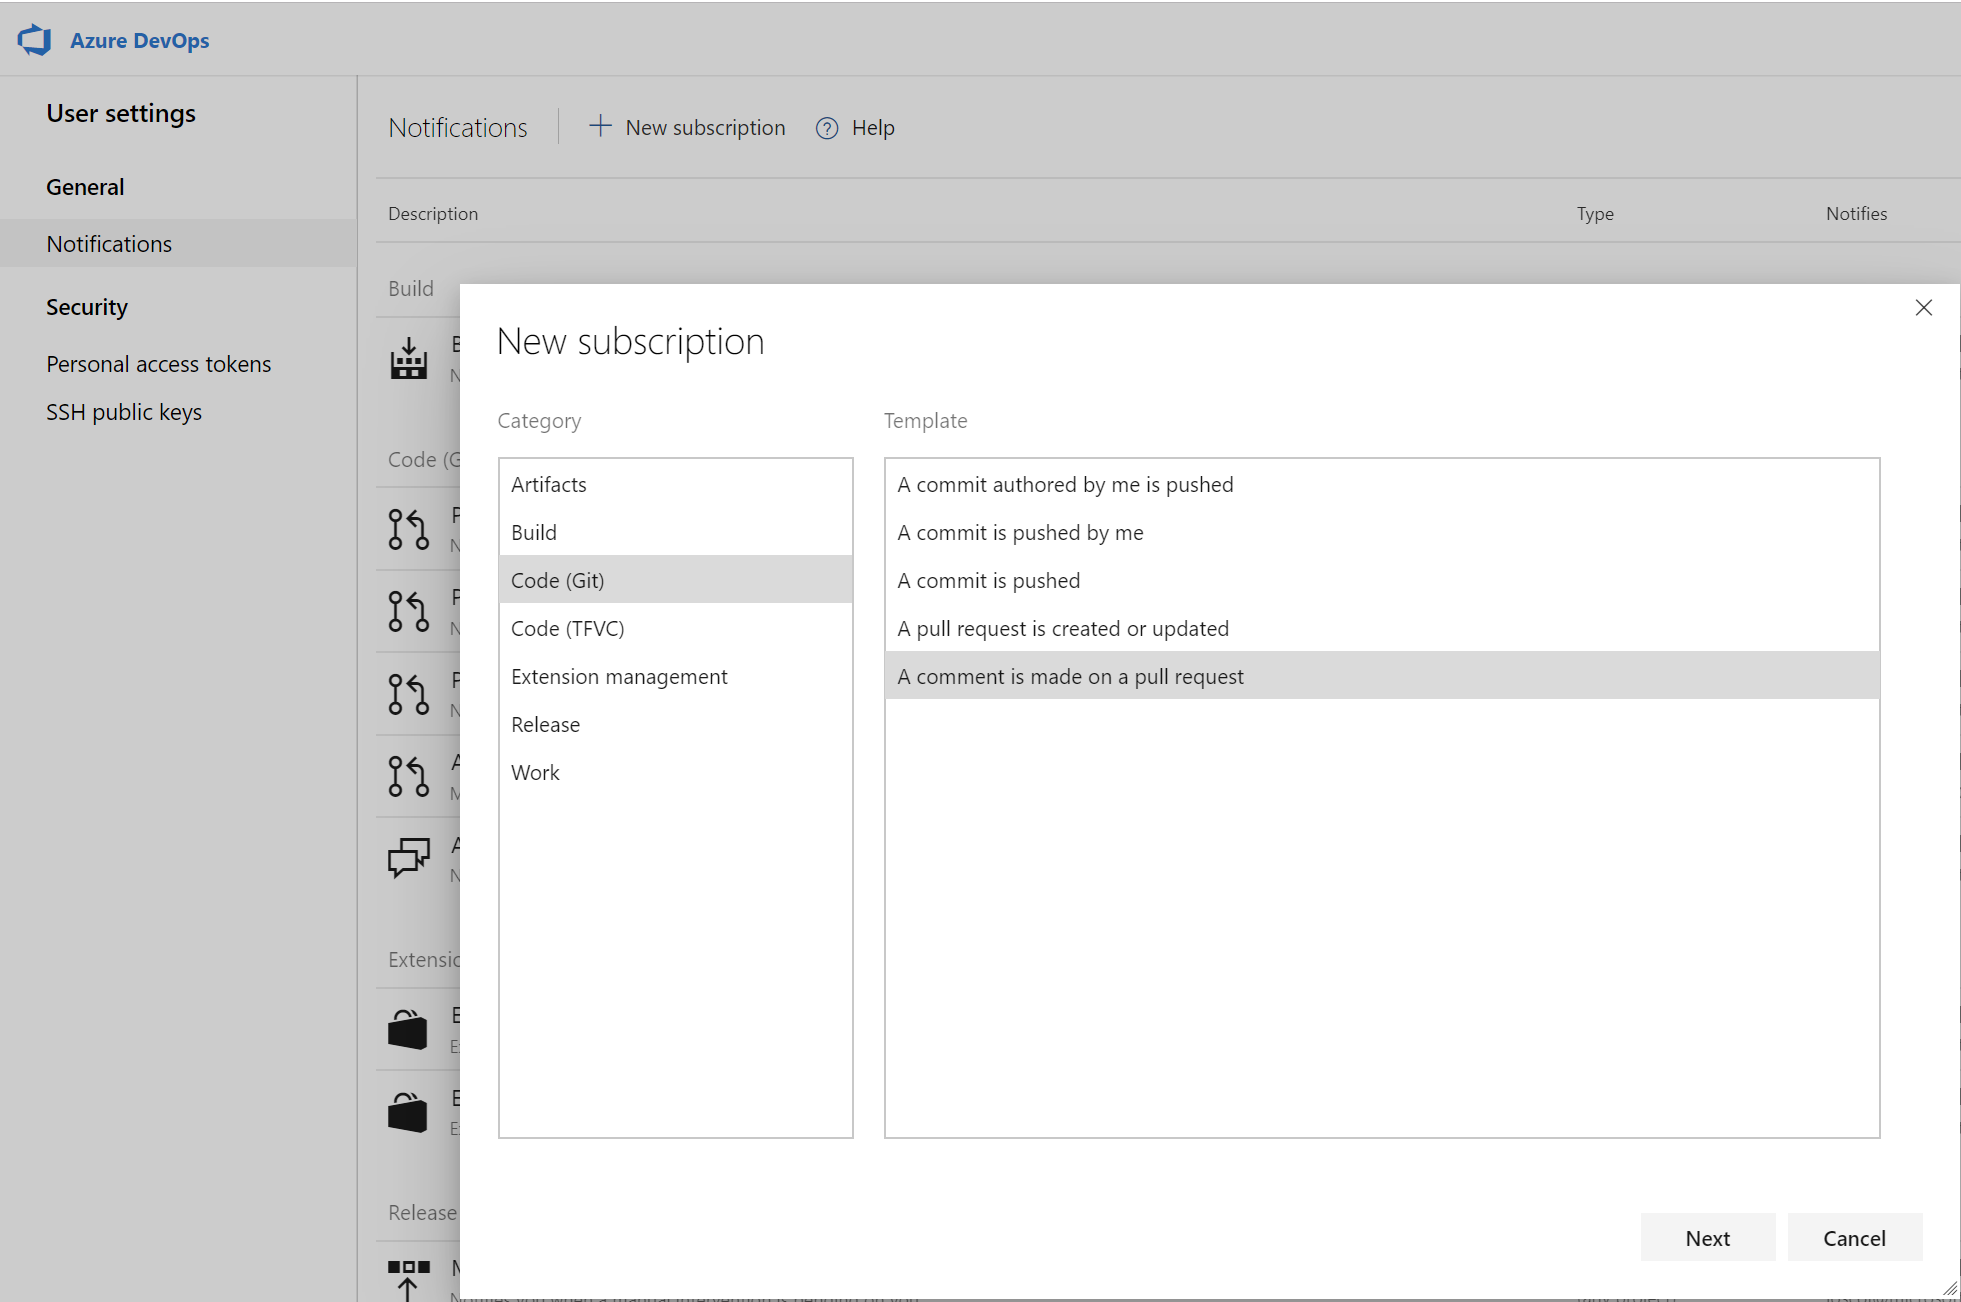
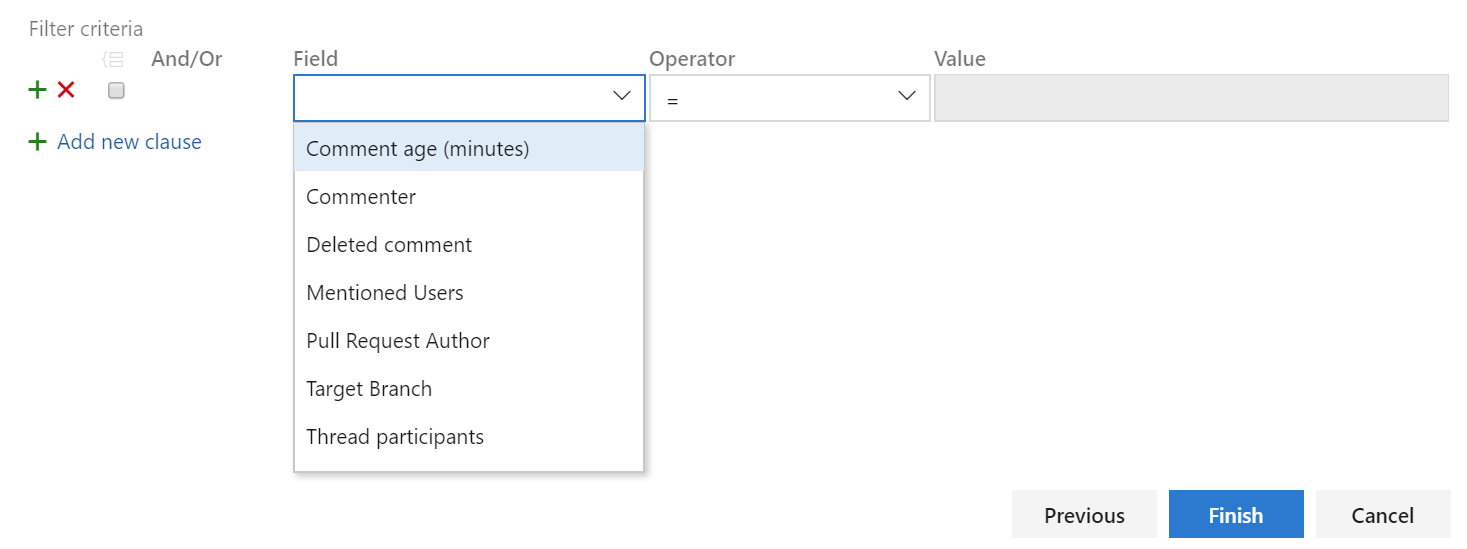
Comments in pull requests can often generate a lot of noise due to notifications. We've added a custom subscription that allows you to filter which comment notifications you subscribe to by comment age, commenter, deleted comment, mentioned users, pull request author, target branch and thread participants. You can create these notification subscriptions by clicking the user icon on the top right corner and navigating to User settings.
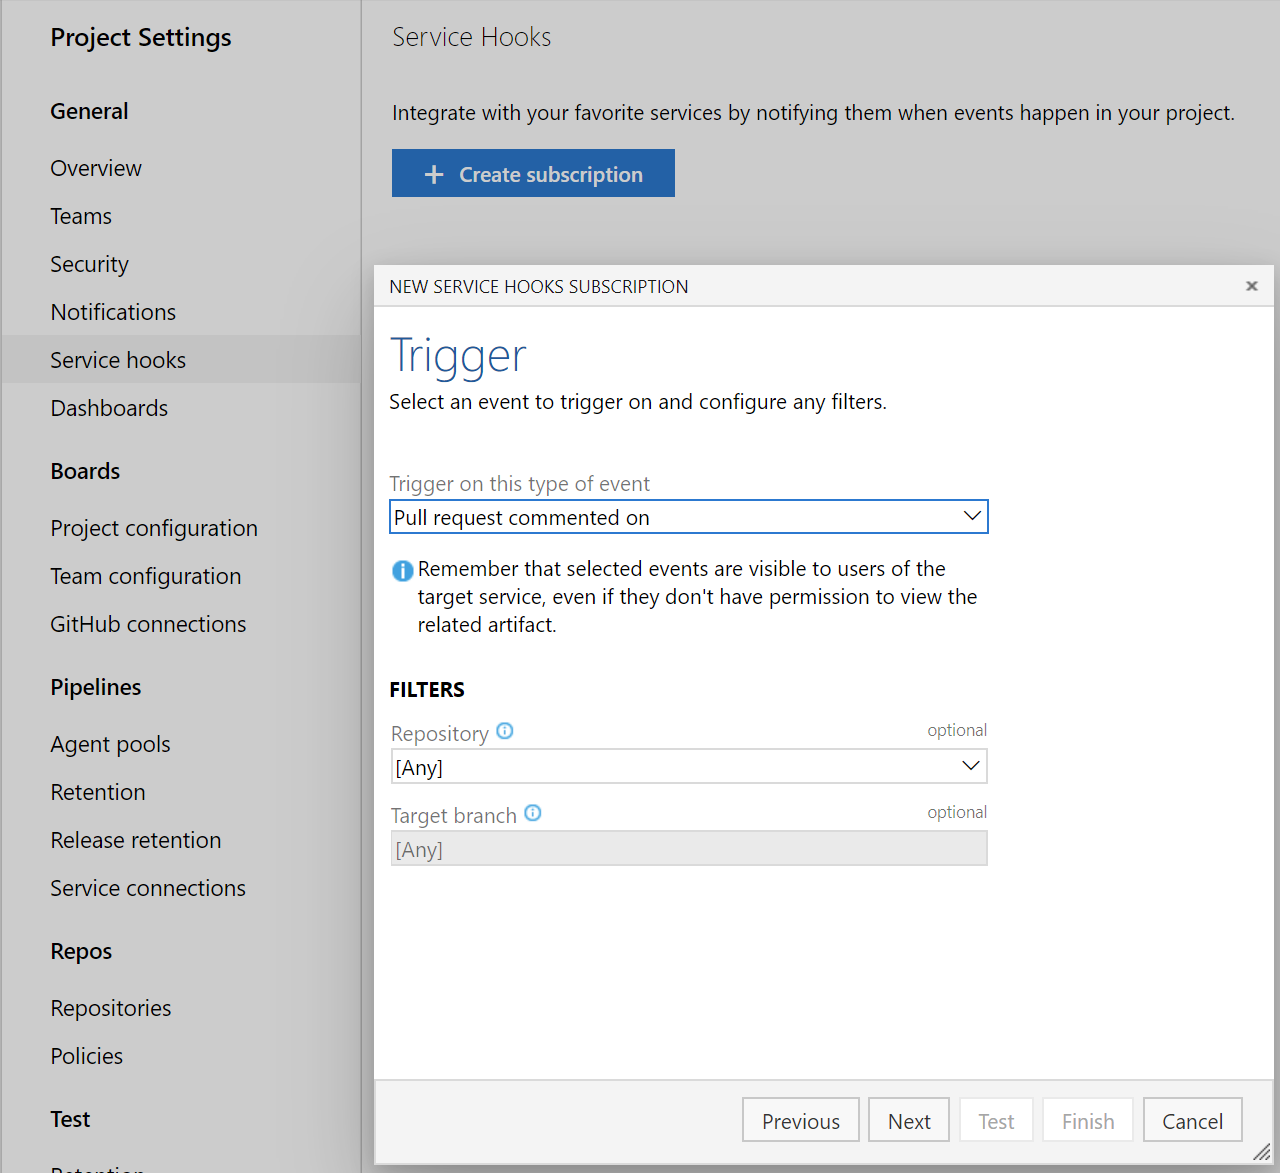
Service hooks for pull request comments
You can now create service hooks for comments in a pull request based on repository and target branch.
Policy to block files with specified patterns
Administrators can now set a policy to prevent commits from being pushed to a repository based on file types and paths. The file name validation policy will block pushes that match the provided pattern.

Resolve work items via commits using key words
You can now resolve work items via commits made to the default branch by using key words like fix, fixes, or fixed. For example, you can write - "this change fixed #476" in your commit message and work item #476 will be completed when the commit is pushed or merged into the default branch. For more details see the documentation here.
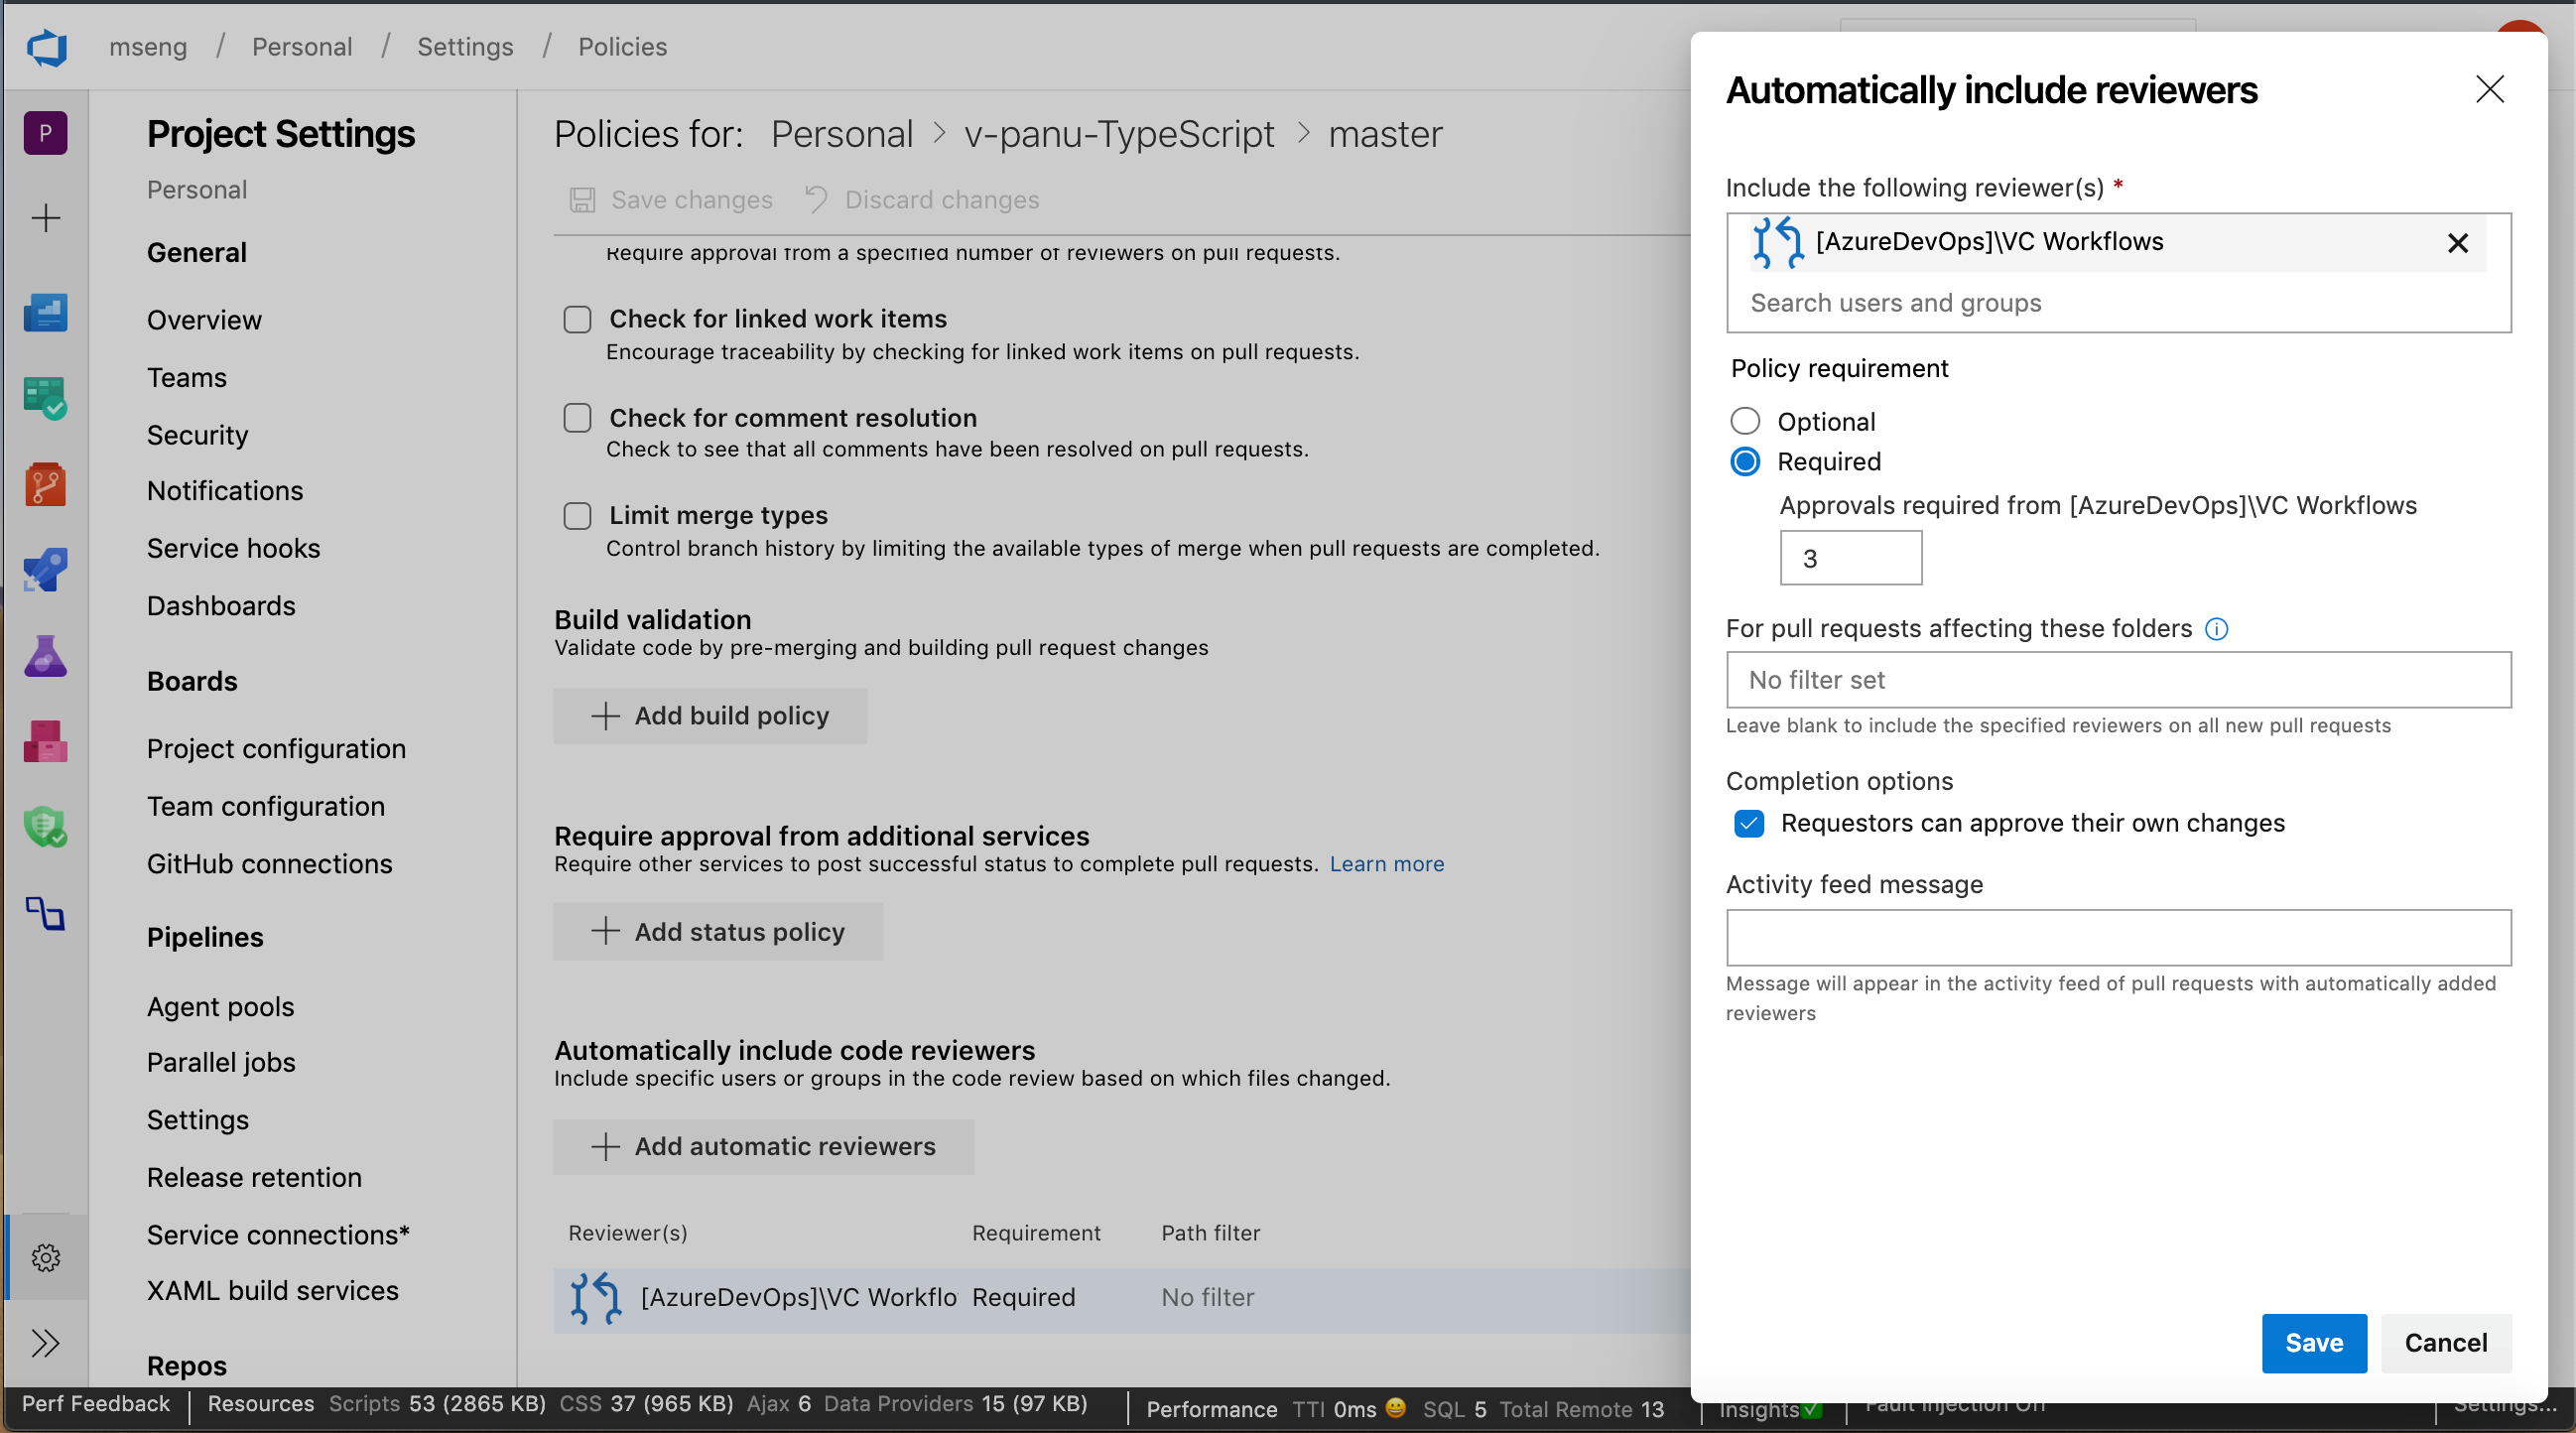
Granularity for automatic reviewers
Previously, when adding group level reviewers to a pull request, only one approval was required from the group that was added. Now you can set policies that require more than one reviewer from a team to approve a pull request when adding automatic reviewers. In addition, you can add a policy to prevent requestors approving their own changes.
Use service account-based authentication to connect to AKS
Previously, when configuring Azure Pipelines from the AKS Deployment Center, we used an Azure Resource Manager Connection. This connection had access to the entire cluster and not just the namespace for which the pipeline was configured. With this update, our pipelines will use service account-based authentication to connect to the cluster so that it will only have access to the namespace associated with the pipeline.
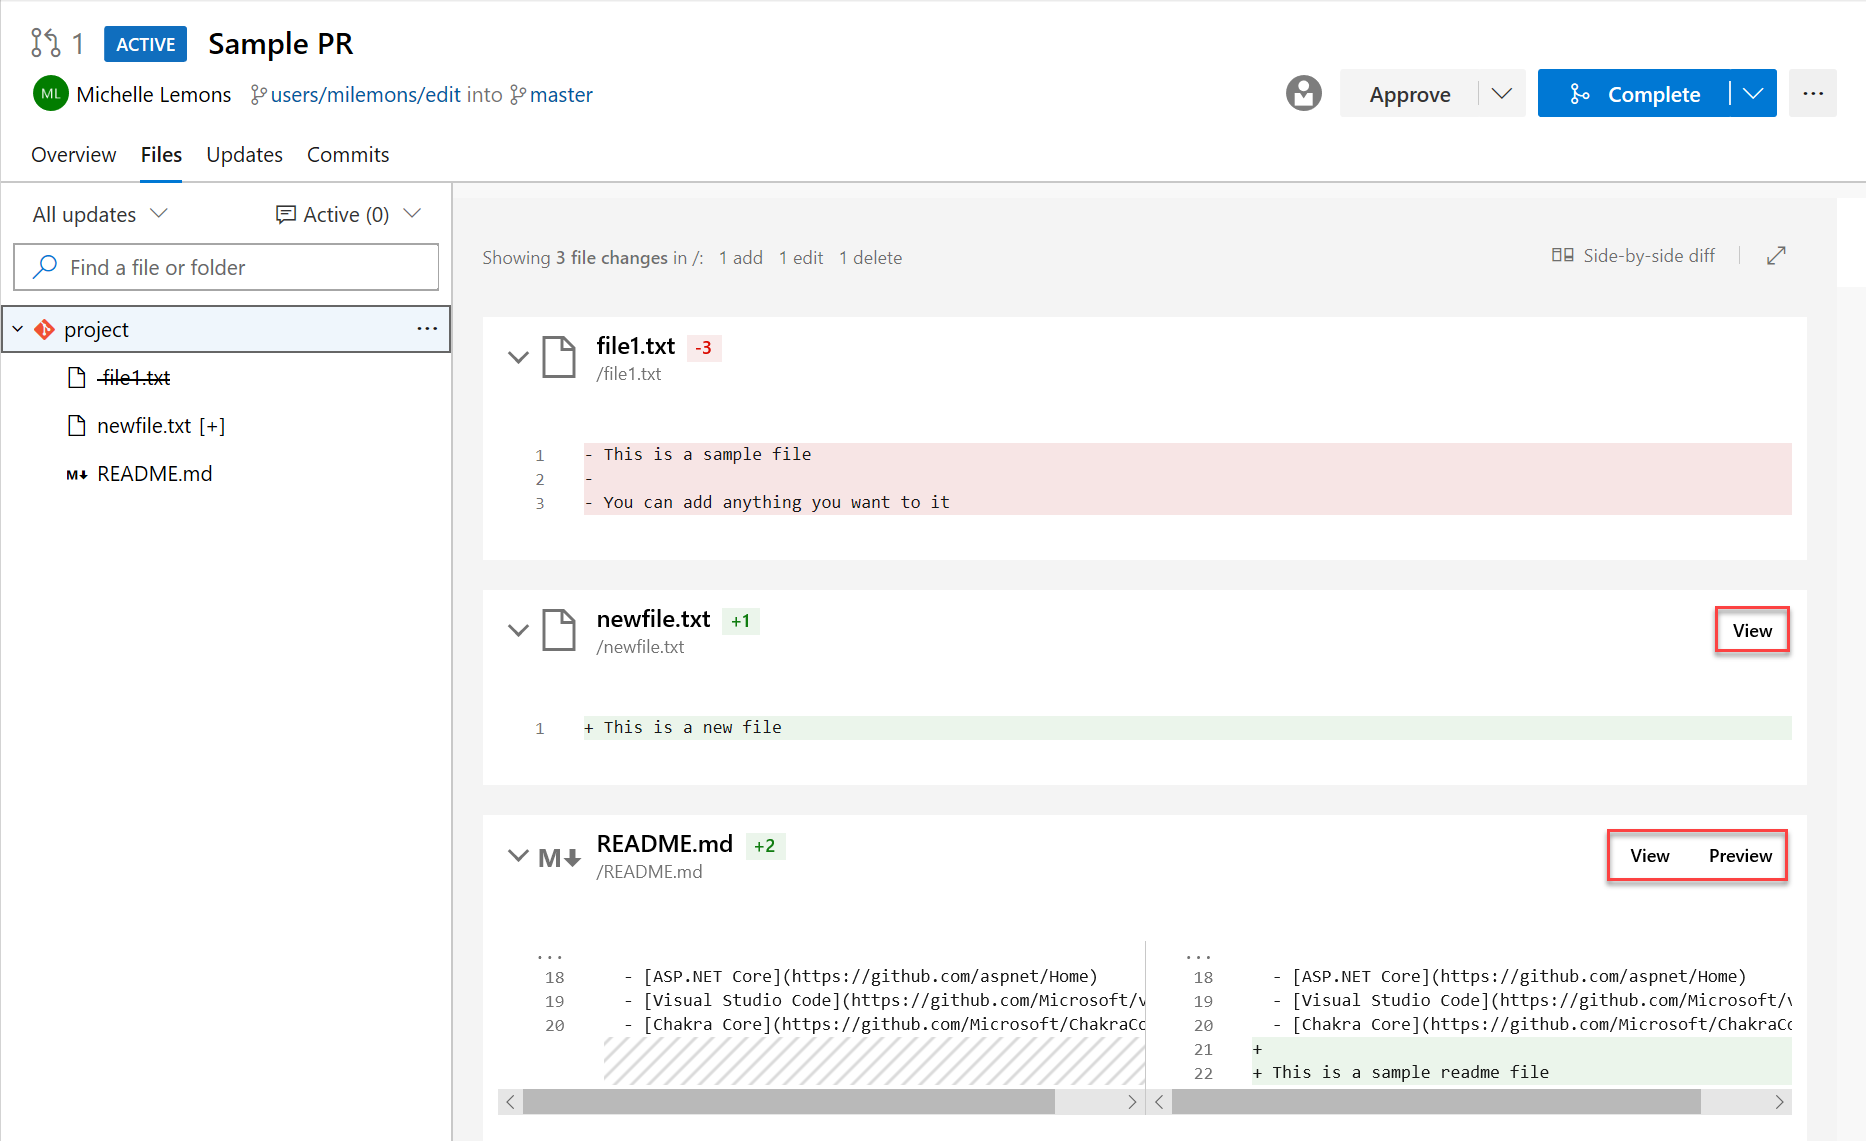
Preview Markdown files in pull request Side-by-side diff
You can now see a preview of how a markdown file will look by using the new Preview button. In addition, you can see the full content of a file from the Side-by-side diff by selecting the View button.
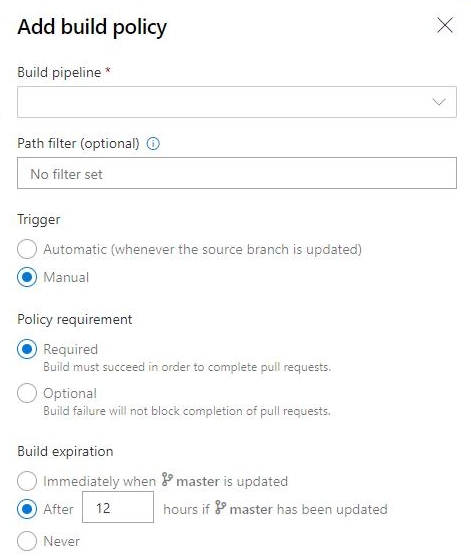
Build policy expiration for manual builds
Policies enforce your team's code quality and change management standards. Previously, you could set build expiration polices for automated builds. Now you can set build expiration policies to your manual builds as well.
Add a policy to block commits based on the commit author email
Administrators can now set a push policy to prevent commits from being pushed to a repository for which the commit author email does not match the provided pattern.
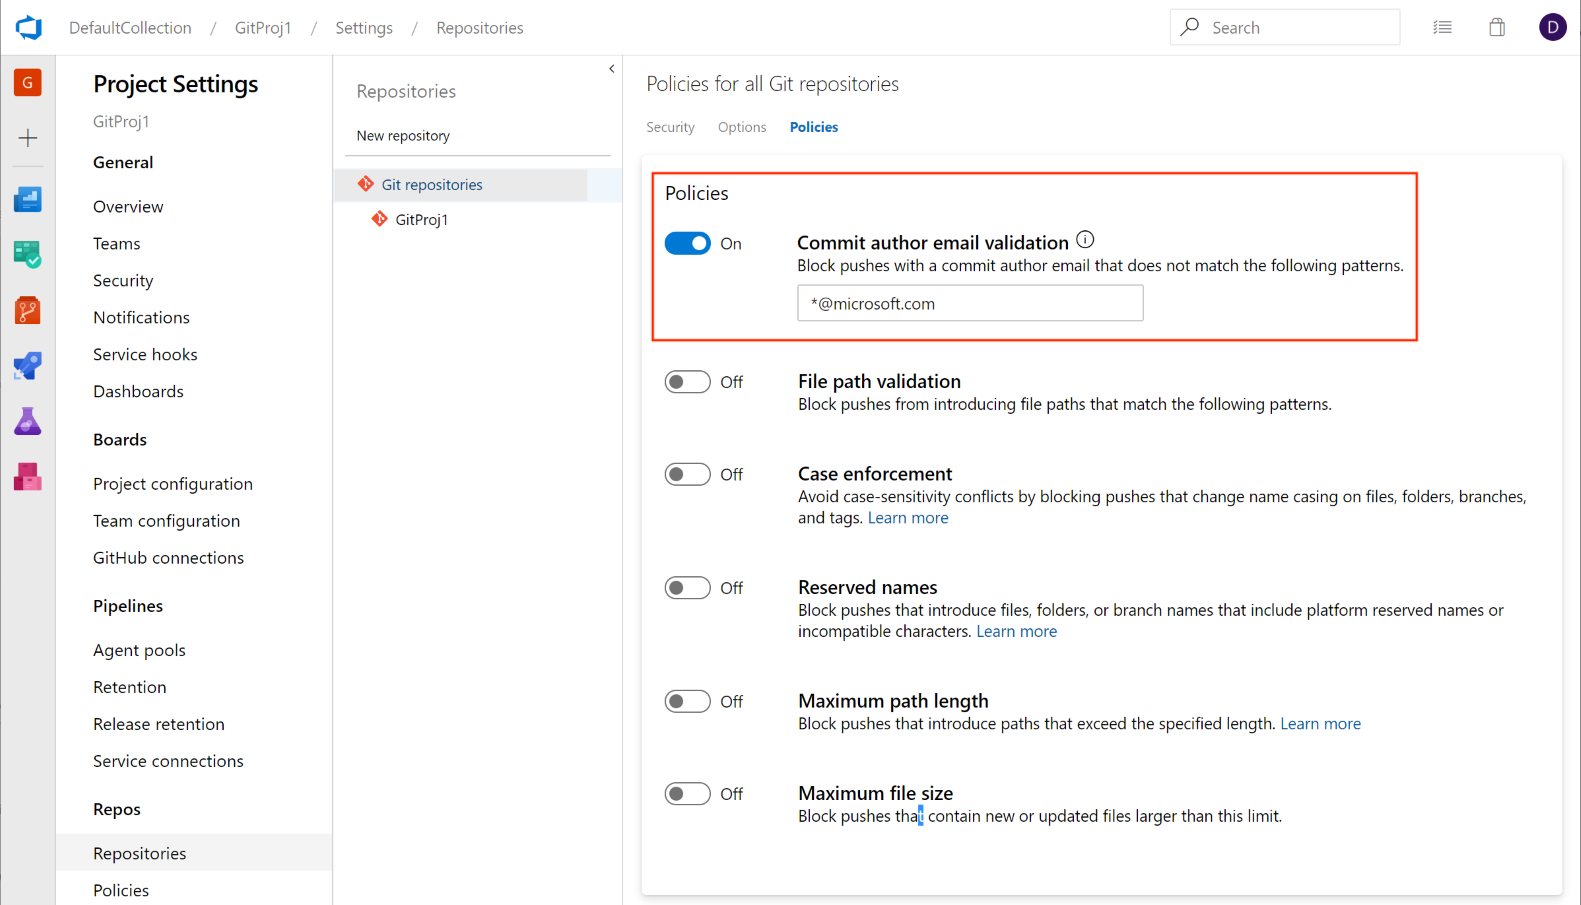
This feature was prioritized based on a suggestion from the Developer Community to deliver a similar experience. We will continue to keep the ticket open and encourage users to tell us what other types of push policies you'd like to see.
Mark files as reviewed in a pull request
Sometimes, you need to review pull requests that contain changes to a large number of files and it can be difficult to keep track of which files you have already reviewed. Now you can mark files as reviewed in a pull request.
You can mark a file as reviewed by using the drop-down menu next to a file name or by hover and clicking on the file name.
Note
This feature is only meant to track your progress as you review a pull request. It does not represent voting on pull requests so these marks will only be visible to the reviewer.
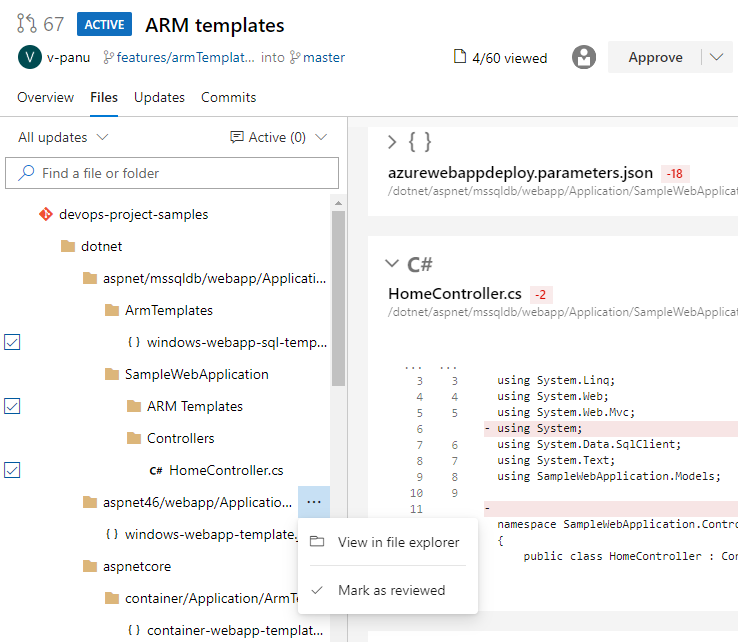
This feature was prioritized based on a suggestion from the Developer Community.
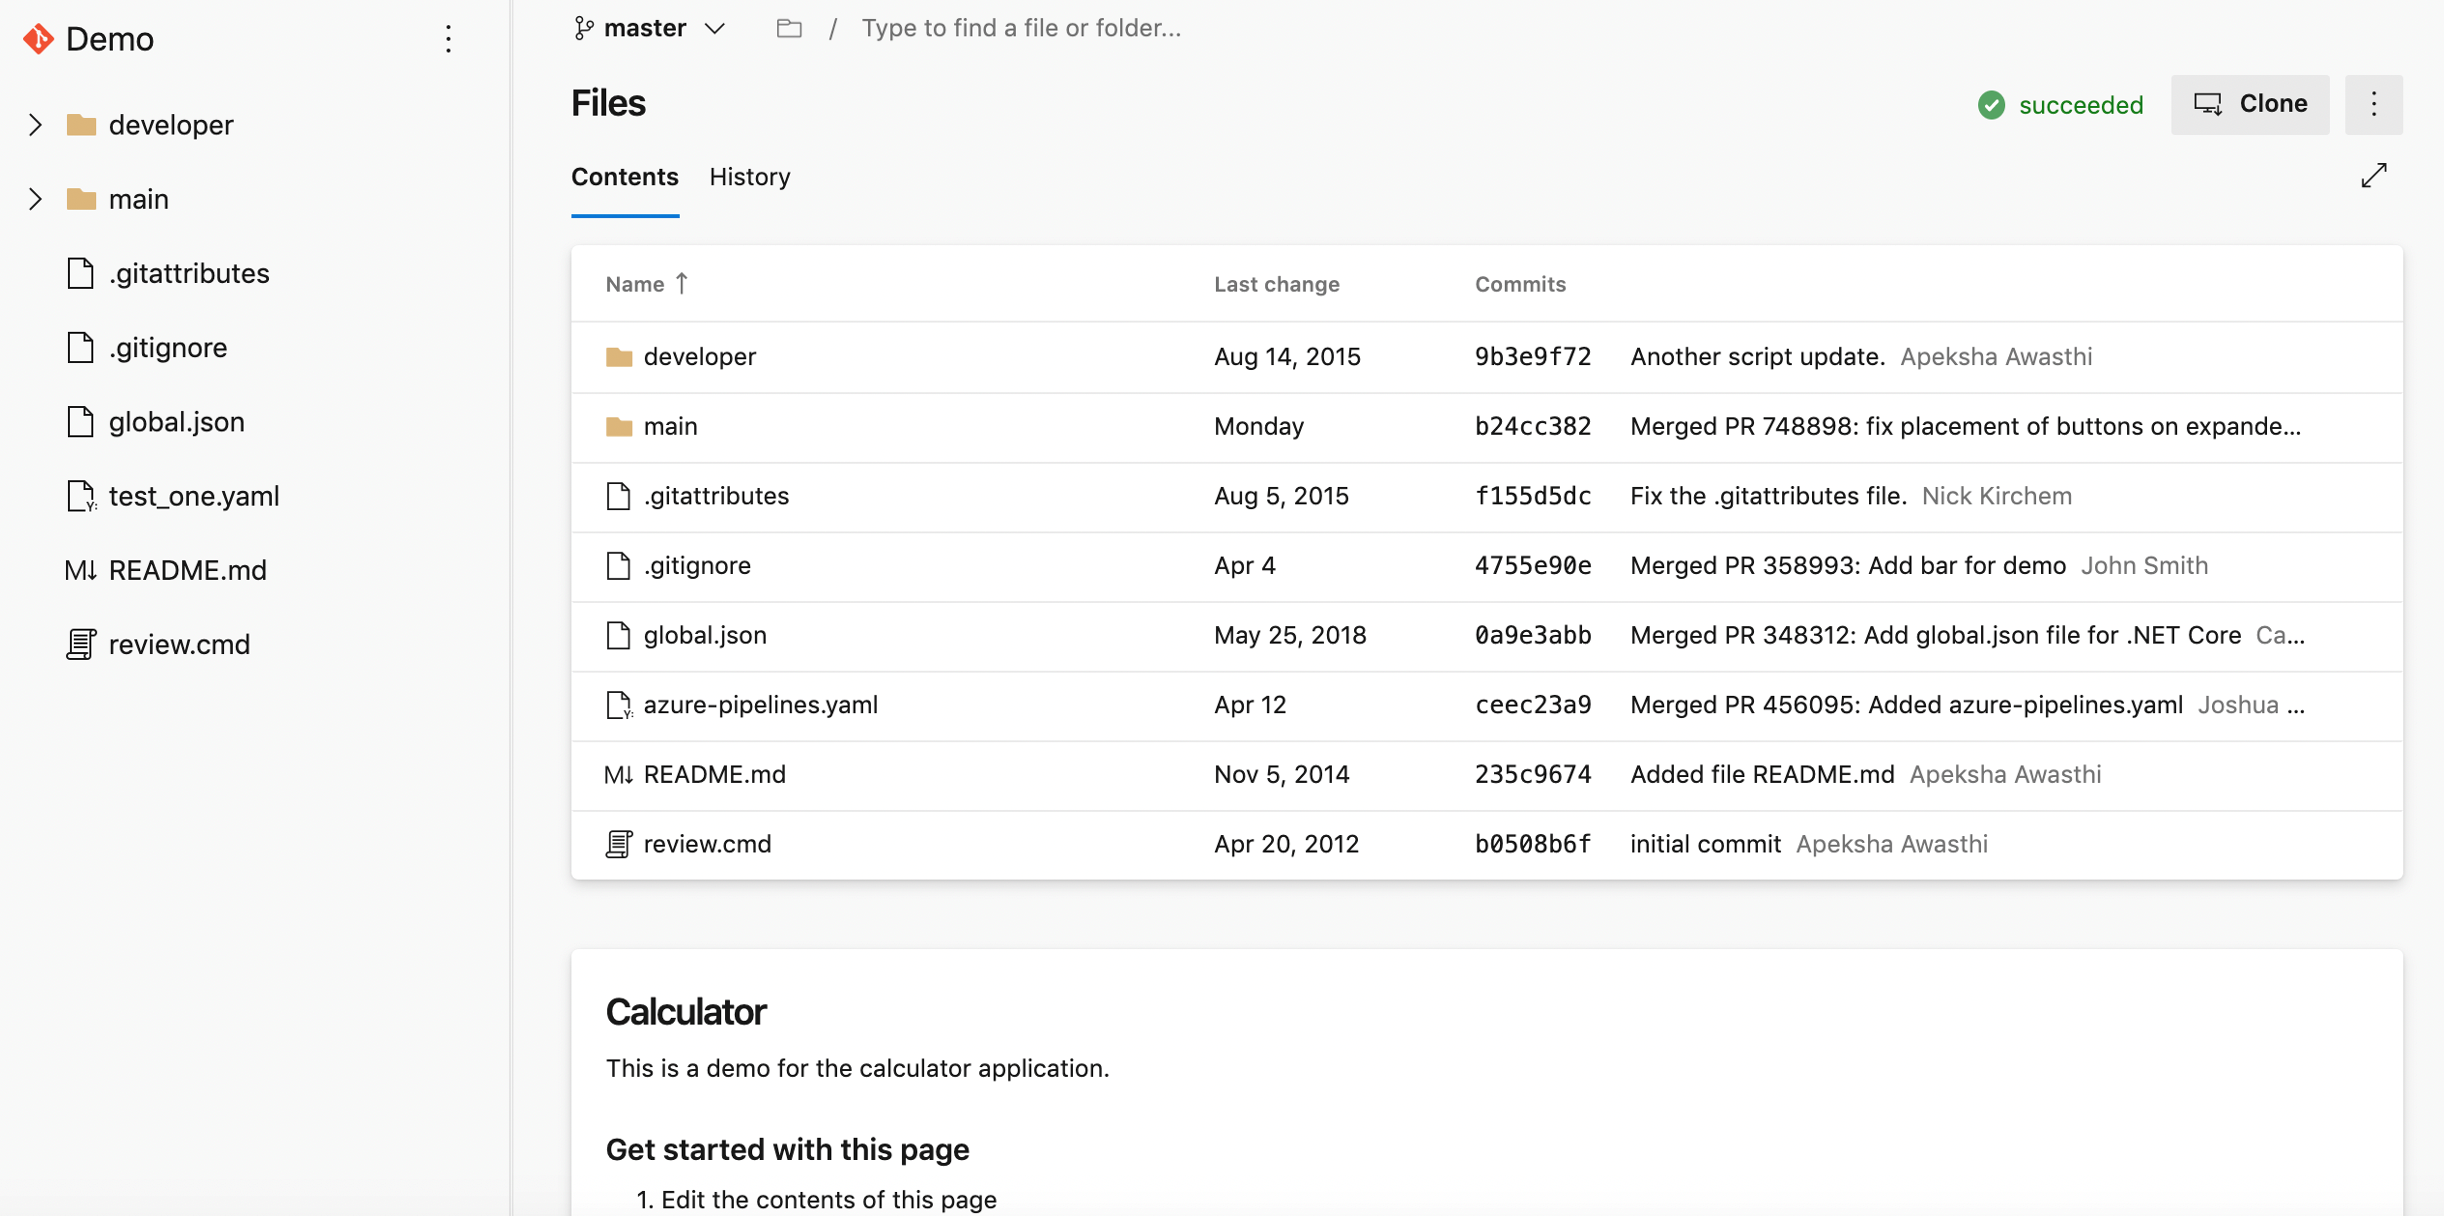
New Web UI for Azure Repos landing pages
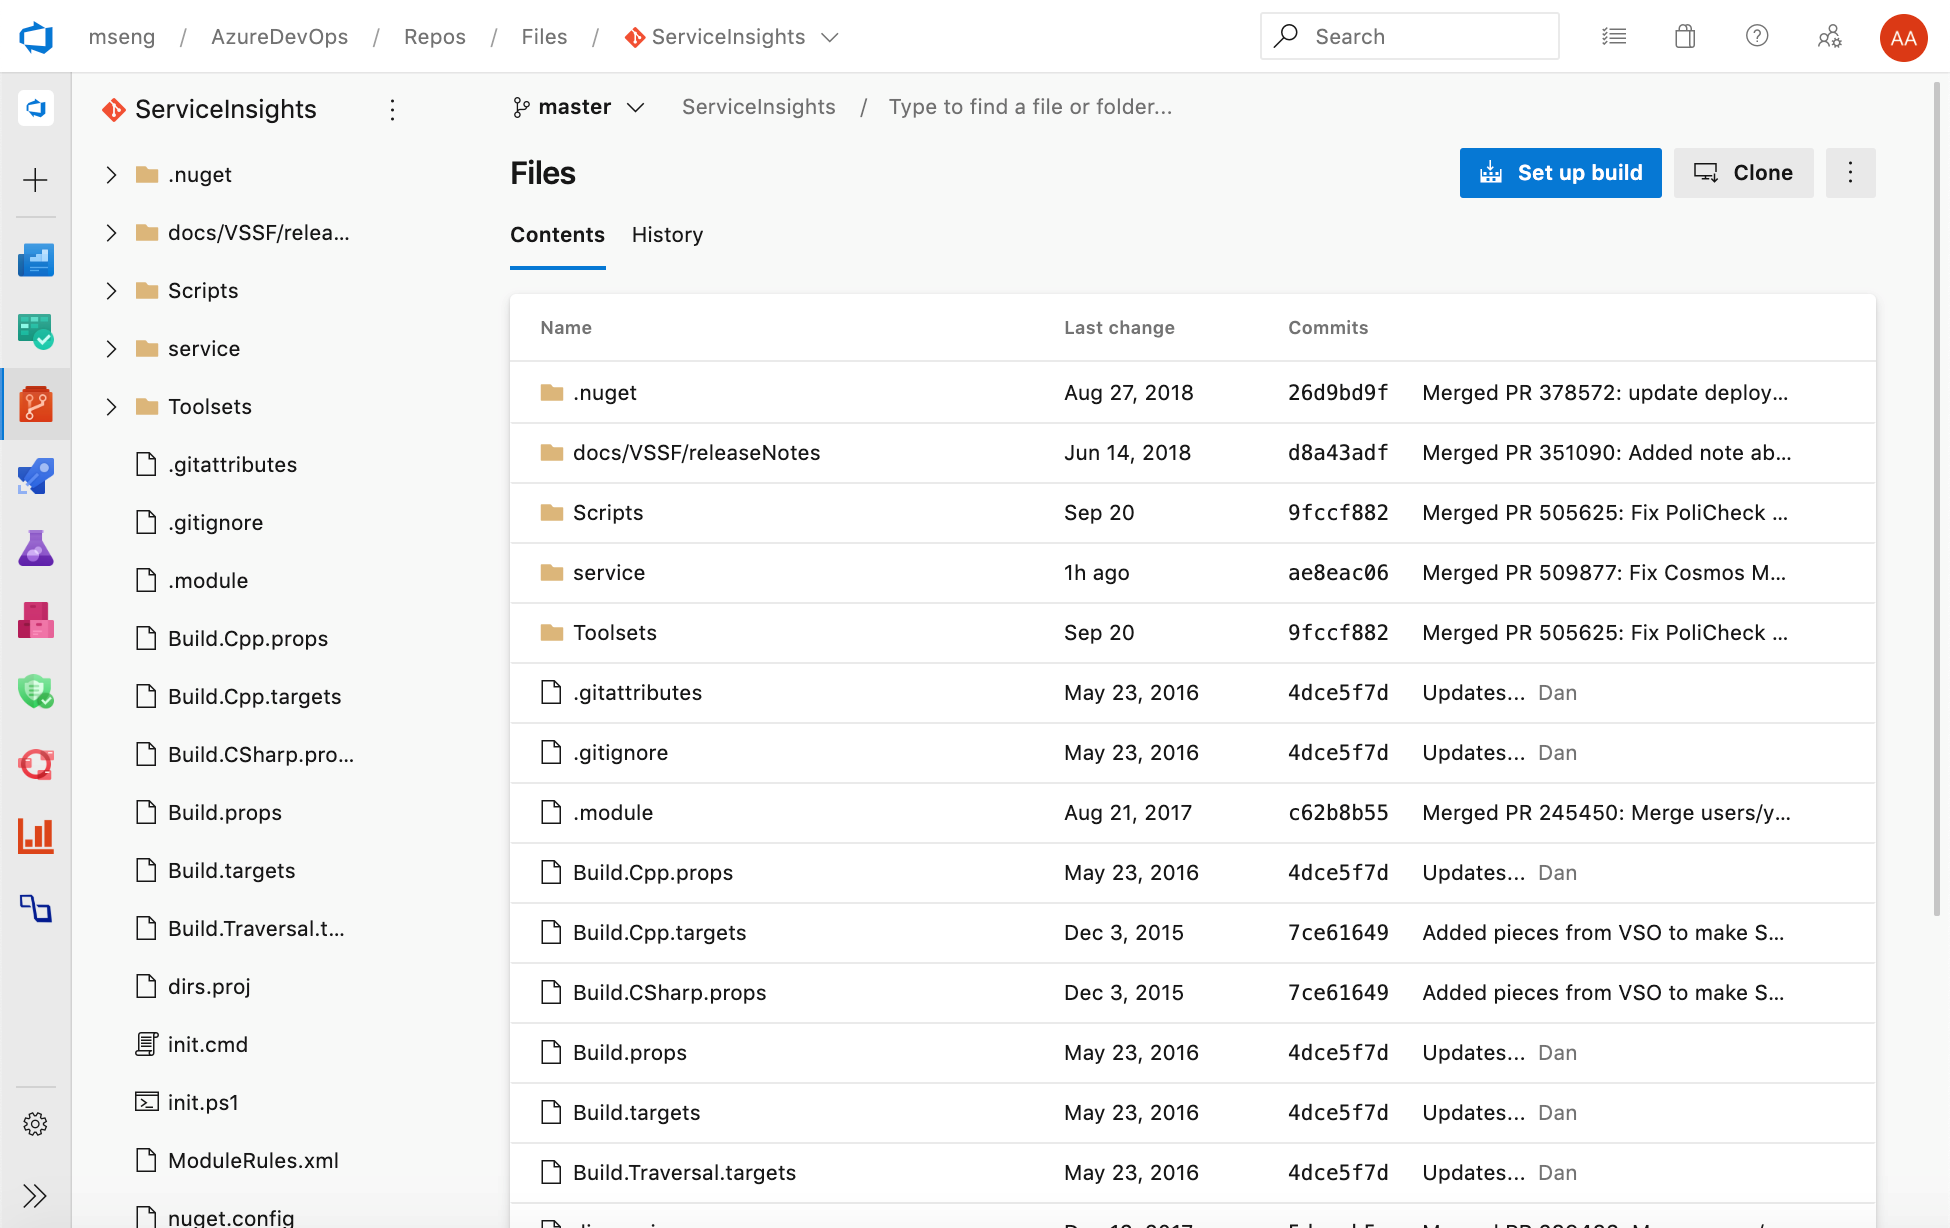
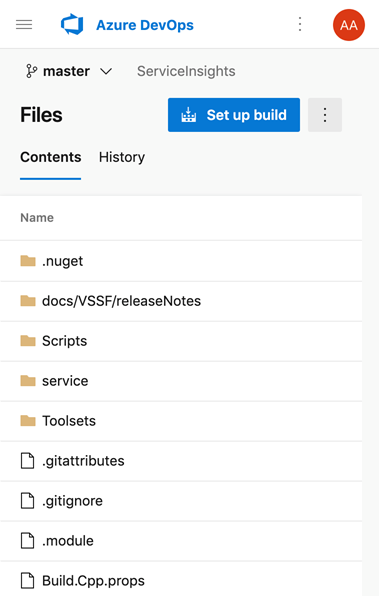
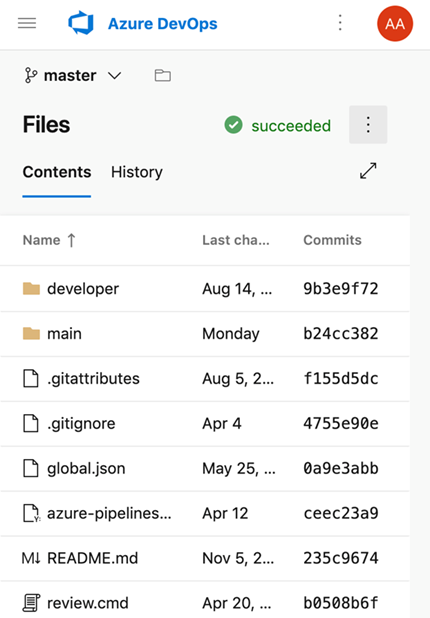
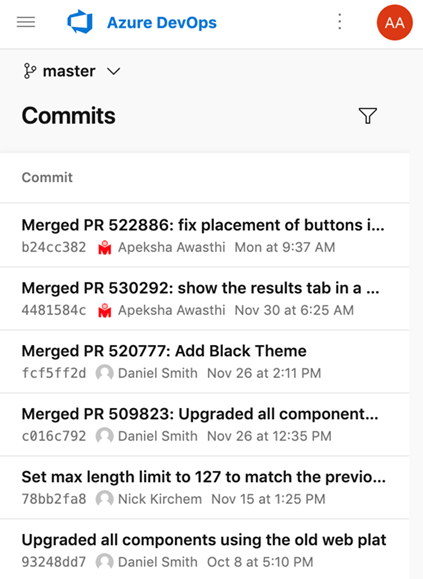
You can now try out our new modern, fast, and mobile-friendly landing pages within Azure Repos. These pages are available as New Repos landing pages. Landing pages include all pages except for pull request details, commit details and branch compare.
Web
Mobile
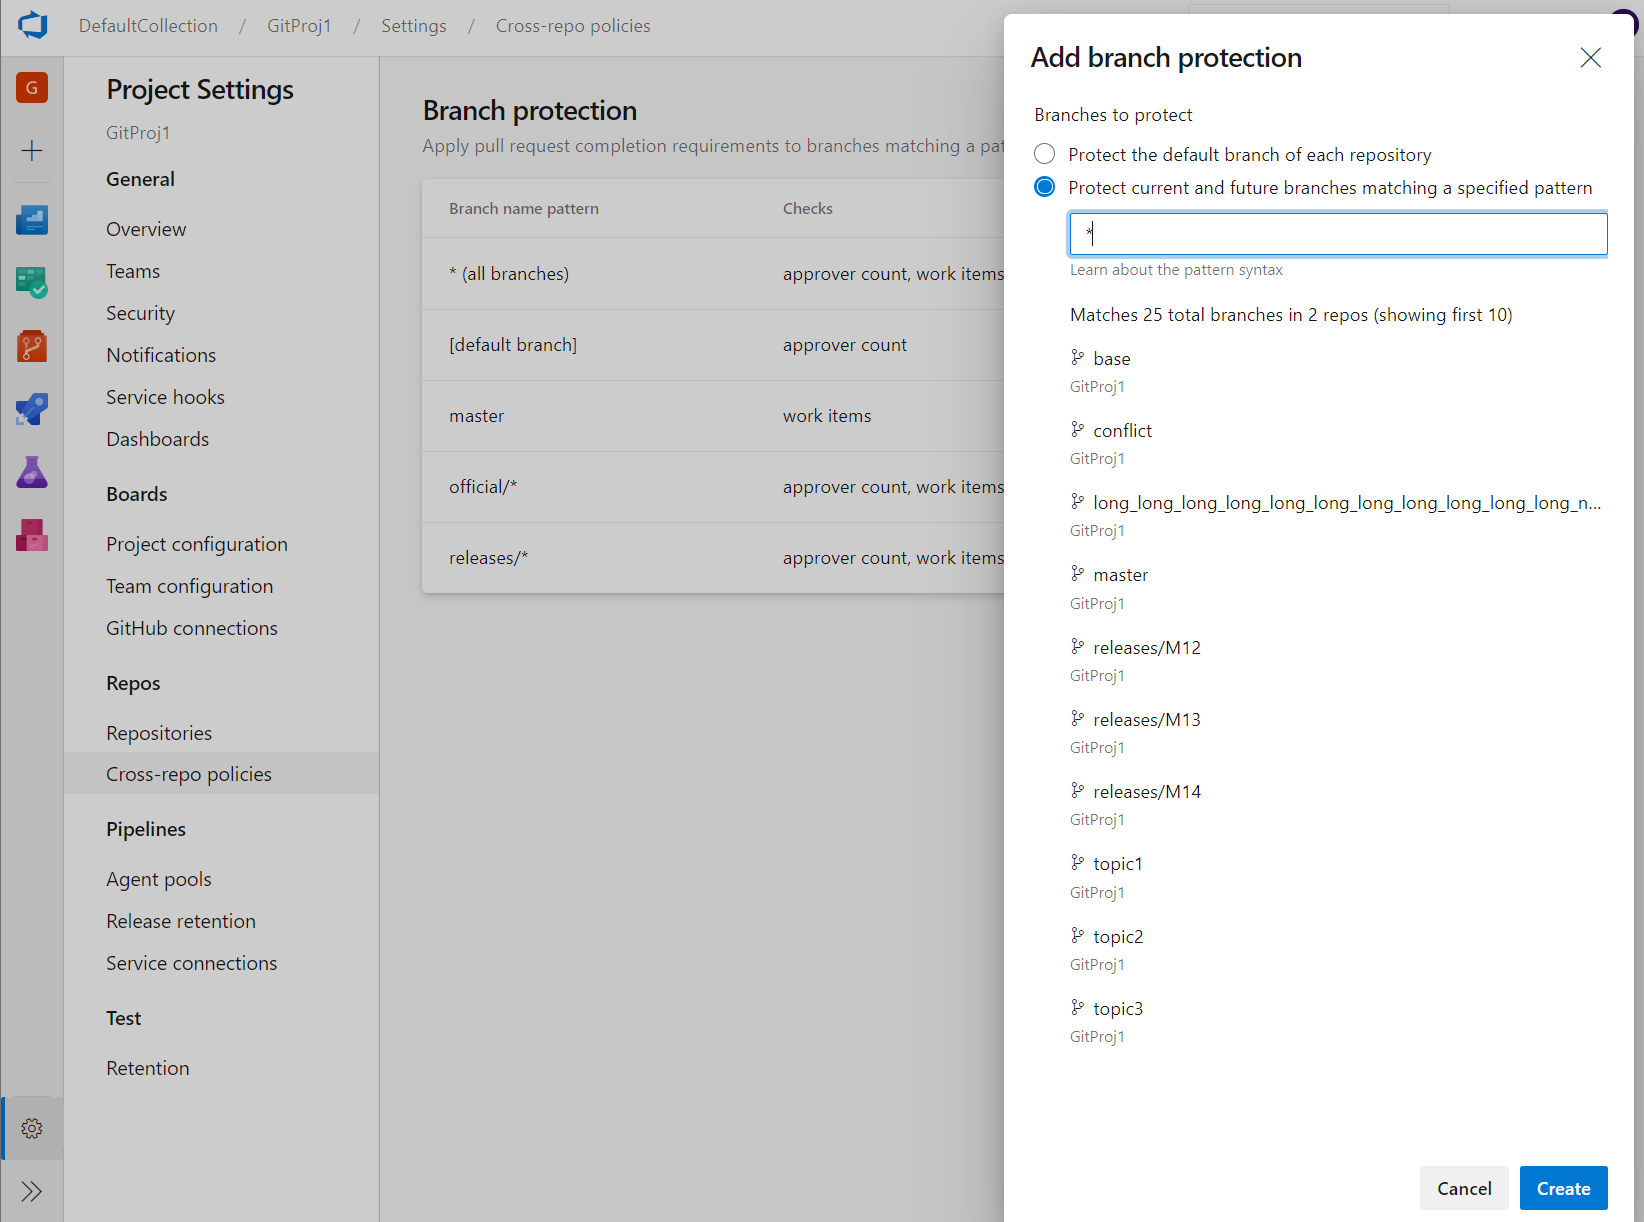
Cross-repo branch policy administration
Branch policies are one of the powerful features of Azure Repos that help you protect important branches. Although the ability to set policies at project level exists in the REST API, there was no user interface for it. Now, admins can set policies on a specific branch or the default branch across all repositories in their project. For example, an admin could require two minimum reviewers for all pull requests made into every main branch across every repository in their project. You can find the Add branch protection feature in the Repos Project Settings.
New web platform conversion landing pages
We've updated the Repos landing pages user experience to make it modern, fast, and mobile-friendly. Here are two examples of the pages that have been updated, we will continue to update other pages in future updates.
Web experience:
Mobile experience:
Support for Kotlin language
We're excited to announce that we now support Kotlin language highlighting in the file editor. Highlighting will improve the readability of your Kotlin text file and help you quickly scan to find errors. We prioritized this feature based on a suggestion from the Developer Community.
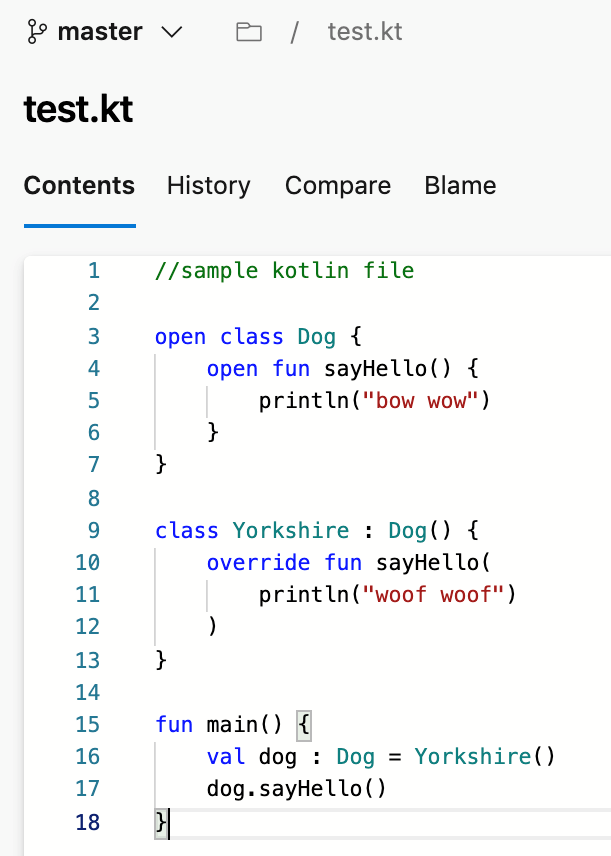
Custom notification subscription for draft pull requests
To help reduce the number of email notifications from pull requests, you can now create a custom notification subscription for pull requests that are created or updated in draft state. You can get emails specifically for draft pull requests or filter out emails from draft pull requests so your team doesn't get notified before the pull request is ready to be reviewed.
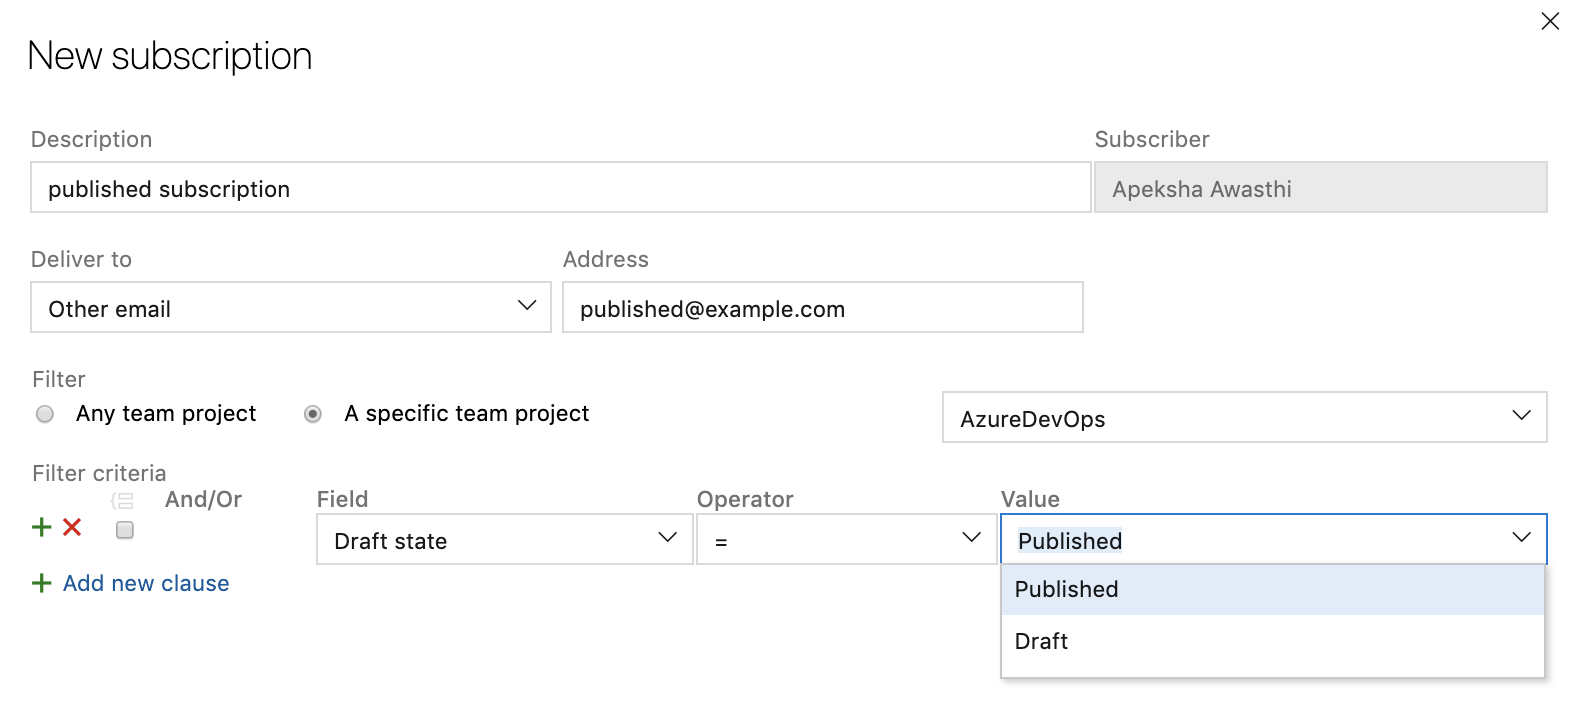
Improved PR actionability
When you have many pull requests to review, understanding where you should take action first can be difficult. To improve pull request actionability, you can now create multiple custom queries on the pull request list page with several new options to filter by such as draft state. These queries will create separate and collapsible sections on your pull request page in addition to "Created by me" and "Assigned to me". You can also decline to review a pull request that you were added to via the Vote menu or the context menu on the pull request list page. In the custom sections, you will now see separate tabs for pull requests that you have provided a review on or declined to review. These custom queries will work across repositories on the "My pull requests" tab of the collection home page. If you want to come back to a pull request, you can flag it and they will show up at the top of your list. Lastly, pull requests that have been set to auto-complete will be marked with a pill that says 'Auto-complete' in the list.
Pipelines
Multi-stage pipelines
We've been working on an updated user experience to manage your pipelines. These updates make the pipelines experience modern and consistent with the direction of Azure DevOps. Moreover, these updates bring together classic build pipelines and multi-stage YAML pipelines into a single experience. It is mobile-friendly and brings various improvements to how you manage your pipelines. You can drill down and view pipeline details, run details, pipeline analytics, job details, logs, and more.
The following capabilities are included in the new experience:
- viewing and managing multiple stages
- approving pipeline runs
- scroll all the way back in logs while a pipeline is still in progress
- per-branch health of a pipeline.
Continuous deployment in YAML
We’re excited to provide Azure Pipelines YAML CD features. We now offer a unified YAML experience so you can configure each of your pipelines to do CI, CD, or CI and CD together. YAML CD features introduces several new advanced features that are available for all collections using multi-stage YAML pipelines. Some of the highlights include:
- Multi-stage YAML pipelines (for CI and CD)
- Approvals and checks on resources
- Environments and deployment strategies
- Kubernetes and Virtual Machine resources in environment
- Review apps for collaboration
- Refreshed UX for service connections
- Resources in YAML pipelines
If you’re ready to start building, check out the documentation or blog for building multi-stage CI/CD pipelines.
Manage pipeline variables in YAML editor
We updated the experience for managing pipeline variables in the YAML editor. You no longer have to go to the classic editor to add or update variables in your YAML pipelines.
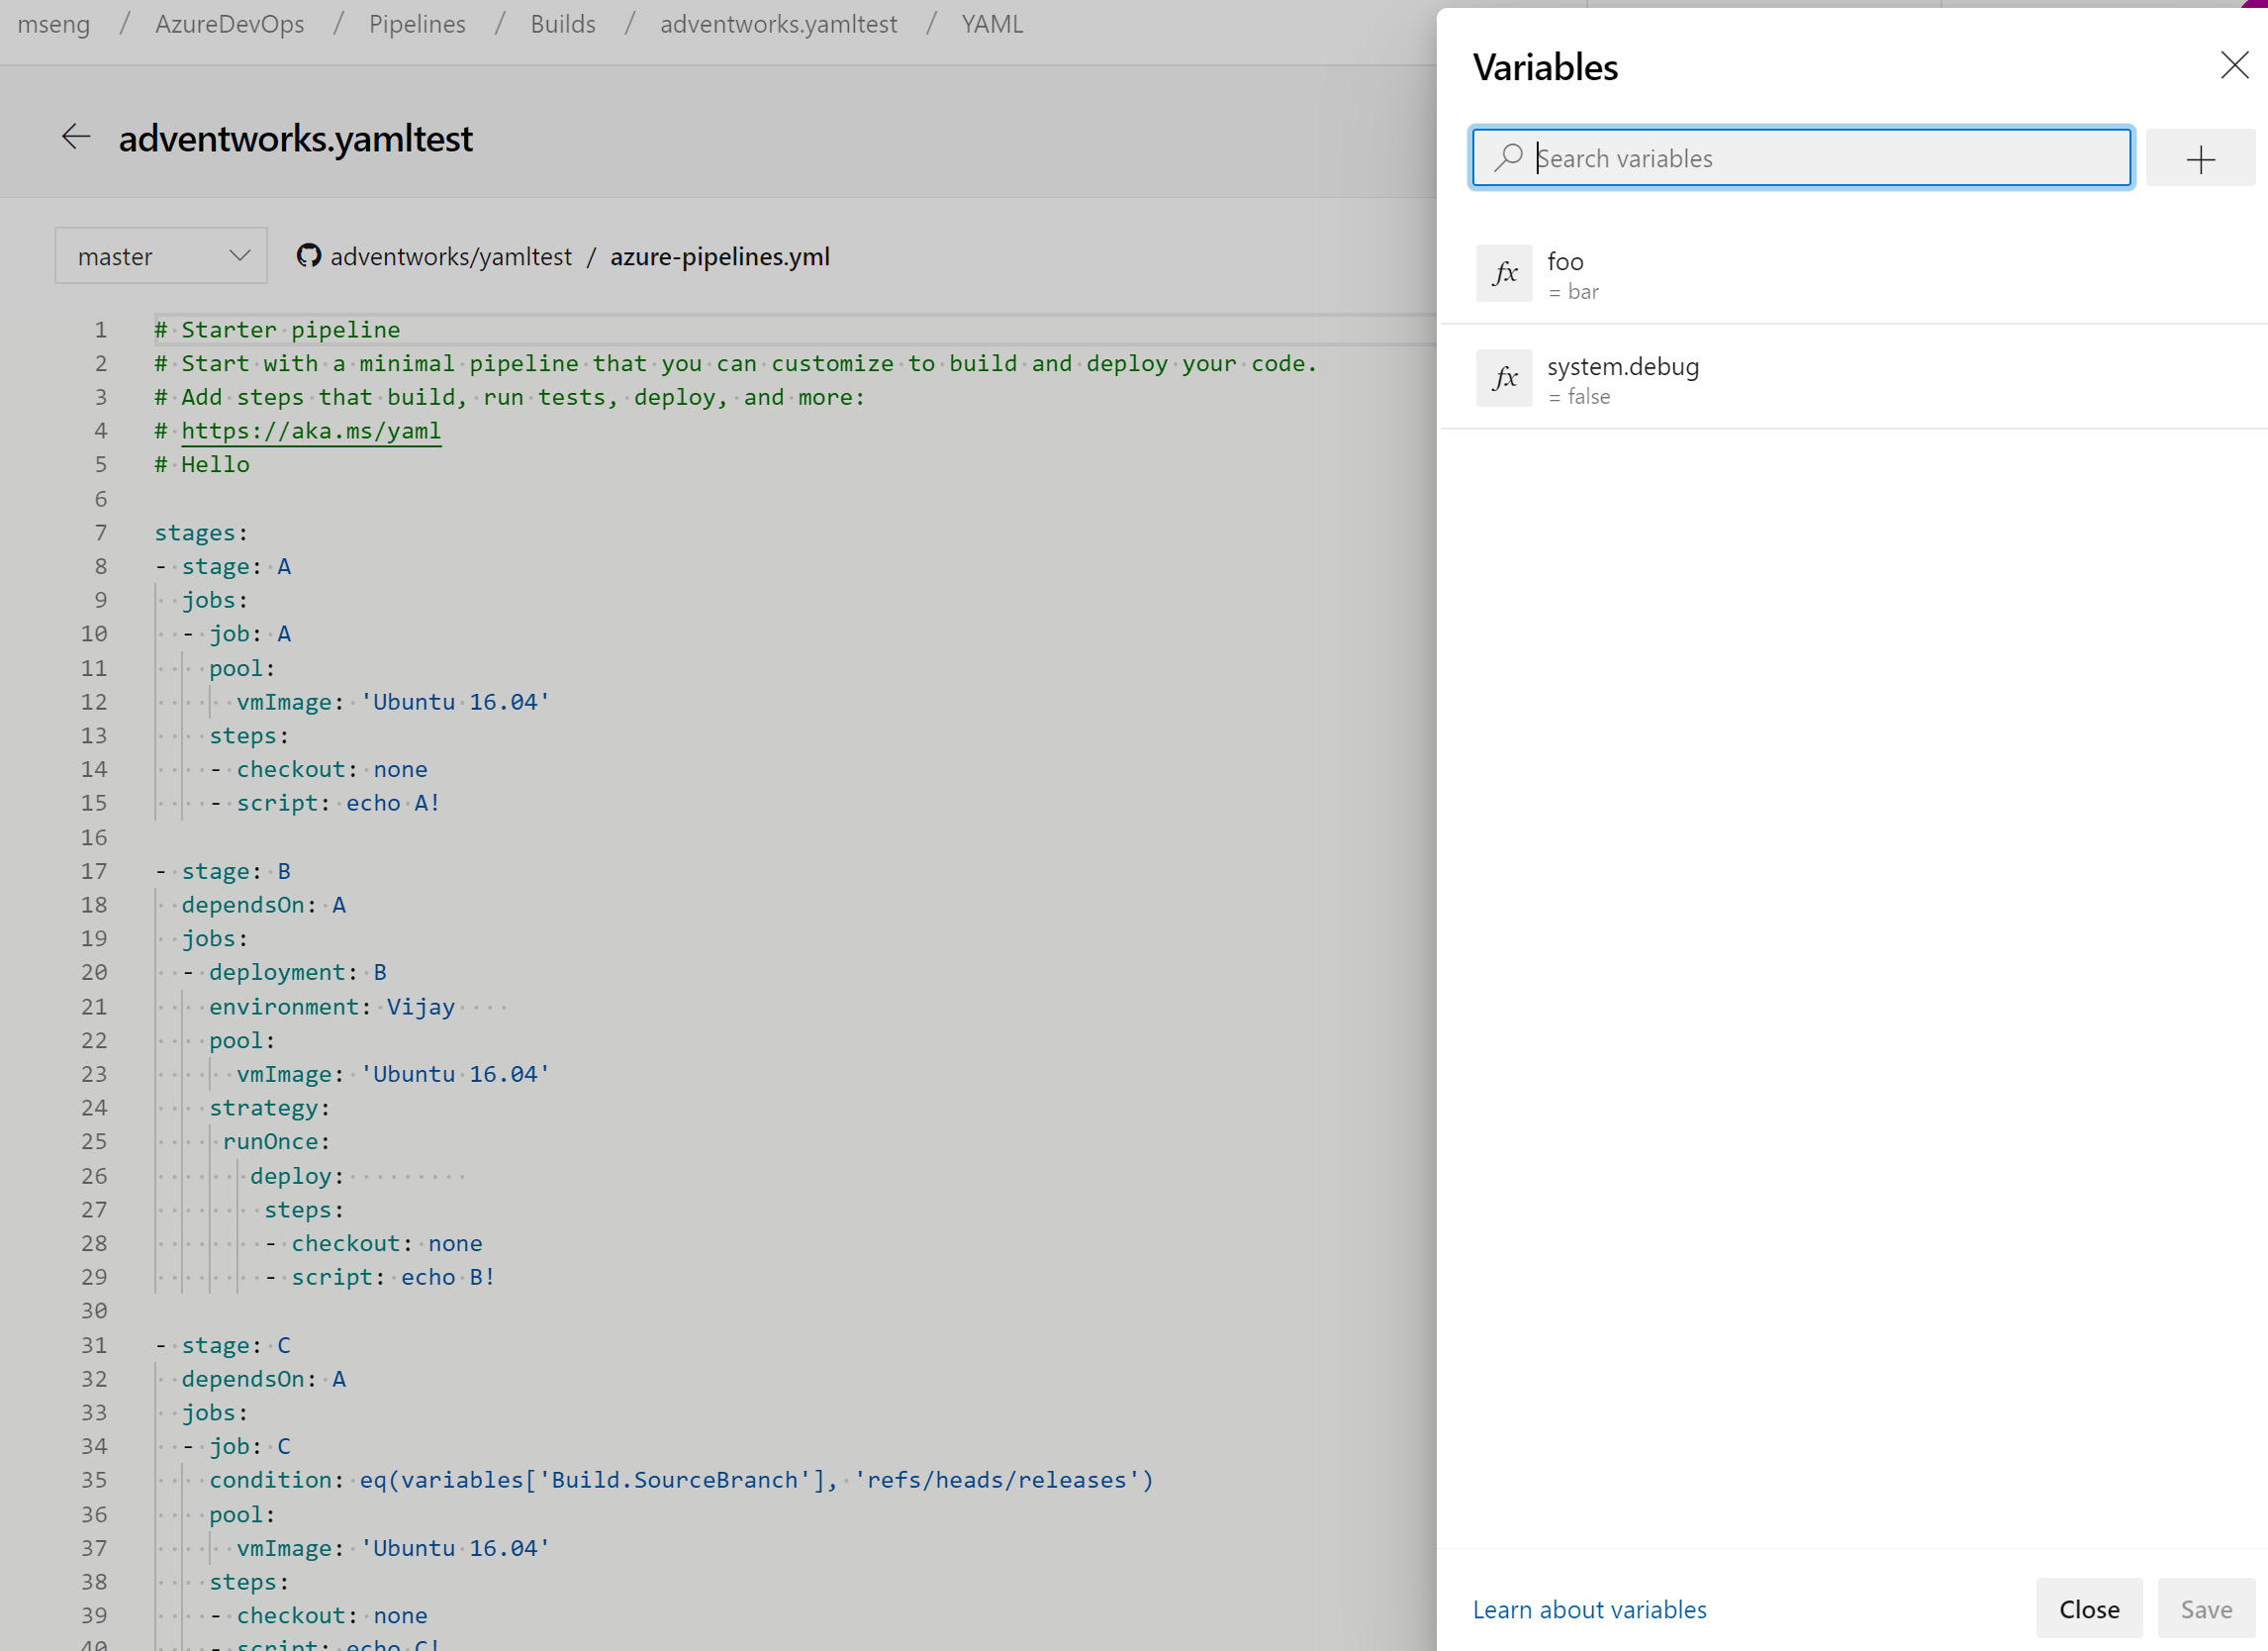
Approve releases directly from Releases hub
Acting on pending approvals has been made easier. Before, it was possible to approve a release from the details page of the release. You may now approve releases directly from the Releases hub.
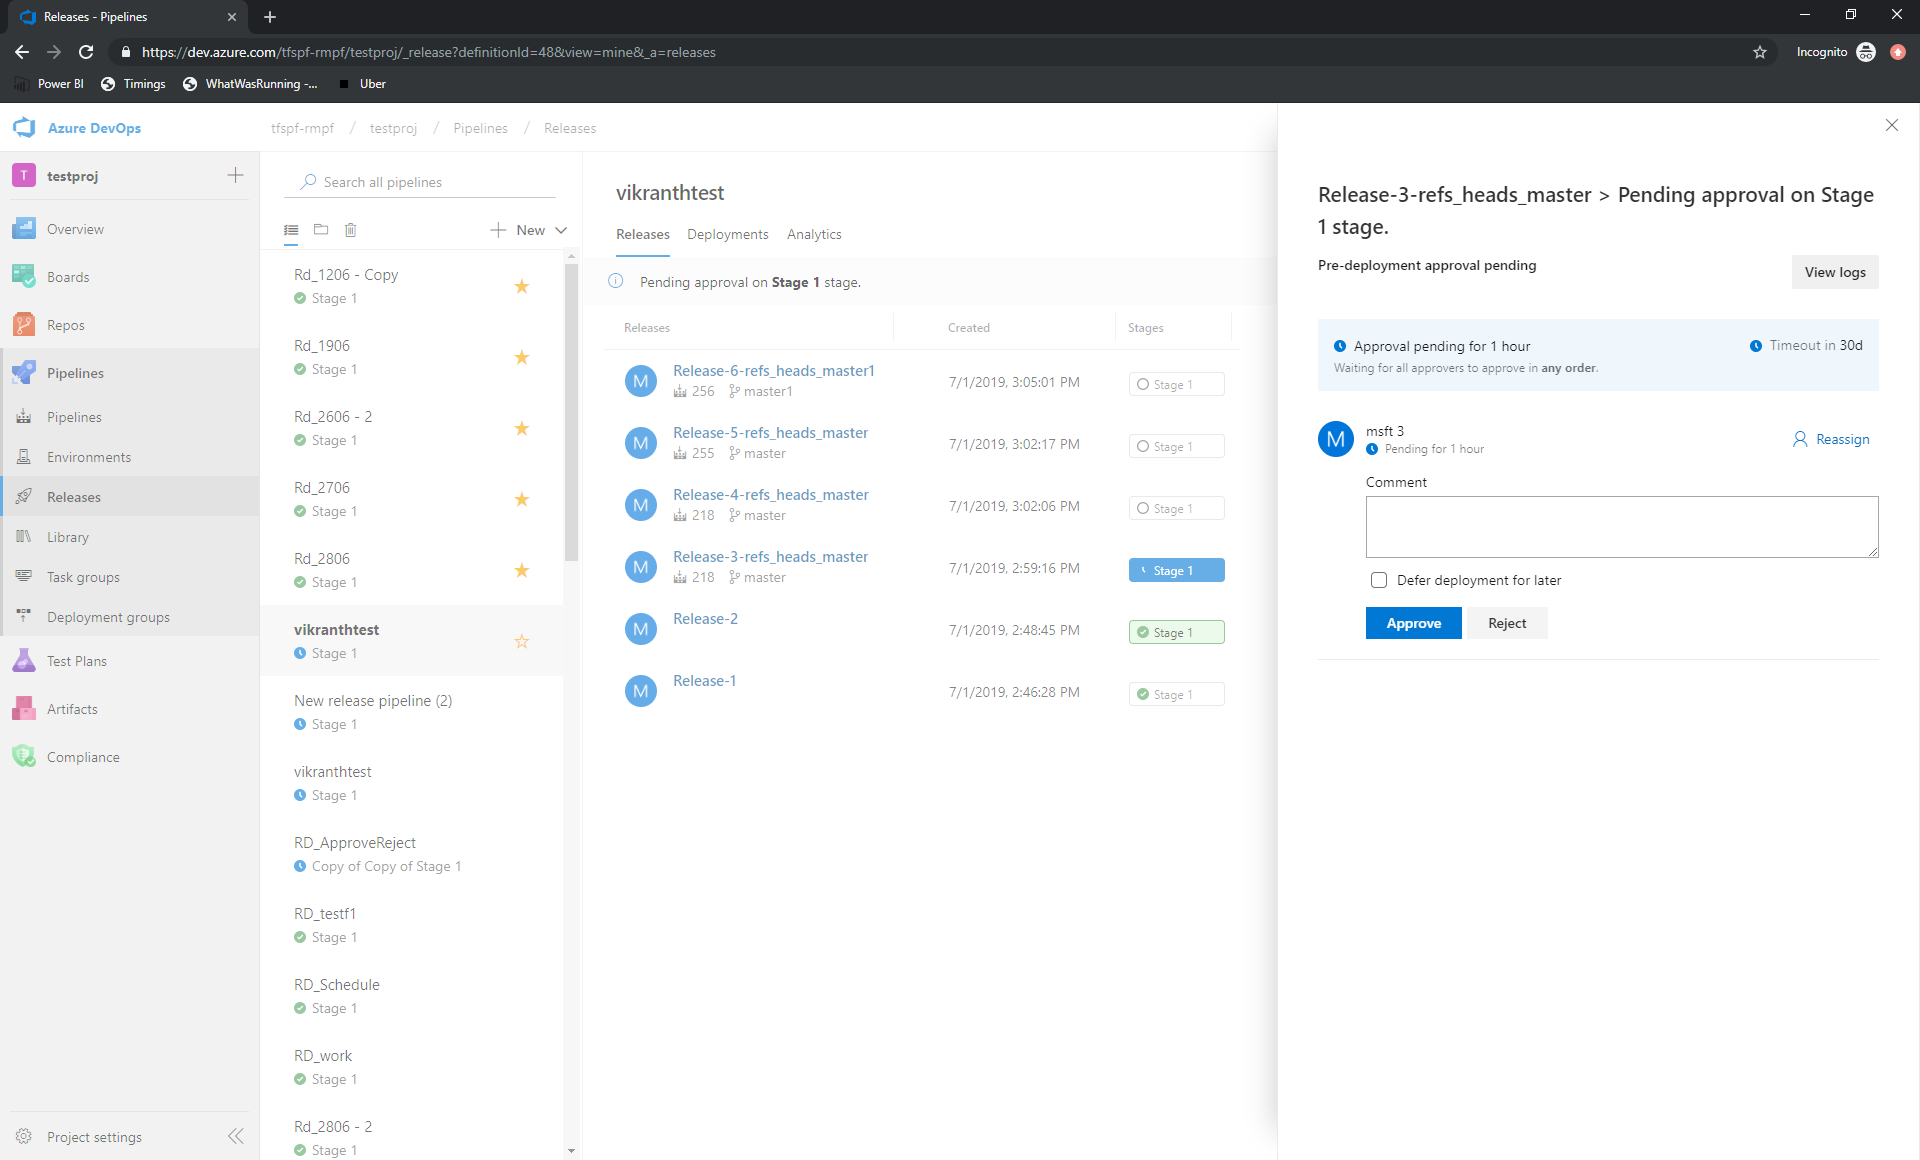
Improvements in getting started with pipelines
A common ask with the getting-started wizard has been the ability to rename the generated file. Currently, it is checked in as azure-pipelines.yml at the root of your repository. You can now update this to a different file name or location before saving the pipeline.
Finally, we you will have more control when checking in the azure-pipelines.yml file to a different branch since you can choose to skip creating a pull request from that branch.
Preview fully parsed YAML document without committing or running the pipeline
We've added a preview but don't run mode for YAML pipelines. Now, you can try out a YAML pipeline without committing it to a repo or running it. Given an existing pipeline and an optional new YAML payload, this new API will give you back the full YAML pipeline. In future updates, this API will be used in a new editor feature.
For developers: POST to dev.azure.com/<org>/<project>/_apis/pipelines/<pipelineId>/runs?api-version=5.1-preview with a JSON body like this:
{
  "PreviewRun": true,
  "YamlOverride": "
# your new YAML here, optionally
"
}
The response will contain the rendered YAML.
Cron schedules in YAML
Previously, you could use the UI editor to specify a scheduled trigger for YAML pipelines. With this release, you can schedule builds using cron syntax in your YAML file and take advantage of the following benefits:
- Config as code: You can track the schedules along with your pipeline as part of code.
- Expressive: You have more expressive power in defining schedules than what you were able to with the UI. For instance, it is easier to specify a single schedule that starts a run every hour.
- Industry standard: Many developers and administrators are already familiar with the cron syntax.
schedules:
- cron: "0 0 * * *"
 displayName: Daily midnight build
 branches:
  include:
  - main
  - releases/*
  exclude:
  - releases/ancient/*
 always: true
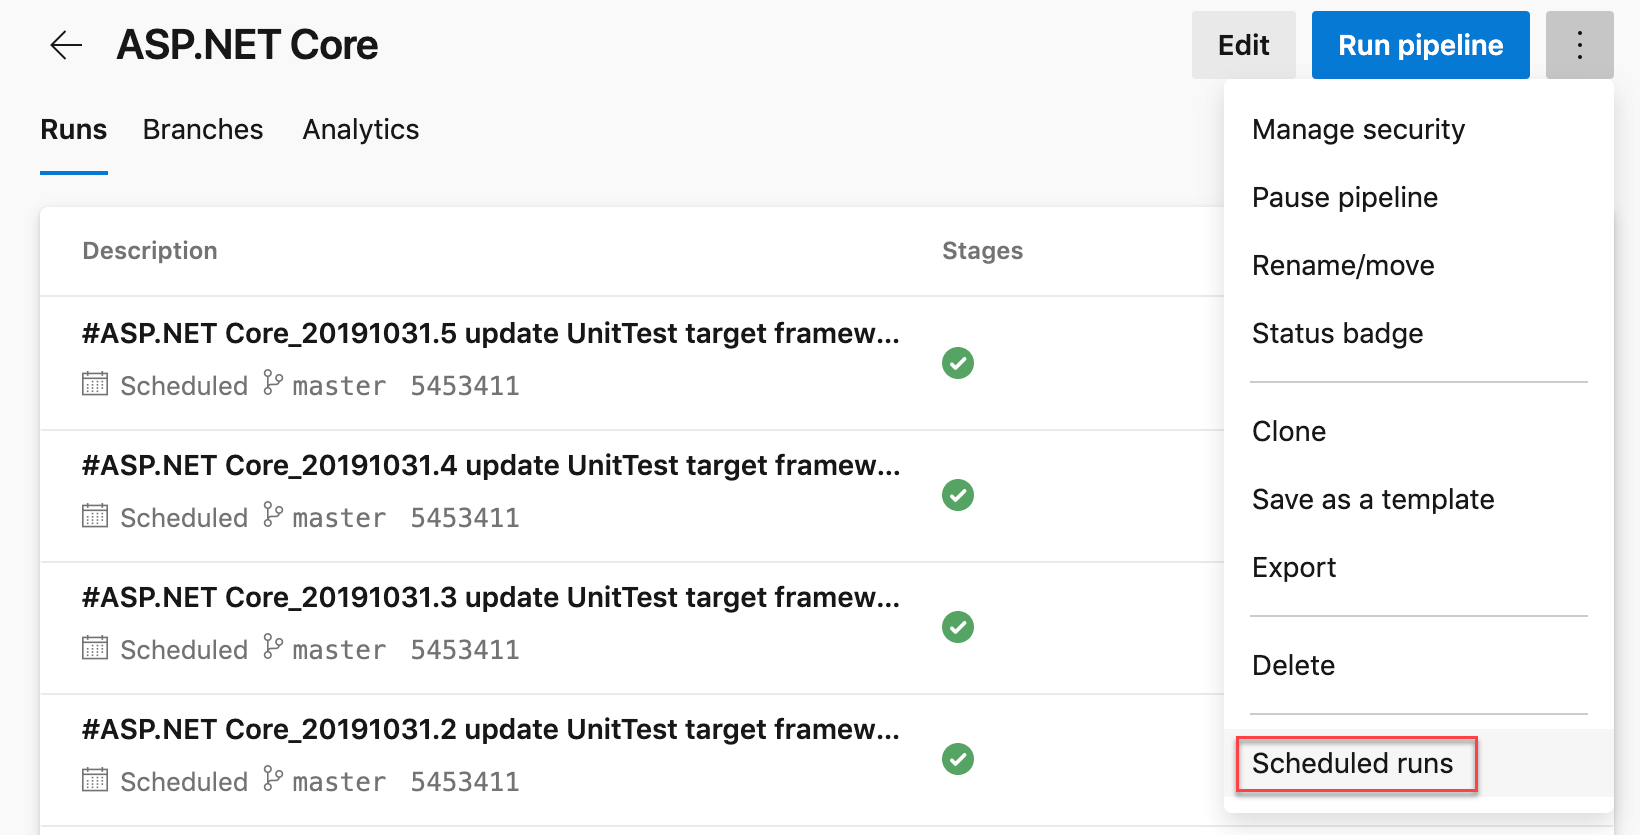
We have also made it easy for you to diagnose problems with cron schedules. The Scheduled runs in the Run pipeline menu will give you a preview of the upcoming few scheduled runs for your pipeline to help you diagnose errors with your cron schedules.
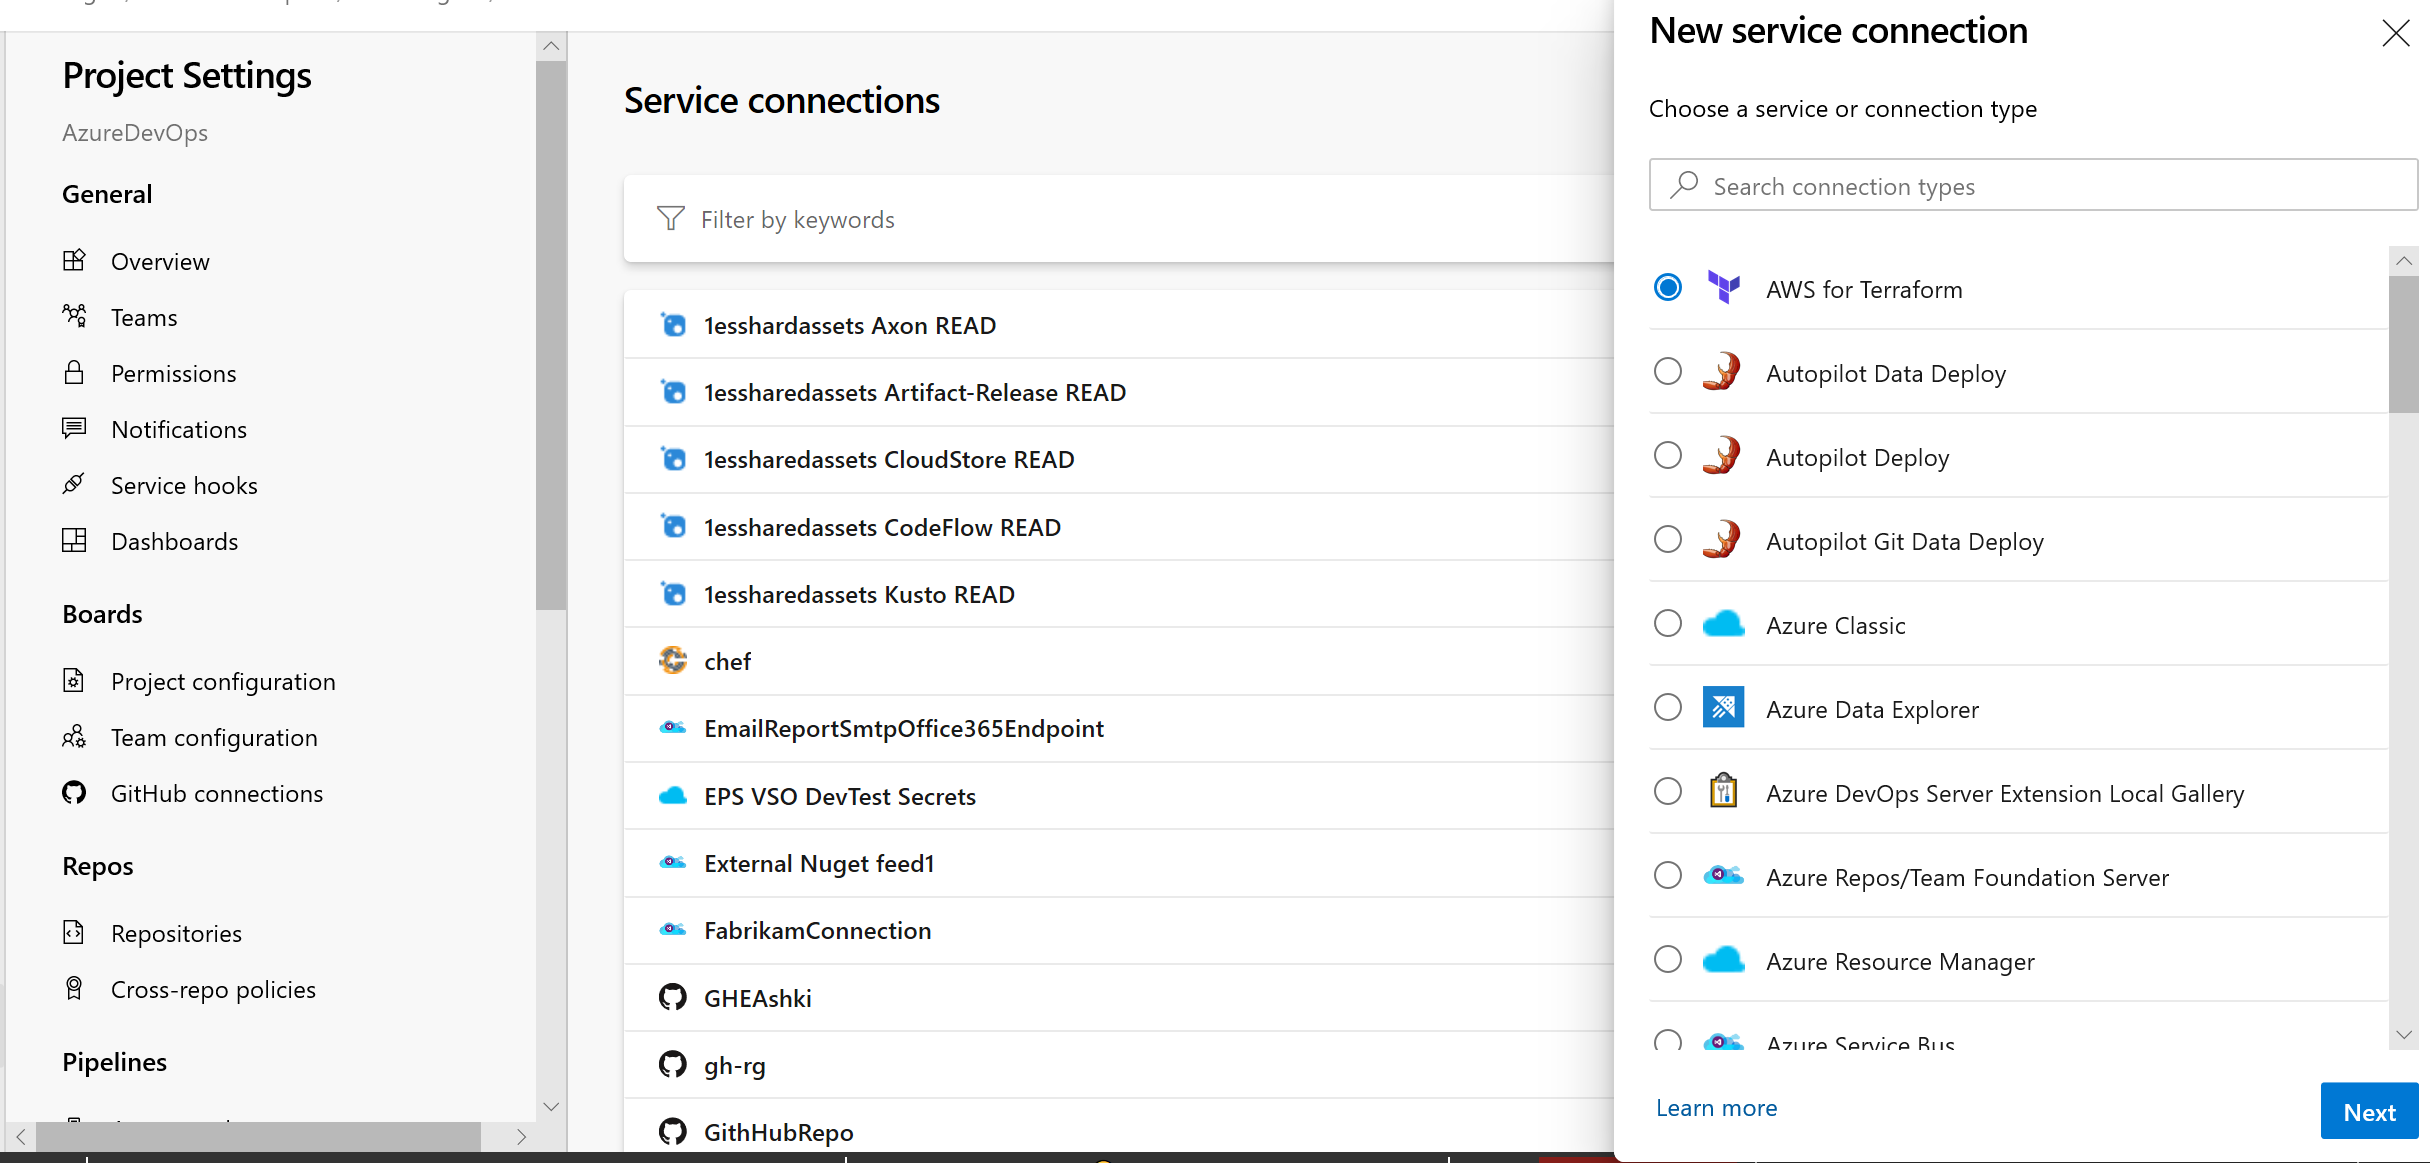
Updates to service connections UI
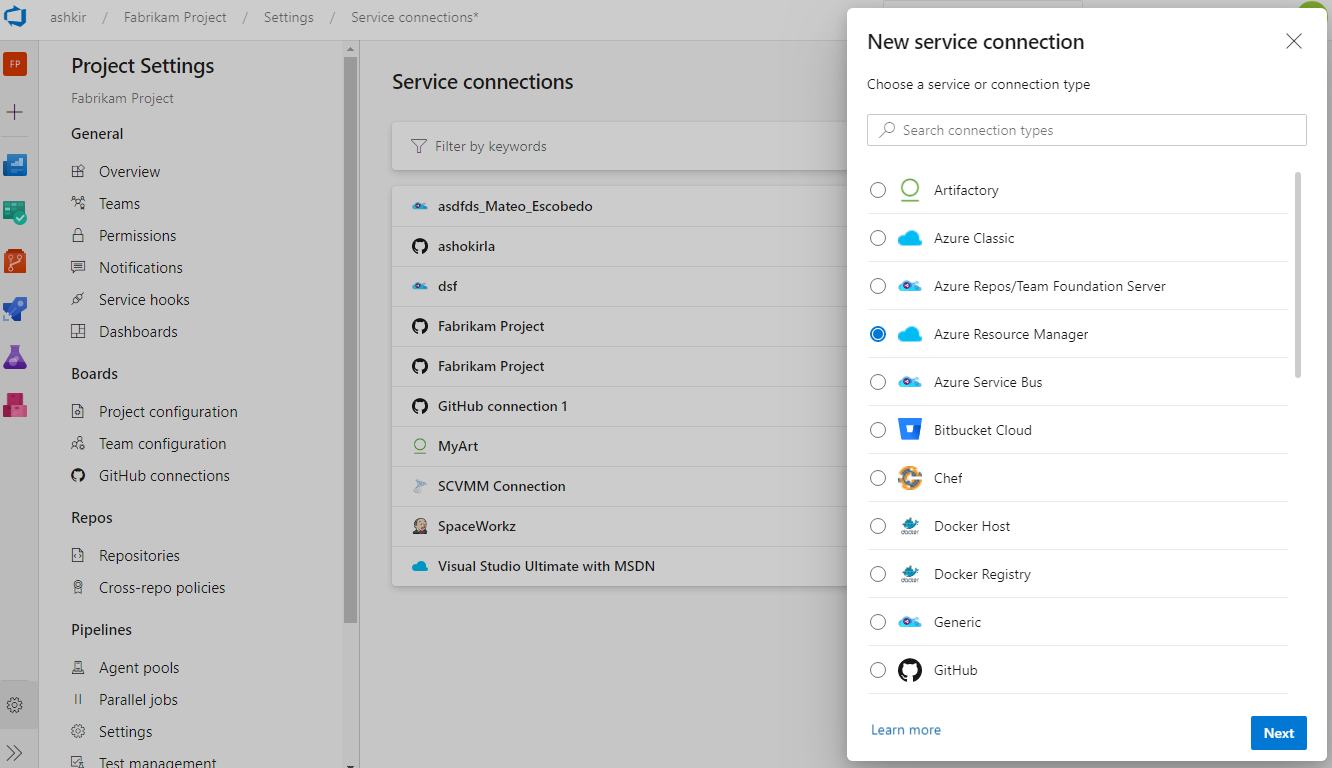
We've been working on an updated user experience to manage your service connections. These updates make the service connection experience modern and consistent with the direction of Azure DevOps. We introduced the new UI for service connections as a preview feature earlier this year. Thanks to everyone who tried the new experience and provided their valuable feedback to us.
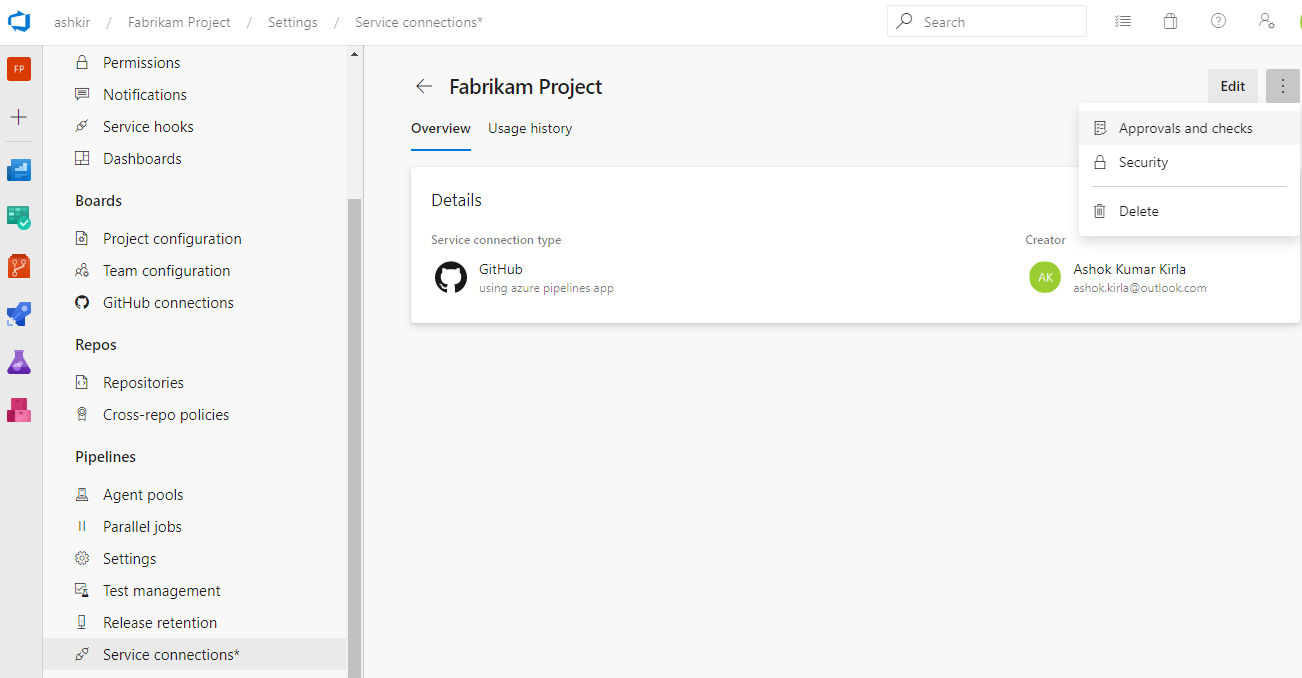
Along with the user experience refresh, we've also added two capabilities which are critical for consuming service connections in YAML pipelines: pipeline authorizations and approvals and checks.
The new user experience will be turned on by default with this update. You will still have the option to opt-out of the preview.
Note
We plan to introduce Cross-project Sharing of Service Connections as a new capability. You can find more details about the sharing experience and the security roles here.
Skipping stages in a YAML pipeline
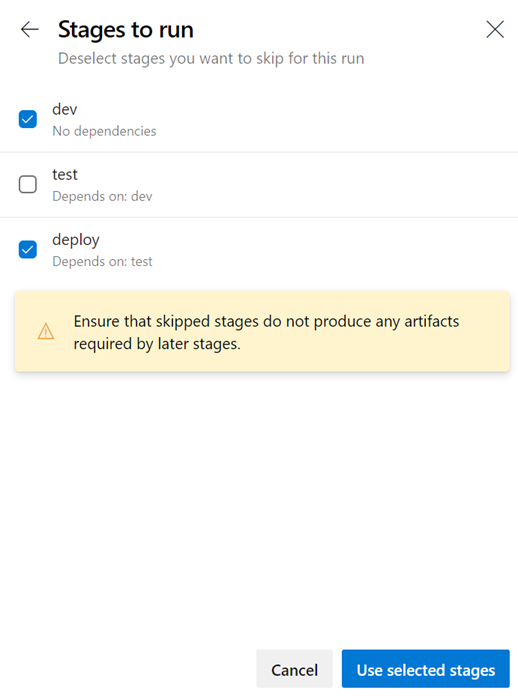
When you start a manual run, you may sometimes want to skip a few stages in your pipeline. For instance, if you do not want to deploy to production, or if you want to skip deploying to a few environments in production. You can now do this with your YAML pipelines.
The updated run pipeline panel presents a list of stages from the YAML file, and you have the option to skip one or more of those stages. You must exercise caution when skipping stages. For instance, if your first stage produces certain artifacts that are needed for subsequent stages, then you should not skip the first stage. The run panel presents a generic warning whenever you skip stages that have downstream dependencies. It is left to you as to whether those dependencies are true artifact dependencies or whether they are just present for sequencing of deployments.
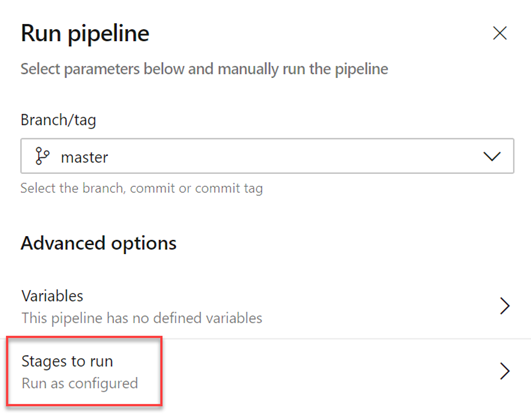
Skipping a stage is equivalent to rewiring the dependencies between stages. Any immediate downstream dependencies of the skipped stage are made to depend on the upstream parent of the skipped stage. If the run fails and if you attempt to rerun a failed stage, that attempt will also have the same skipping behavior. To change which stages are skipped, you have to start a new run.
Service connections new UI as default experience
There is a new service connections UI. This new UI is built on modern design standards and it comes with various critical features to support multi-stage YAML CD pipelines such as approvals, authorizations, and cross-project sharing.
Learn more about service connections here.
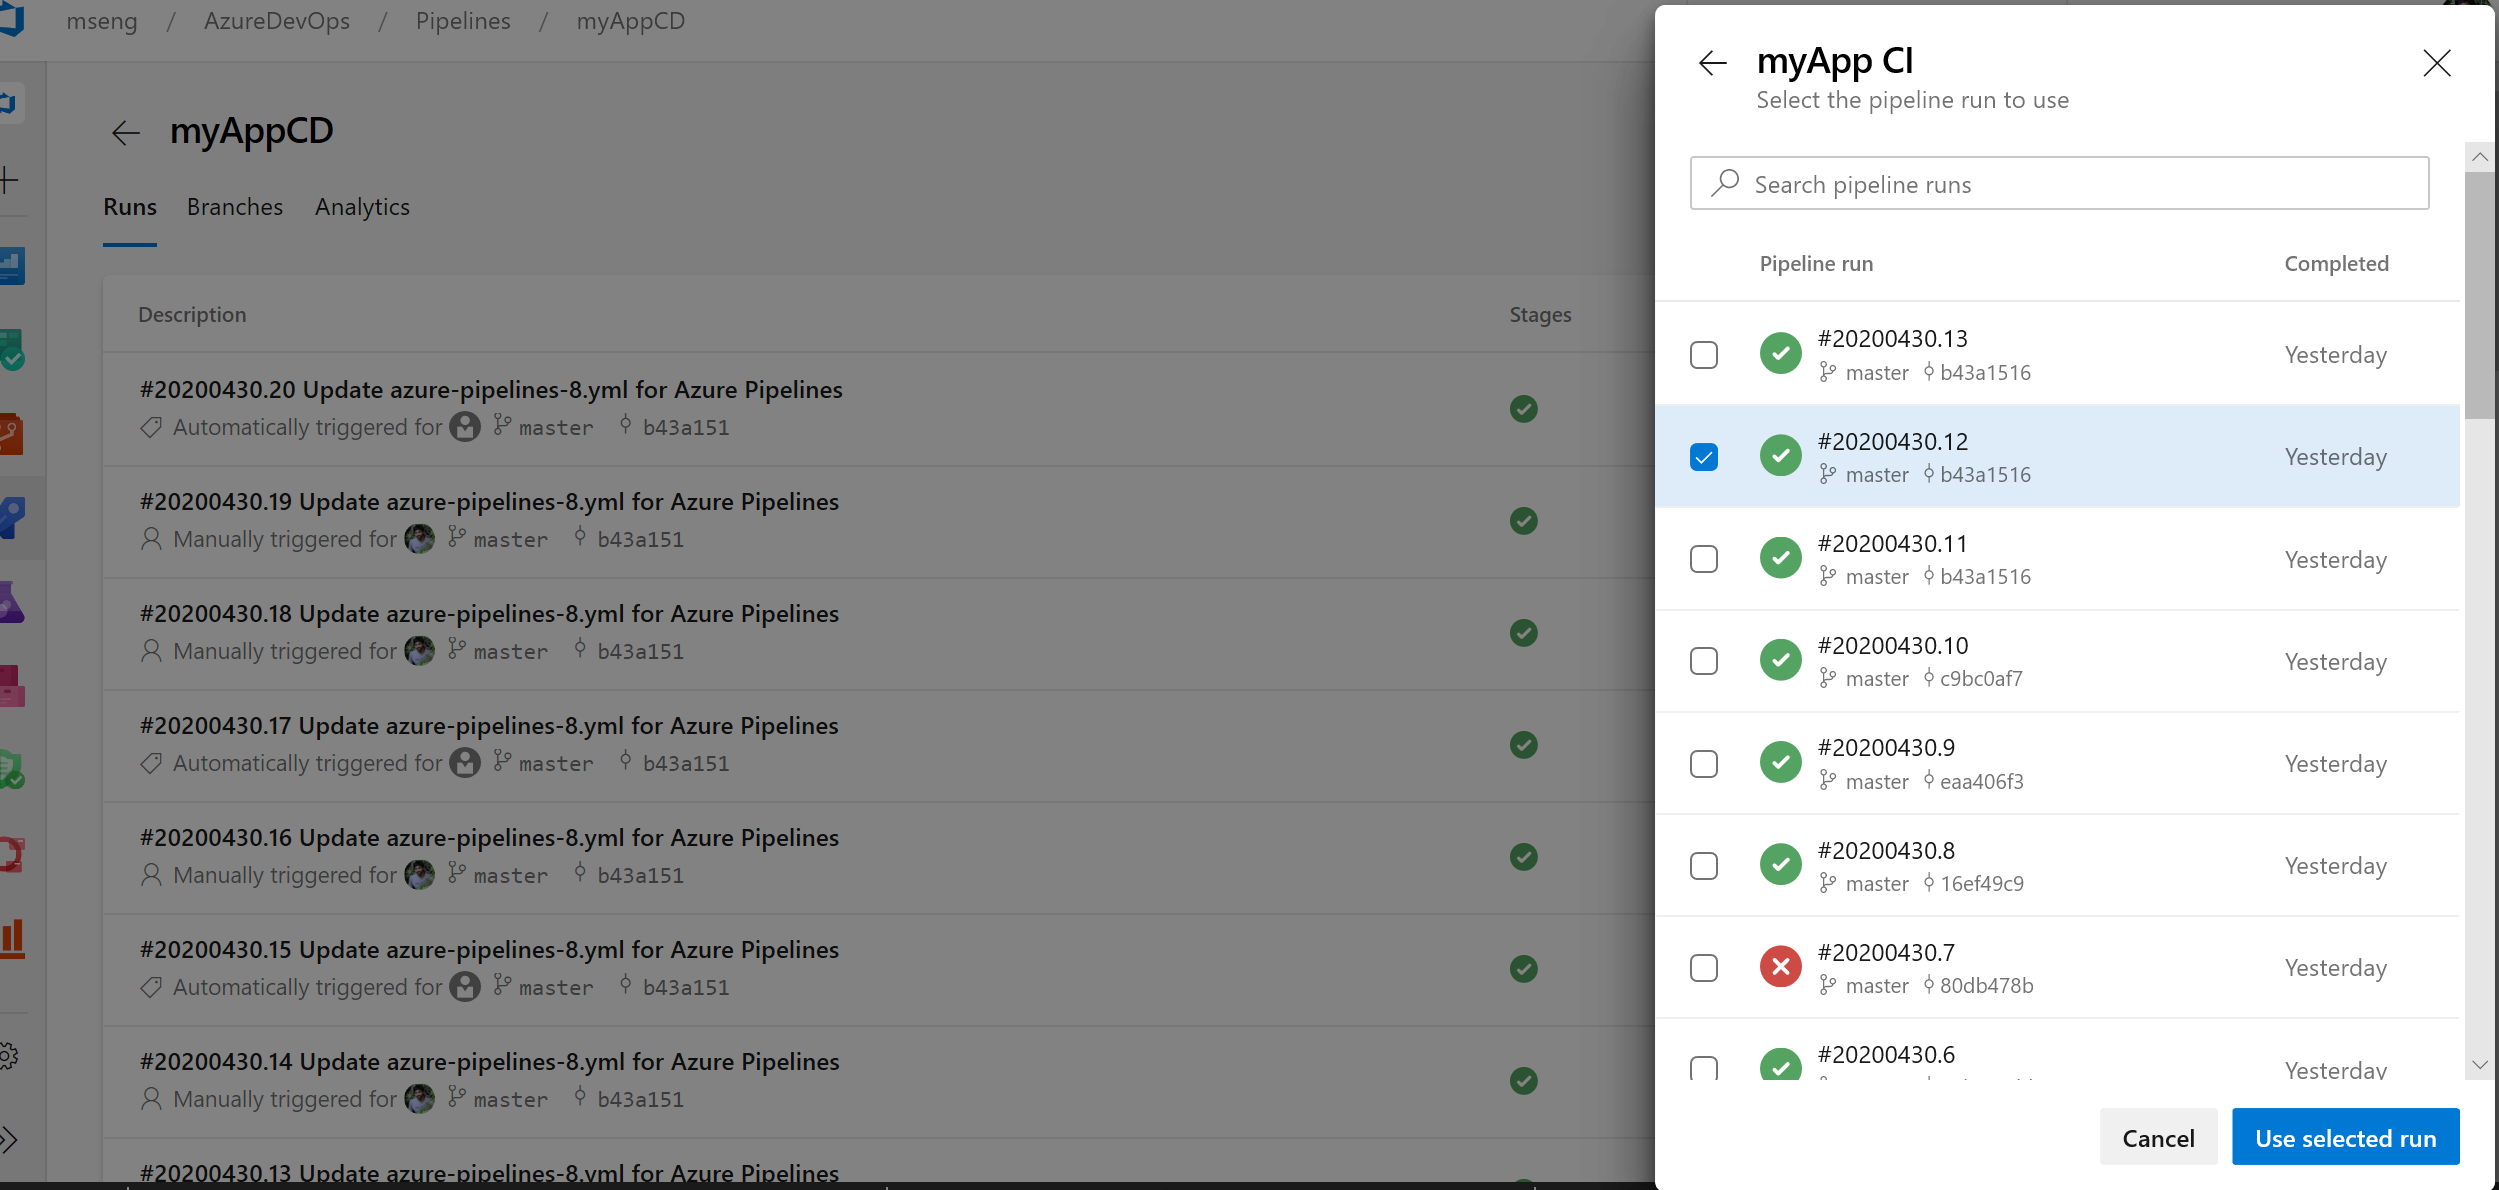
Pipeline resource version picker in the create run dialogue
We added the ability to manually pick up pipeline resource versions in the create run dialogue. If you consume a pipeline as a resource in another pipeline, you can now pick the version of that pipeline when creating a run.
az CLI improvements for Azure Pipelines
Pipeline variable group and variable management commands
It can be challenging to port YAML based pipelines from one project to another as you need to manually set up the pipeline variables and variable groups. However, with the pipeline variable group and variable management commands, you can now script the set up and management of pipeline variables and variable groups which can in turn be version controlled, allowing you to easily share the instructions to move and set up pipelines from one project to another.
Run pipeline for a PR branch
When creating a PR, it can be challenging to validate if the changes might break the pipeline run on the target branch. However, with the capability to trigger a pipeline run or queue a build for a PR branch, you can now validate and visualize the changes going in by running it against the target pipeline. Refer az pipelines run and az pipelines build queue command documentation for more information.
Skip the first pipeline run
When creating pipelines, sometimes you want to create and commit a YAML file and not trigger the pipeline run as it may result in a faulty run due to a variety of reasons - infrastructure is not ready or need to create and update variable/variable groups etc. With Azure DevOps CLI, you can now to skip the first automated pipeline run on creating a pipeline by including the --skip-first-run parameter. Refer az pipeline create command documentation for more information.
Service endpoint command enhancement
Service endpoint CLI commands supported only azure rm and github service endpoint set up and management. However, with this release, service endpoint commands allow you to create any service endpoint by providing the configuration via file and provides optimized commands - az devops service-endpoint github and az devops service-endpoint azurerm, which provide first class support to create service endpoints of these types. Refer the command documentation for more information.
Deployment jobs
A deployment job is a special type of job that is used to deploy your app to an environment. With this update, we have added support for step references in a deployment job. For example, you can define a set of steps in one file and refer to it in a deployment job.
We have also added support for additional properties to the deployment job. For example, here are few properties of a deployment job that you can now set,
- timeoutInMinutes - how long to run the job before automatically cancelling
- cancelTimeoutInMinutes - how much time to give 'run always even if cancelled tasks' before terminating them
- condition - run job conditionally
- variables - Hardcoded values can be added directly, or variable groups, variable group backed by an Azure key vault can be referenced or you can refer to a set of variables defined in a file.
- continueOnError - if future jobs should run even if this deployment job fails; defaults to 'false'
For more details about deployment jobs and the full syntax to specify a deployment job, see Deployment job.
Showing associated CD pipelines info in CI pipelines
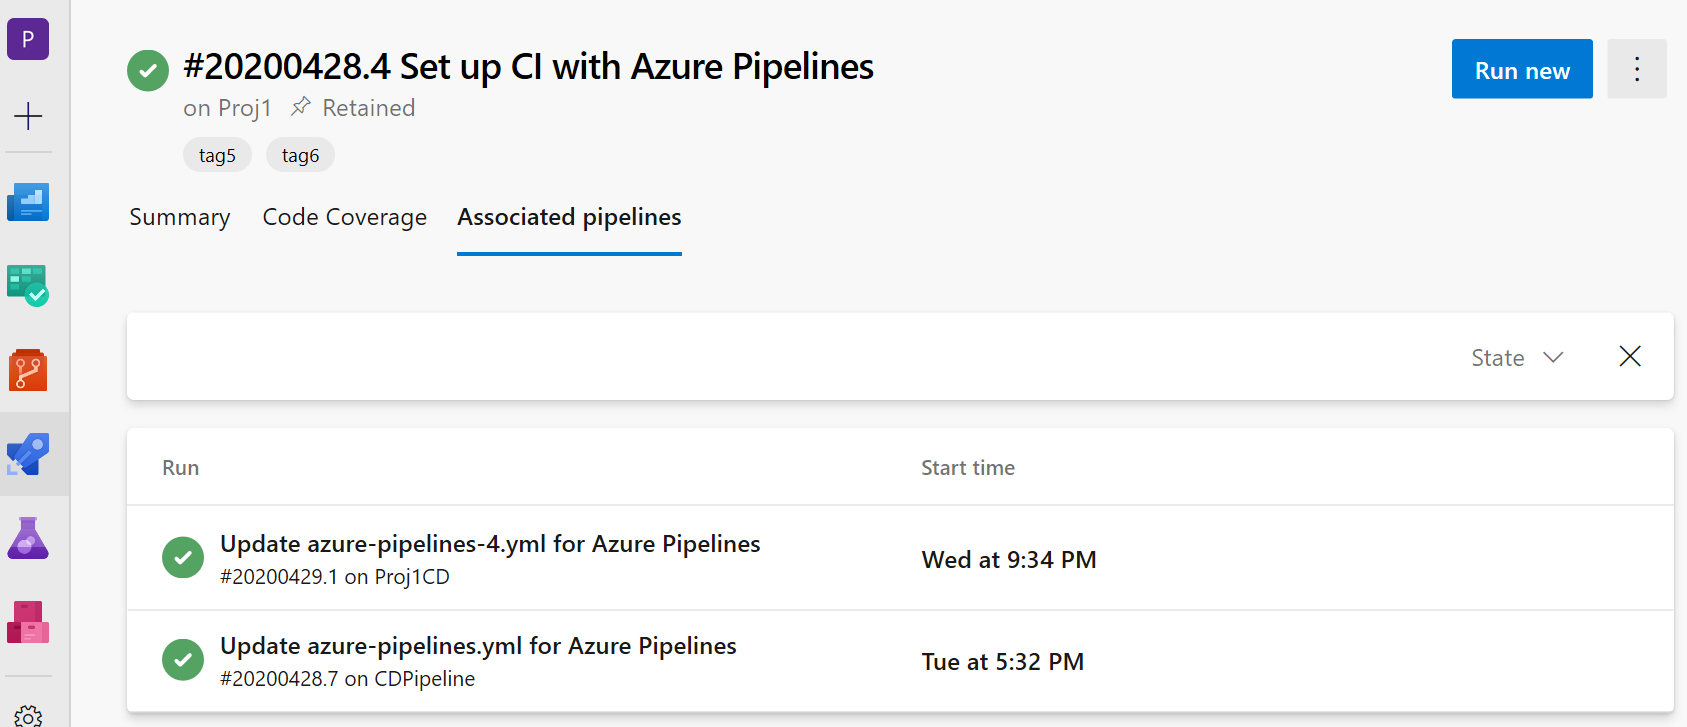
We added support to the CD YAML pipelines details where the CI pipelines are referred to as pipeline resources. In your CI pipeline run view, you will now see a new 'Associated pipelines' tab where you can find all the pipeline runs that consume your pipeline and artifacts from it.
Support for GitHub packages in YAML pipelines
We have recently introduced a new resource type called packages that adds support to consume NuGet and npm packages from GitHub as a resource in YAML pipelines. As part of this resource, you can now specify the package type (NuGet or npm) that you want to consume from GitHub. You can also enable automated pipeline triggers upon the release of a new package version. Today the support is only available for consuming packages from GitHub, but moving forward, we plan to extend the support to consume packages from other package repositories such as NuGet, npm, AzureArtifacts and many more. Refer to the example below for details:
resources:
  packages:
    - package: myPackageAlias # alias for the package resource
      type: Npm # type of the package NuGet/npm
      connection: GitHubConn # Github service connection of type PAT
      name: nugetTest/nodeapp # <Repository>/<Name of the package>
      version: 1.0.9 # Version of the packge to consume; Optional; Defaults to latest
      trigger: true # To enable automated triggers (true/false); Optional; Defaults to no triggers
Note
Today GitHub packages only supports PAT based authentication, which means that the GitHub service connection in the package resource should be of type PAT. Once this limitation is lifted, we will provide support for other types of authentication.
By default, packages are not automatically downloaded in your jobs, hence why we have introduced a getPackage macro that allows you consume the package that is defined in the resource. Refer to the example below for details:
- job: job1
  pool: default
  steps:
    - getPackage: myPackageAlias # Alias of the package resource
Azure Kubernetes Service Cluster link in Kubernetes environments resource view
We added a link to the resource view of Kubernetes environments so you can navigate to the Azure blade for the corresponding cluster. This applies to environments that are mapped to namespaces in Azure Kubernetes Service clusters.

Release folder filters in notification subscriptions
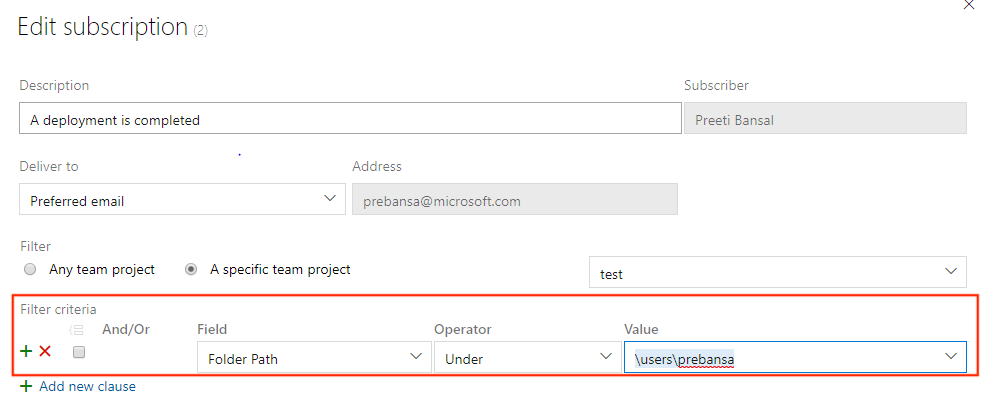
Folders allow organizing pipelines for easier discoverability and security control. Often you may want to configure custom email notifications for all release pipelines, that are represented by all pipelines under a folder. Previously, you had to configure multiple subscriptions or have complex query in the subscriptions to get focused emails. With this update, you can now add a release folder clause to the deployment completed and approval pending events and simplify the subscriptions.
Link work items with multi-stage YAML pipelines
Currently, you can automatically link work items with classic builds. However, this was not possible with YAML pipelines. With this update we have addressed this gap. When you run a pipeline successfully using code from a specified branch, Azure Pipelines will automatically associate the run with all the work items (which are inferred through the commits in that code). When you open the work item, you will be able to see the runs in which the code for that work item was built. To configure this, use the settings panel of a pipeline.
Cancel stage in a multi-stage YAML pipeline run
When running a multi-stage YAML pipeline, you can now cancel the execution of a stage while it is in progress. This is helpful if you know that the stage is going to fail or if you have another run that you want to start.
Retry failed stages
One of the most requested features in multi-stage pipelines is the ability to retry a failed stage without having to start from the beginning. With this update, we are adding a big portion of this functionality.
You can now retry a pipeline stage when the execution fails. Any jobs that failed in the first attempt and those that depend transitively on those failed jobs are all re-attempted.
This can help you save time in several ways. For instance, when you run multiple jobs in a stage, you might want each stage to run tests on a different platform. If the tests on one platform fail while others pass, you can save time by not re-running the jobs that passed. As another example, a deployment stage may have failed due to flaky network connection. Retrying that stage will help you save time by not having to produce another build.
There are a few known gaps in this feature. For example, you cannot retry a stage that you explicitly cancel. We are working to close these gaps in future updates.
Approvals in multi-stage YAML pipelines
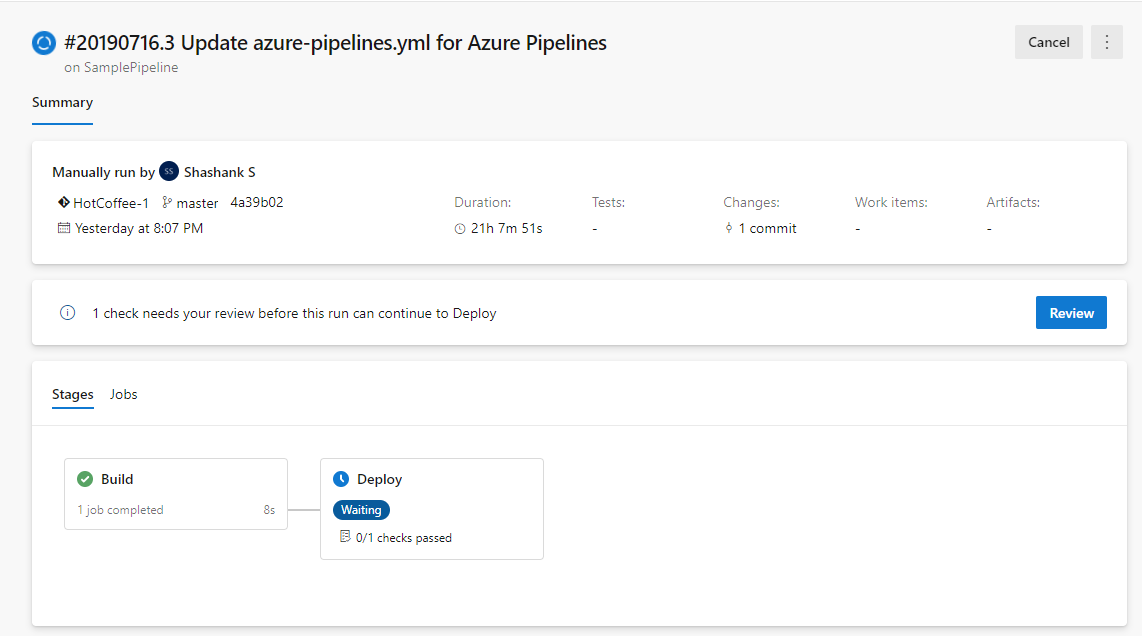
Your YAML CD pipelines may contain manual approvals. Infrastructure owners can protect their environments and seek manual approvals before a stage in any pipeline deploys to them. With complete segregation of roles between infrastructure (environment) and application (pipeline) owners, you will ensure manual sign off for deployment in a particular pipeline and get central control in applying the same checks across all deployments to the environment.

The pipeline runs deploying to dev will stop for approval at the start of the stage.
Increase in gates timeout limit and frequency
Previously, the gate timeout limit in release pipelines was three days. With this update, the timeout limit has been increased to 15 days to allow gates with longer durations. We also increased the frequency of the gate to 30 minutes.
New build image template for Dockerfile
Previously, when creating a new pipeline for a Dockerfile in new pipeline creation, the template recommended pushing the image to an Azure Container Registry and deploying to an Azure Kubernetes Service. We added a new template to let you build an image using the agent without the need to push to a container registry.

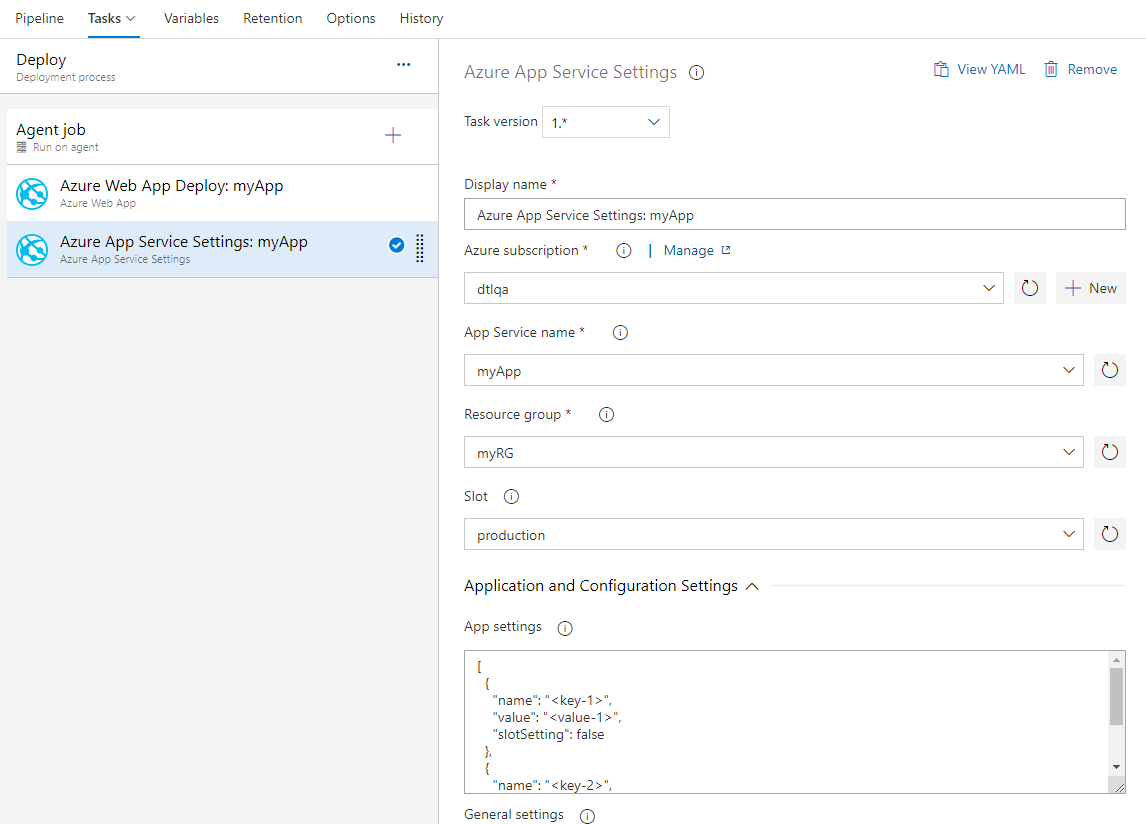
New task for configuring Azure App Service app settings
Azure App Service allows configuration through various settings like app settings, connection strings and other general configuration settings. We now have a new Azure Pipelines task Azure App Service Settings which supports configuring these settings in bulk using JSON syntax on your web app or any of its deployment slots. This task can be used along with other App service tasks to deploy, manage and configure your Web apps, Function apps or any other containerized App Services.
Azure App Service now supports Swap with preview
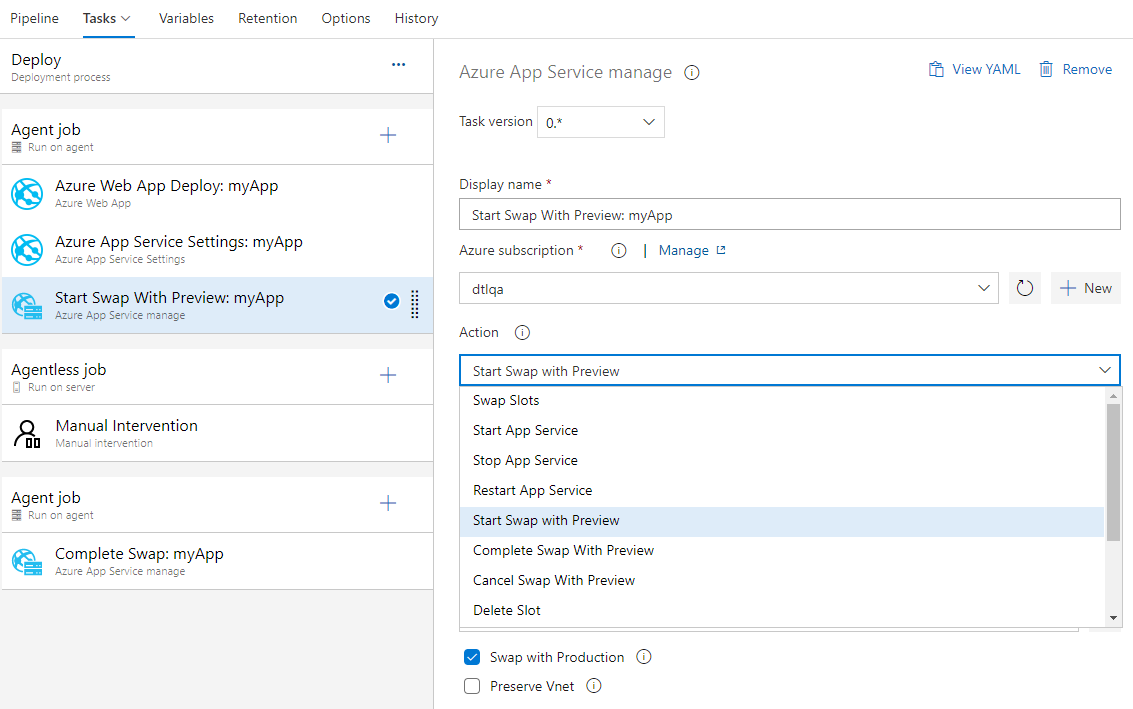
Azure App Service now supports Swap with preview on its deployment slots. This is a good way to validate the app with production configuration before the app is actually swapped from a staging slot into production slot. This would also ensure that the target/production slot doesn't experience downtime.
Azure App Service task now supports this multi-phase swap through the following new actions:
- Start Swap with Preview - Initiates a swap with a preview (multi-phase swap) and applies target slot (for example, the production slot) configuration to the source slot.
- Complete Swap with Preview - When you're ready to complete the pending swap, select the Complete Swap with Preview action.
- Cancel Swap with Preview - To cancel a pending swap, select Cancel Swap with Preview.
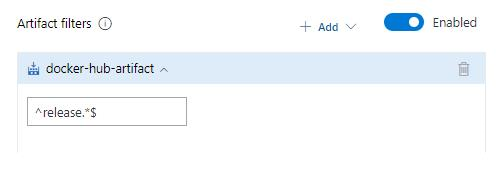
Stage level filter for Azure Container Registry and Docker Hub artifacts
Previously, regular expression filters for Azure Container Registry and Docker Hub artifacts were only available at the release pipeline level. They have now been added at the stage level as well.
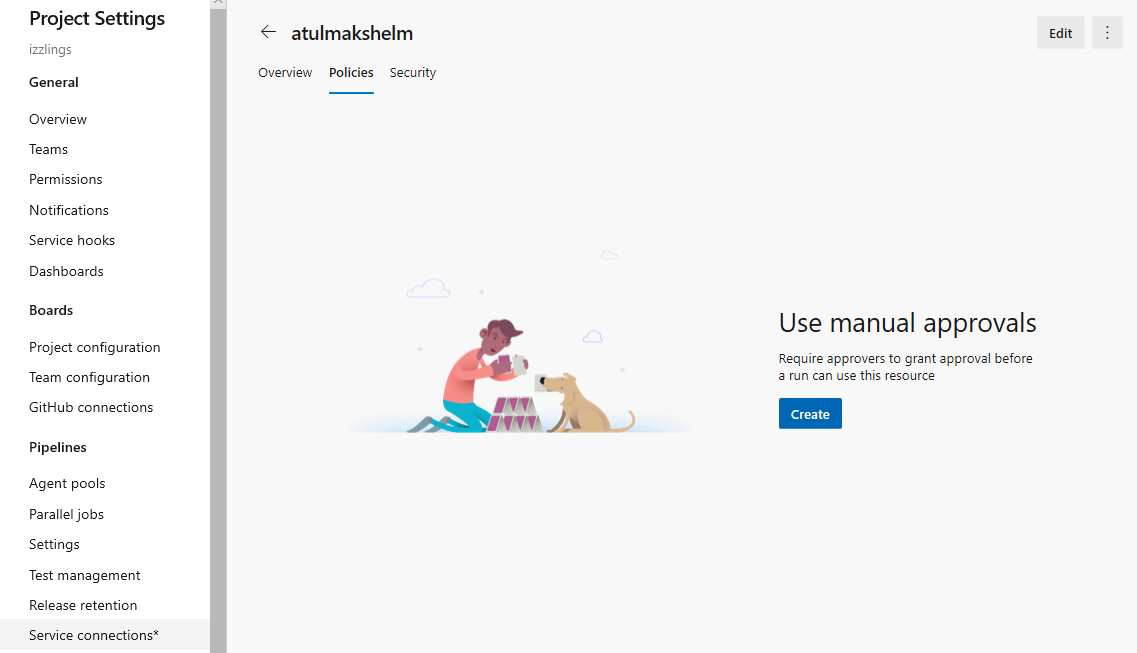
Enhancements to approvals in YAML pipelines
We have enabled configuring approvals on service connections and agent pools. For approvals we follow segregation of roles between infrastructure owners and developers. By configuring approvals on your resources such as environments, service connections and agent pools, you will be assured that all pipeline runs that use resources will require approval first.
The experience is similar to configuring approvals for environments. When an approval is pending on a resource referenced in a stage, the execution of the pipeline waits until the pipeline is manually approved.
Container structure testing support in Azure Pipelines
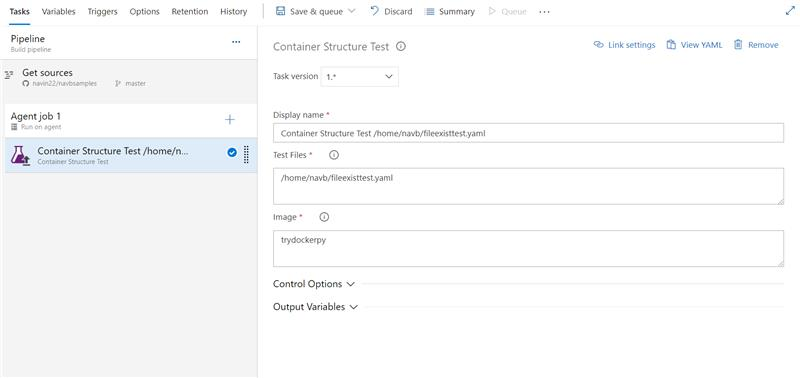
Usage of containers in applications is increasing and thus the need for robust testing and validation. Azure Pipelines now brings supports for Container Structure Tests. This framework provides a convenient and powerful way to verify the contents and structure of your containers.
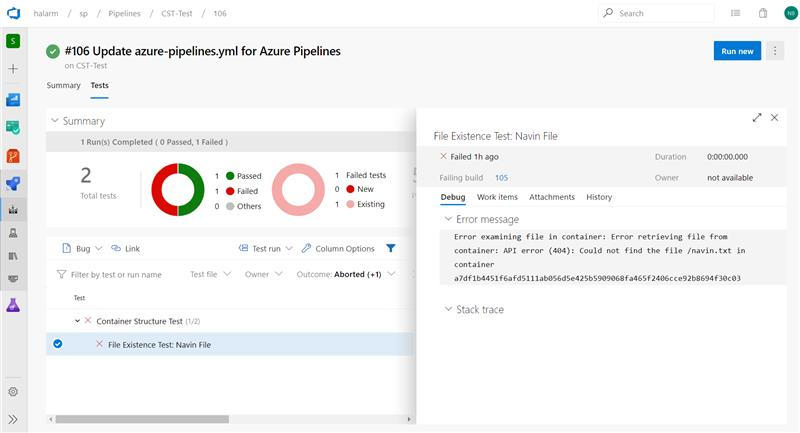
You can validate the structure of an image based on four categories of tests which can be run together: command tests, file existence tests, file content tests and metadata tests. You can use the results in the pipeline to make go/no go decisions. Test data is available in the pipeline run with an error message to help you better troubleshoot failures.
Input the config file and image details
Test data and summary
Pipeline decorators for release pipelines
Pipeline decorators allow for adding steps to the beginning and end of every job. This is different than adding steps to a single definition because it applies to all pipelines in an collection.
We have been supporting decorators for builds and YAML pipelines, with customers using them to centrally control the steps in their jobs. We are now extending the support to release pipelines as well. You can create extensions to add steps targeting the new contribution point and they will be added to all agent jobs in release pipelines.
Deploy Azure Resource Manager (ARM) to subscription and management group level
Previously, we supported deployments only to the Resource Group level. With this update we have added support to deploy ARM templates to both the subscription and management group levels. This will help you when deploying a set of resources together but place them in different resource groups or subscriptions. For example, deploying the backup virtual machine for Azure Site Recovery to a separate resource group and location.
CD capabilities for your multi-stage YAML pipelines
You can now consume artifacts published by your CI pipeline and enable pipeline completion triggers. In multi-stage YAML pipelines, we are introducing pipelines as a resource. In your YAML, you can now refer to another pipeline and also enable CD triggers.
Here is the detailed YAML schema for pipelines resource.
resources:
  pipelines:
  - pipeline: MyAppCI  # identifier for the pipeline resource
    project:  DevOpsProject # project for the build pipeline; optional input for current project
    source: MyCIPipeline  # source pipeline definition name
    branch: releases/M159  # branch to pick the artifact, optional; defaults to all branches
    version: 20190718.2 # pipeline run number to pick artifact; optional; defaults to last successfully completed run
    trigger:     # Optional; Triggers are not enabled by default.
      branches:
        include:  # branches to consider the trigger events, optional; defaults to all branches.
        - main
        - releases/*
        exclude:   # branches to discard the trigger events, optional; defaults to none.
        - users/*
In addition, you can download the artifacts published by your pipeline resource using the - download task.
steps:
- download: MyAppCI  # pipeline resource identifier
    artifact:  A1 # name of the artifact to download; optional; defaults to all artifacts
For more details, see the downloading artifacts documentation here.
Orchestrate canary deployment strategy on environment for Kubernetes
One of the key advantages of continuous delivery of application updates is the ability to quickly push updates into production for specific microservices. This gives you the ability to quickly respond to changes in business requirements. Environment was introduced as a first-class concept enabling orchestration of deployment strategies and facilitating zero downtime releases. Previously, we supported the runOnce strategy which executed the steps once sequentially. With support for canary strategy in multi-stage pipelines, you can now reduce the risk by slowly rolling out the change to a small subset. As you gain more confidence in the new version, you can start rolling it out to more servers in your infrastructure and route more users to it.
jobs:
- deployment:
  environment: musicCarnivalProd
  pool:
    name: musicCarnivalProdPool
  strategy:
    canary:
      increments: [10,20]
      preDeploy:
        steps:
        - script: initialize, cleanup....
      deploy:
        steps:
        - script: echo deploy updates...
        - task: KubernetesManifest@0
          inputs:
            action: $(strategy.action)
            namespace: 'default'
            strategy: $(strategy.name)
            percentage: $(strategy.increment)
            manifests: 'manifest.yml'
      postRouteTaffic:
        pool: server
        steps:
        - script: echo monitor application health...
      on:
        failure:
          steps:
	  - script: echo clean-up, rollback...
        success:
          steps:
          - script: echo checks passed, notify...
The canary strategy for Kuberenetes will first deploy the changes with 10% pods followed by 20% while monitoring the health during postRouteTraffic. If all goes well, it will promote to 100%.
We are looking for early feedback on support for VM resource in environments and performing rolling deployment strategy across multiple machines. Contact us to enroll.
Approval policies for YAML pipelines
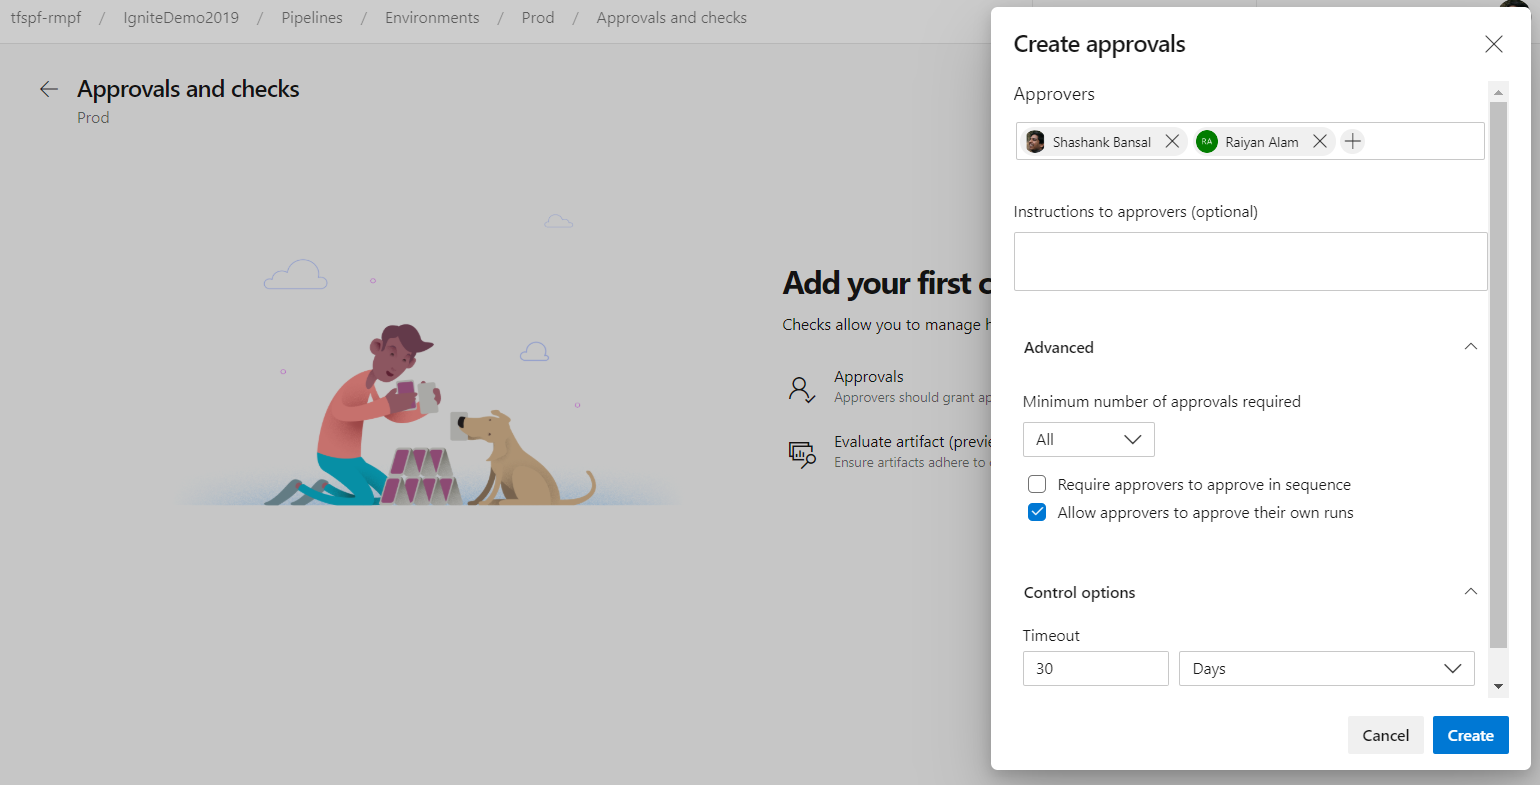
In YAML pipelines, we follow a resource owner-controlled approval configuration. Resource owners configure approvals on the resource and all pipelines that use the resource pause for approvals before start of the stage consuming the resource. It is common for SOX based application owners to restrict the requester of the deployment from approving their own deployments.
You can now use advanced approval options to configure approval policies like requester should not approve, require approval from a subset of users and approval timeout.
ACR as a first-class pipeline resource
If you need to consume a container image published to ACR (Azure Container Registry) as part of your pipeline and trigger your pipeline whenever a new image got published, you can use ACR container resource.
resources:
  containers:
  - container: MyACR  #container resource alias
    type: ACR
    azureSubscription: RMPM  #ARM service connection
    resourceGroup: contosoRG
    registry: contosodemo
    repository: alphaworkz
    trigger:
      tags:
        include:
        - production
Moreover, ACR image meta-data can be accessed using predefined variables. The following list includes the ACR variables available to define an ACR container resource in your pipeline.
resources.container.<Alias>.type
resources.container.<Alias>.registry
resources.container.<Alias>.repository
resources.container.<Alias>.tag
resources.container.<Alias>.digest
resources.container.<Alias>.URI
resources.container.<Alias>.location
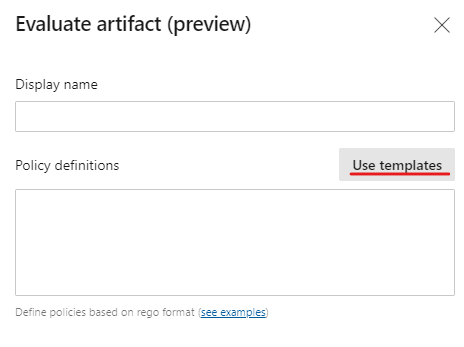
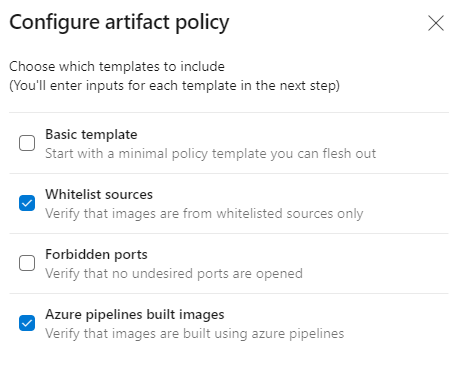
Enhancements to evaluate artifacts checks policy in pipelines
We've enhanced the evaluate artifact check to make it easier to add policies from a list of out of the box policy definitions. The policy definition will be generated automatically and added to the check configuration which can be updated if needed.
Support for output variables in a deployment job
You can now define output variables in a deployment job's lifecycle hooks and consume them in other downstream steps and jobs within the same stage.
While executing deployment strategies, you can access output variables across jobs using the following syntax.
- For runOnce strategy:
$[dependencies.<job-name>.outputs['<lifecycle-hookname>.<step-name>.<variable-name>']] - For canary strategy:
$[dependencies.<job-name>.outputs['<lifecycle-hookname>_<increment-value>.<step-name>.<variable-name>']] - For rolling strategy :
$[dependencies.<job-name>.outputs['<lifecycle-hookname>_<resource-name>.<step-name>.<variable-name>']]
// Set an output variable in a lifecycle hook of a deployment job executing canary strategy
- deployment: A
  pool:
    vmImage: 'ubuntu-16.04'
  environment: staging
  strategy:
    canary:
      increments: [10,20]  # creates multiple jobs, one for each increment. Output variable can be referenced with this.
      deploy:
        steps:
        - script: echo "##vso[task.setvariable variable=myOutputVar;isOutput=true]this is the deployment variable value"
          name: setvarStep
        - script: echo $(setvarStep.myOutputVar)
          name: echovar

 // Map the variable from the job
- job: B
  dependsOn: A
  pool:
    vmImage: 'ubuntu-16.04'
  variables:
    myVarFromDeploymentJob: $[ dependencies.A.outputs['deploy_10.setvarStep.myOutputVar'] ]
  steps:
  - script: "echo $(myVarFromDeploymentJob)"
    name: echovar
Learn more on how to set a multi-job output variable
Avoid rollback of critical changes
In classic release pipelines, it is common to rely on scheduled deployments for regular updates. But, when you have a critical fix, you may choose to start a manual deployment out-of-band. When doing so, older releases continue to stay scheduled. This posed a challenge since the manual deployment would be rolled back when the deployments resumed as per schedule. Many of you reported this issue and we have now fixed it. With the fix, all older scheduled deployments to the environment would be cancelled when you manually start a deployment. This is only applicable when the queueing option is selected as "Deploy latest and cancel others".
Simplified resource authorization in YAML pipelines
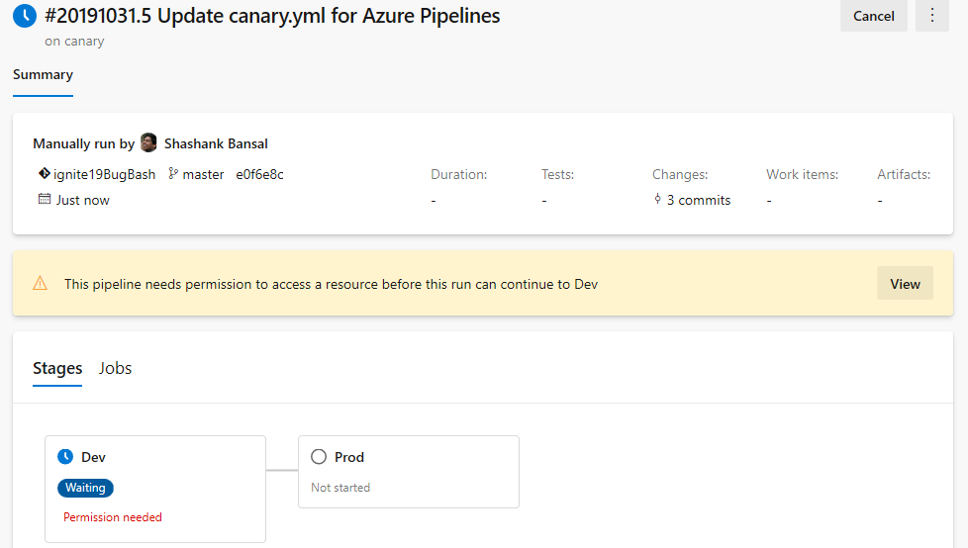
A resource is anything used by a pipeline that is outside the pipeline. Resources must be authorized before they can be used. Previously, when using unauthorized resources in a YAML pipeline, it failed with a resource authorization error. You had to authorize the resources from the summary page of the failed run. In addition, the pipeline failed if it was using a variable that referenced an unauthorized resource.
We are now making it easier to manage resource authorizations. Instead of failing the run, the run will wait for permissions on the resources at the start of the stage consuming the resource. A resource owner can view the pipeline and authorize the resource from the Security page.
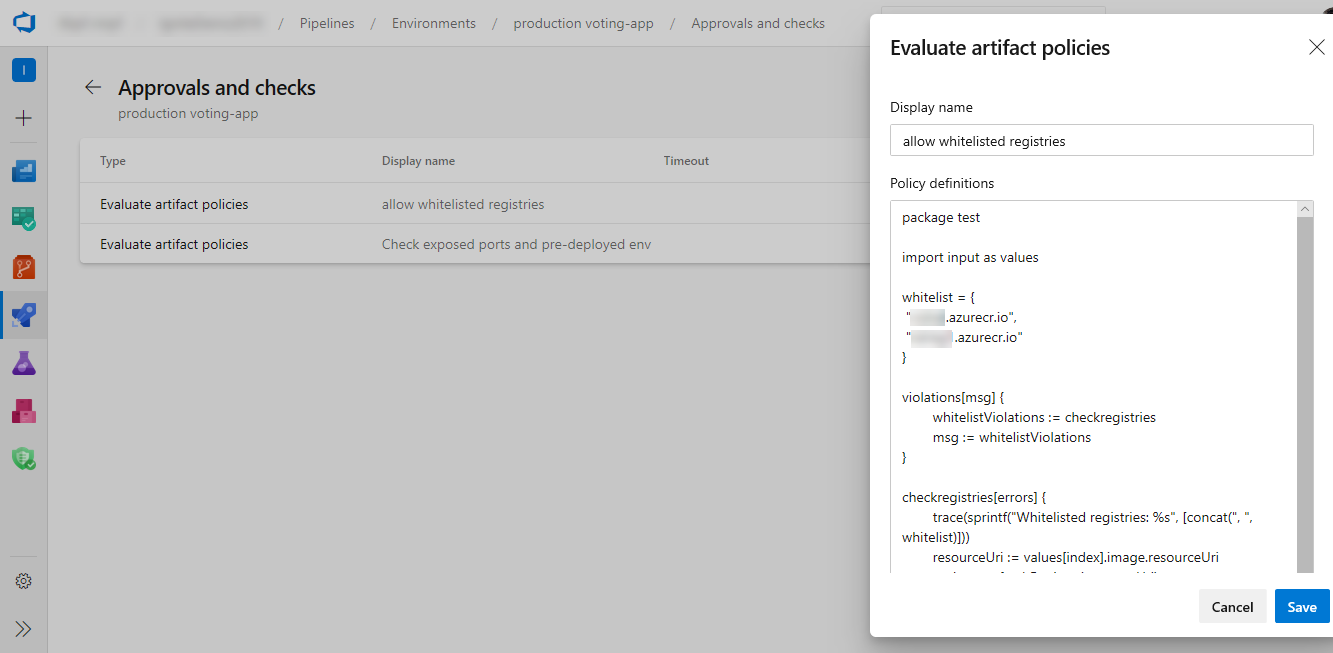
Evaluate artifact check
You can now define a set of policies and add the policy evaluation as a check on an environment for container image artifacts. When a pipeline runs, the execution pauses before starting a stage that uses the environment. The specified policy is evaluated against the available metadata for the image being deployed. The check passes when the policy is successful and marks the stage as failed if the check fails.
Updates to the ARM template deployment task
Previously, we didn't filter the service connections in the ARM template deployment task. This may result in the deployment to fail if you are selecting a lower scope service connection to perform ARM template deployments to a broader scope. Now, we added filtering of service connections to filter out lower scoped service connections based on the deployment scope you choose.
ReviewApp in Environment
ReviewApp deploys every pull request from your Git repository to a dynamic environment resource. Reviewers can see how those changes look as well as work with other dependent services before they’re merged into the main branch and deployed to production. This will make it easy for you to create and manage reviewApp resources and benefit from all the traceability and diagnosis capability of the environment features. By using the reviewApp keyword, you can create a clone of a resource (dynamically create a new resource based on an existing resource in an environment) and add the new resource to the environment.
The following is a sample YAML snippet of using reviewApp under environments.
jobs:
- deployment:
  environment:
     name: smarthotel-dev
     resourceName: $(System.PullRequest.PullRequestId)
  pool:
    name: 'ubuntu-latest'
  strategy:
    runOnce:
      pre-deploy:
        steps:
        - reviewApp: MainNamespace
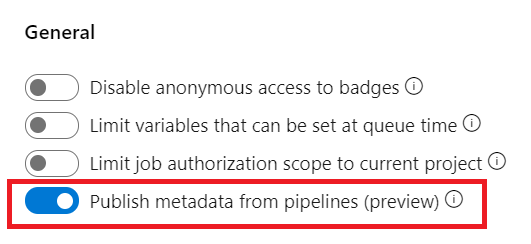
Collect automatic and user-specified metadata from pipeline
Now you can enable automatic and user-specified metadata collection from pipeline tasks. You can use metadata to enforce artifact policy on an environment using the evaluate artifact check.
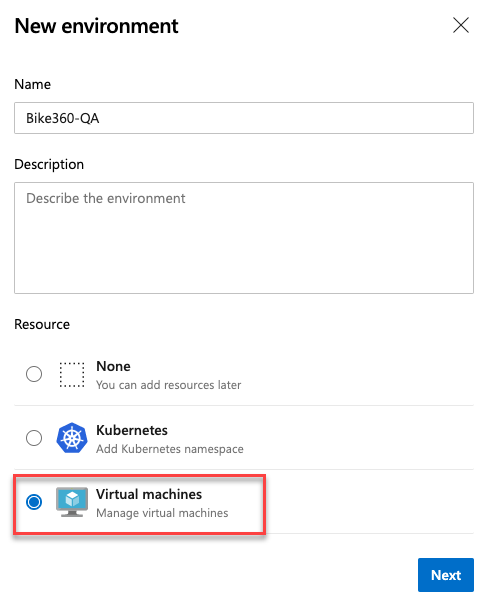
VM deployments with Environments
One of the most requested features in Environments was VM deployments. With this update, we are enabling Virtual Machine resource in Environments. You can now orchestrate deployments across multiple machines and perform rolling updates using YAML pipelines. You can also install the agent on each of your target servers directly and drive rolling deployment to those servers. In addition, you can use the full task catalog on your target machines.
A rolling deployment replaces instances of the previous version of an application with instances of the new version of the application on a set of machines (rolling set) in each iteration.
For example, below rolling deployment updates up to five targets in each iteration. maxParallel will determine the number of targets that can be deployed in parallel. The selection accounts for the number of targets that must remain available at any time, excluding the targets that are being deployed to. It is also used to determine the success and failure conditions during deployment.
jobs:
- deployment:
  displayName: web
  environment:
    name: musicCarnivalProd
    resourceType: VirtualMachine
  strategy:
    rolling:
      maxParallel: 5 #for percentages, mention as x%
      preDeploy:
        steps:
        - script: echo initialize, cleanup, backup, install certs...
      deploy:
        steps:
        - script: echo deploy ...
      routeTraffic:
        steps:
        - script: echo routing traffic...
      postRouteTaffic:
        steps:
        - script: echo health check post routing traffic...
      on:
        failure:
          steps:
          - script: echo restore from backup ..
        success:
          steps:
          - script: echo notify passed...
Note
With this update, all available artifacts from the current pipeline and from the associated pipeline resources are downloaded only in deploy lifecycle-hook. However, you can choose to download by specifying Download Pipeline Artifact task.
There are a few known gaps in this feature. For example, when you retry a stage, it will re-run the deployment on all VMs not just failed targets. We are working to close these gaps in future updates.
Additional control of your deployments
Azure Pipelines has supported deployments controlled with manual approvals for some time now. With the latest enhancements, you now have additional control over your deployments. In addition to approvals, resource owners can now add automated checks to verify security and quality policies. These checks can be used to trigger operations and then wait for them to complete. Using the additional checks, you can now define health criteria based on multiple sources and be assured that all deployments targeting your resources are safe, regardless of the YAML pipeline performing the deployment. Evaluation of each check can be repeated periodically based on the specified Retry Interval for the check.
The following additional checks are now available:
- Invoke any REST API and perform validation based on response body or a callback from the external service
- Invoke an Azure function and perform validation based on response or a callback from the function
- Query Azure Monitor rules for active alerts
- Ensure the pipeline extends one or more YAML templates
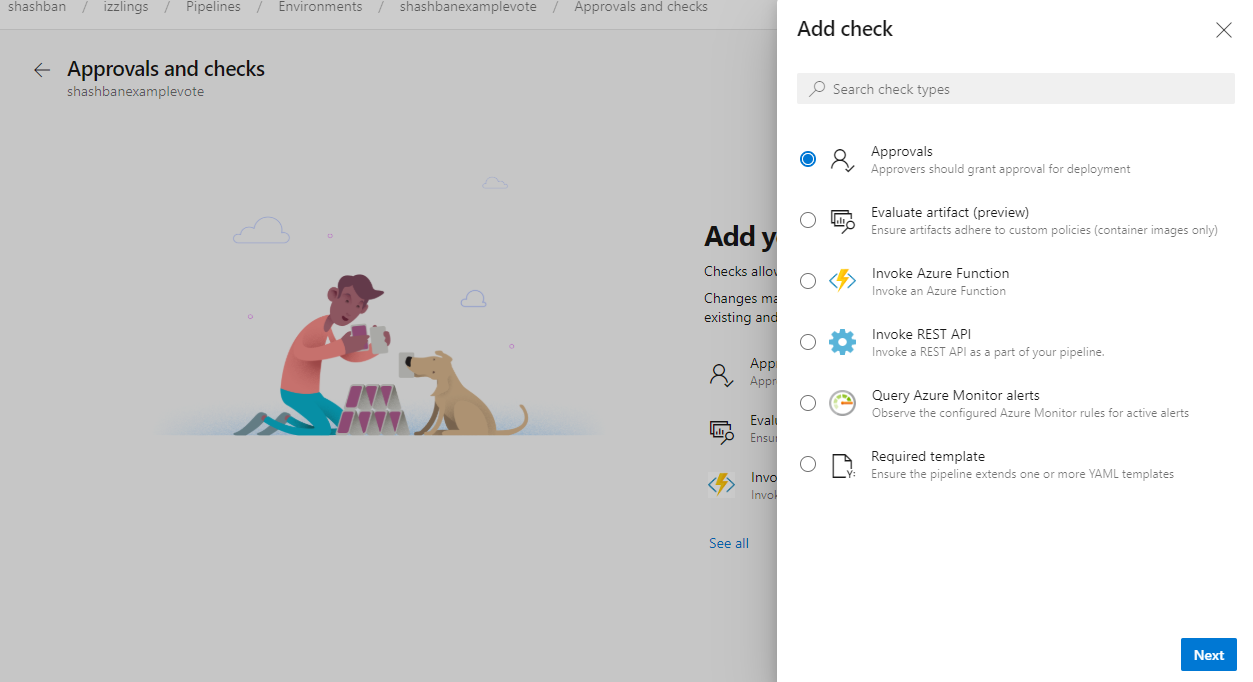
Approval notification
When you add an approval to an environment or a service connection, all multi-stage pipelines that use the resource automatically wait for the approval at the start of the stage. The designated approvers need to complete the approval before the pipeline can continue.
With this update, the approvers are sent an email notification for the pending approval. Users and team owners can opt-out of or configure custom subscriptions using notification settings.
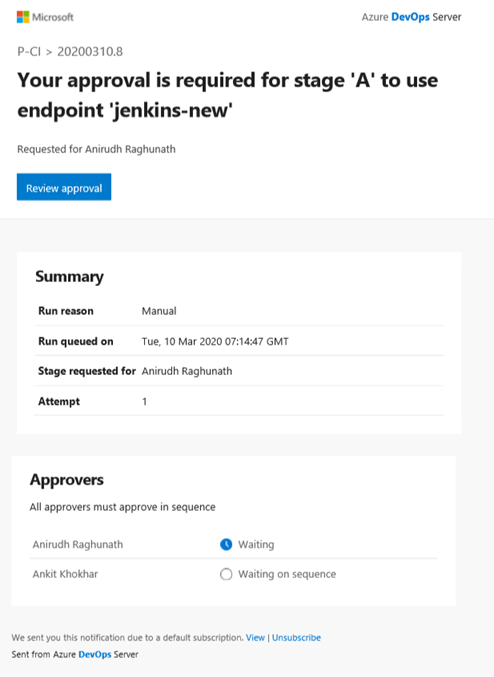
Configure Deployment Strategies from Azure portal
With this capability, we have made it easier for you to configure pipelines that use the deployment strategy of your choice, for example, Rolling, Canary, or Blue-Green. Using these out-of-box strategies, you can roll out updates in a safe manner and mitigate associated deployment risks. To access this, click on the 'Continuous Delivery' setting in an Azure Virtual Machine. In the configuration pane, you will be prompted to select details about the Azure DevOps project where the pipeline will be created, the deployment group, build pipeline that publishes the package to be deployed and the deployment strategy of your choice. Going ahead will configure a fully functional pipeline that deploys the selected package to this Virtual Machine.
For more details, check out our documentation on configuring Deployment Strategies.
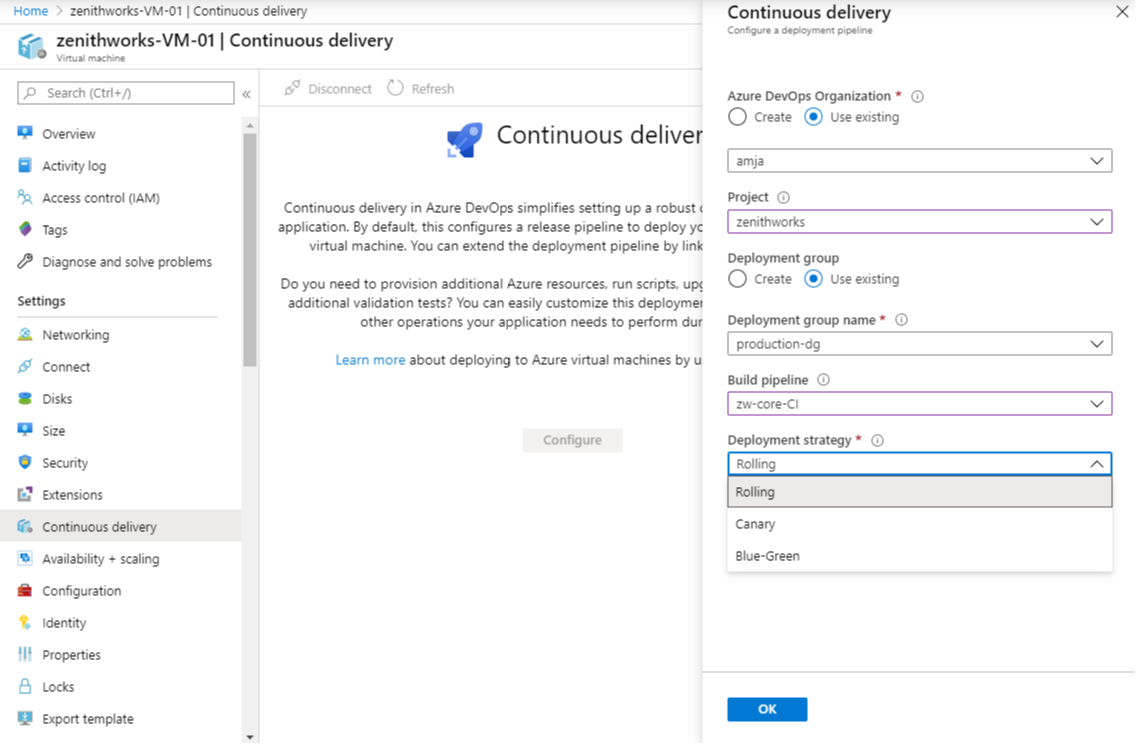
Runtime parameters
Runtime parameters let you have more control over what values can be passed to a pipeline. Unlike variables, runtime parameters have data types and don't automatically become environment variables. With runtime parameters you can:
- Supply different values to scripts and tasks at runtime
- Control parameter types, ranges allowed, and defaults
- Dynamically select jobs and stages with template expression
To learn more about runtime parameters, see the documentation here.
Use extends keyword in pipelines
Currently, pipelines can be factored out into templates, promoting reuse and reducing boilerplate. The overall structure of the pipeline was still defined by the root YAML file. With this update, we added a more structured way to use pipeline templates. A root YAML file can now use the keyword extends to indicate that the main pipeline structure can be found in another file. This puts you in control of what segments can be extended or altered and what segments are fixed. We've also enhanced pipeline parameters with data types to make clear the hooks that you can provide.
This example illustrates how you can provide simple hooks for the pipeline author to use. The template will always run a build, will optionally run additional steps provided by the pipeline, and then run an optional testing step.
# azure-pipelines.yml
extends:
  template: build-template.yml
  parameters:
    runTests: true
    postBuildSteps:
    - script: echo This step runs after the build!
    - script: echo This step does too!

# build-template.yml
parameters:
- name: runTests
  type: boolean
  default: false
- name: postBuildSteps
  type: stepList
  default: []
steps:
- task: MSBuild@1   # this task always runs
- ${{ if eq(parameters.runTests, true) }}:
  - task: VSTest@2  # this task is injected only when runTests is true
- ${{ each step in parameters.postBuildSteps }}:
  - ${{ step }}
Control variables that can be overridden at queue time
Previously, you could use the UI or REST API to update the values of any variable prior to starting a new run. While the pipeline's author can mark certain variables as _settable at queue time_, the system didn't enforce this, nor prevented other variables from being set. In other words, the setting was only used to prompt for additional inputs when starting a new run.
We've added a new collection setting that enforces the _settable at queue time_ parameter. This will give you control over which variables can be changed when starting a new run. Going forward, you can't change a variable that is not marked by the author as _settable at queue time_.
Note
This setting is off by default in existing collections, but it will be on by default when you create a new Azure DevOps collection.
New predefined variables in YAML pipeline
Variables give you a convenient way to get key bits of data into various parts of your pipeline. With this update we've added a few predefined variables to a deployment job. These variables are automatically set by the system, scoped to the specific deployment job and are read-only.
- Environment.Id - The ID of the environment.
- Environment.Name - The name of the environment targeted by the deployment job.
- Environment.ResourceId - The ID of the resource in the environment targeted by the deployment job.
- Environment.ResourceName - The name of the resource in the environment targeted by the deployment job.
Checkout multiple repositories
Pipelines often rely on multiple repositories. You can have different repositories with source, tools, scripts, or other items that you need to build your code. Previously, you had to add these repositories as submodules or as manual scripts to run git checkout. Now you can fetch and check out other repositories, in addition to the one you use to store your YAML pipeline.
For example, if you have a repository called MyCode with a YAML pipeline and a second repository called Tools, your YAML pipeline will look like this:
resources:
  repositories:
  - repository: tools
    name: Tools
    type: git

steps:
- checkout: self
- checkout: tools
- script: dir $(Build.SourcesDirectory)
The third step will show two directories, MyCode and Tools in the sources directory.
Azure Repos Git repositories are supported. For more information, see Multi-repo checkout.
Getting details at runtime about multiple repositories
When a pipeline is running, Azure Pipelines adds information about the repo, branch, and commit that triggered the run. Now that YAML pipelines support checking out multiple repositories, you may also want to know the repo, branch, and commit that were checked out for other repositories. This data is available via a runtime expression, which now you can map into a variable. For example:
resources:
  repositories:
  - repository: other
    type: git
    name: MyProject/OtherTools

variables:
  tools.ref: $[ resources.repositories['other'].ref ]

steps:
- checkout: self
- checkout: other
- bash: echo "Tools version: $TOOLS_REF"
Allow repository references to other Azure Repos collections
Previously, when you referenced repositories in a YAML pipeline, all Azure Repos repositories had to be in the same collection as the pipeline. Now, you can point to repositories in other collections using a service connection. For example:
resources:
  repositories:
  - repository: otherrepo
    name: ProjectName/RepoName
    endpoint: MyServiceConnection
steps:
- checkout: self
- checkout: otherrepo
MyServiceConnection points to another Azure DevOps collection and has credentials which can access the repository in another project. Both repos, self and otherrepo, will end up checked out.
Important
MyServiceConnection must be an Azure Repos / Team Foundation Server service connection, see the picture below.
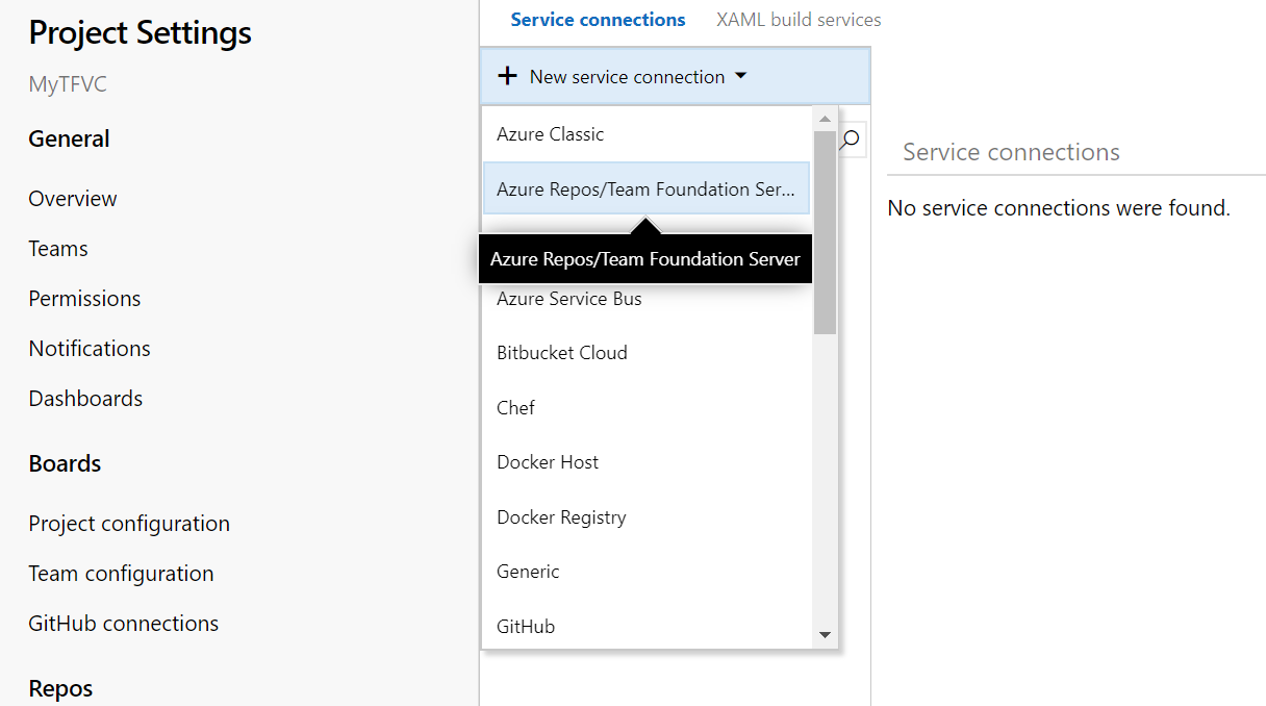
Pipeline resource meta-data as predefined variables
We've added predefined variables for YAML pipelines resources in the pipeline. Here is the list of the pipeline resource variables available.
resources.pipeline.<Alias>.projectName
resources.pipeline.<Alias>.projectID
resources.pipeline.<Alias>.pipelineName
resources.pipeline.<Alias>.pipelineID
resources.pipeline.<Alias>.runName
resources.pipeline.<Alias>.runID
resources.pipeline.<Alias>.runURI
resources.pipeline.<Alias>.sourceBranch
resources.pipeline.<Alias>.sourceCommit
resources.pipeline.<Alias>.sourceProvider
resources.pipeline.<Alias>.requestedFor
resources.pipeline.<Alias>.requestedForID
kustomize and kompose as bake options in KubernetesManifest task
kustomize (part of Kubernetes sig-cli) let you customize raw, template-free YAML files for multiple purposes and leaves the original YAML untouched. An option for kustomize has been added under bake action of KubernetesManifest task so that any folder containing kustomization.yaml files can be used for generating the manifest files used in the deploy action of the KubernetesManifest task.
steps:
- task: KubernetesManifest@0
  name: bake
  displayName: Bake K8s manifests from Helm chart
  inputs:
    action: bake
    renderType: kustomize
    kustomizationPath: folderContainingKustomizationFile

- task: KubernetesManifest@0
  displayName: Deploy K8s manifests
  inputs:
    kubernetesServiceConnection: k8sSC1
    manifests: $(bake.manifestsBundle)
kompose will transform a Docker Compose files into a Kubernetes resource.
steps:
- task: KubernetesManifest@0
  name: bake
  displayName: Bake K8s manifests from Helm chart
  inputs:
    action: bake
    renderType: kompose
    dockerComposeFile: docker-compose.yaml

- task: KubernetesManifest@0
  displayName: Deploy K8s manifests
  inputs:
    kubernetesServiceConnection: k8sSC1
    manifests: $(bake.manifestsBundle)
Support for cluster admin credentials in HelmDeploy task
Previously, the HelmDeploy task used the cluster user credentials for deployments. This resulted in interactive login prompts and failing pipelines for an Azure Active Directory based RBAC enabled cluster. To address this issue, we added a checkbox that lets you use cluster admin credentials instead of a cluster user credentials.
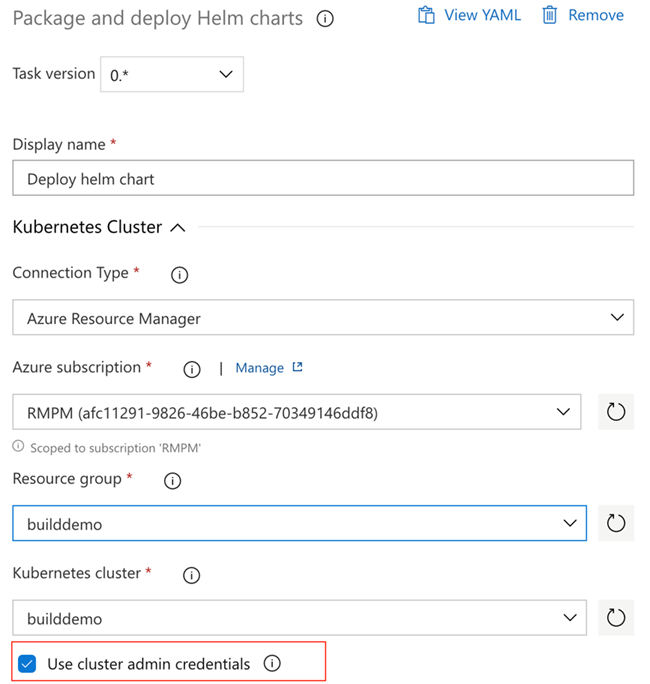
Arguments input in Docker Compose task
A new field has been introduced in the Docker Compose task to let you add arguments such as --no-cache. The argument will be passed down by the task when running commands such as build.
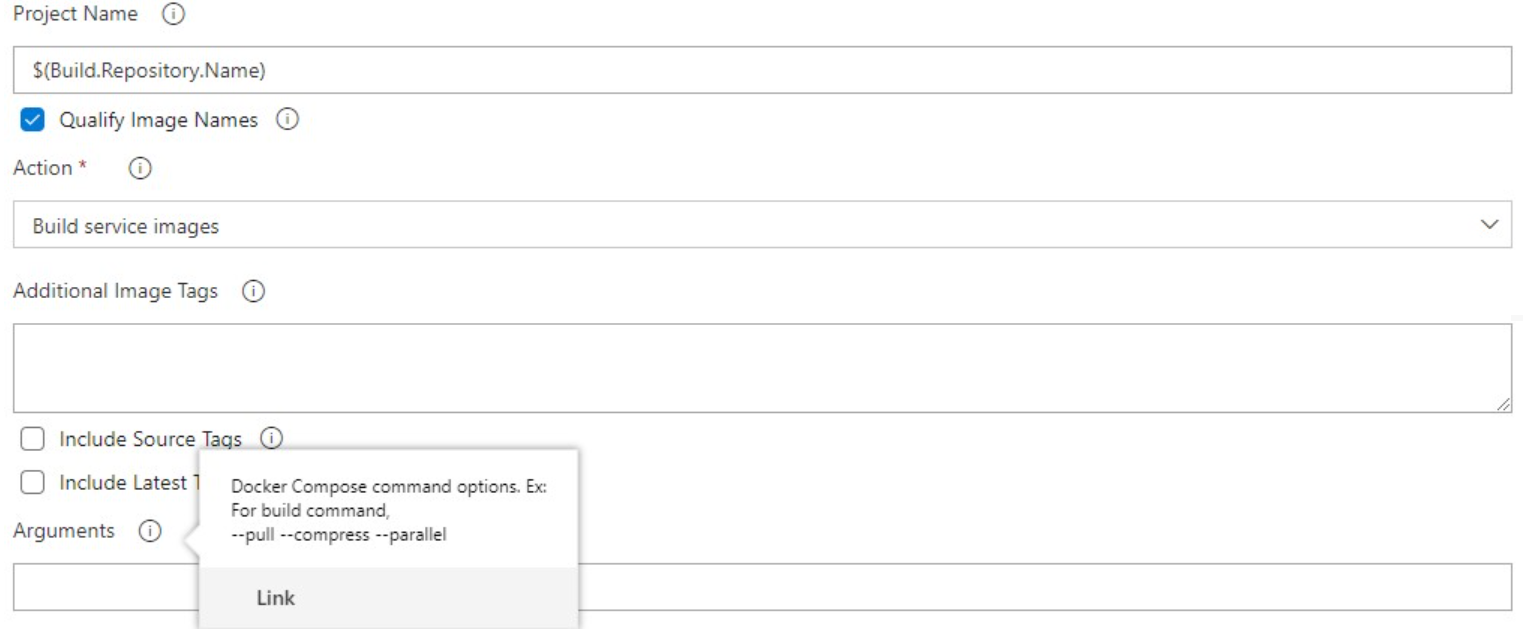
GitHub release task enhancements
We've made several enhancements to the GitHub Release task. You can now have better control over release creation using the tag pattern field by specifying a tag regular expression and the release will be created only when the triggering commit is tagged with a matching string.
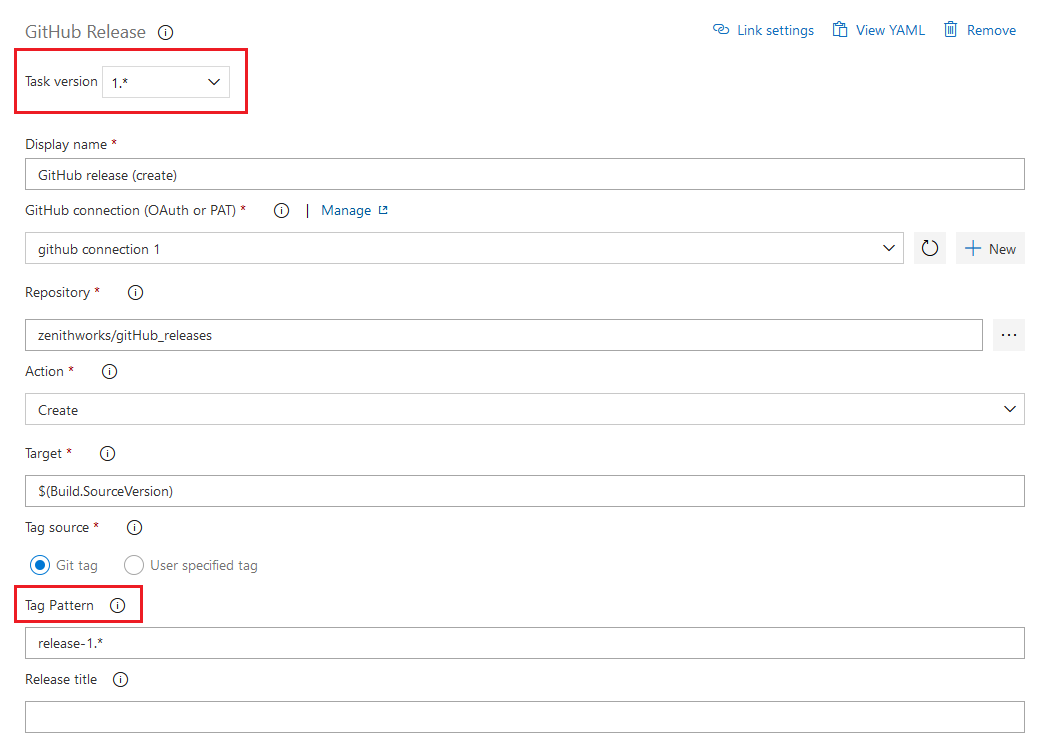
We've also added capabilities to customize creation and formatting of changelog. In the new section for changelog configuration, you can now specify the release against which the current release should be compared. The Compare to release can be the last full release (excludes pre-releases), last non-draft release or any previous release matching your provided release tag. Additionally, the task provides changelog type field to format the changelog. Based on the selection the changelog will display either a list of commits or a list of issues/PRs categorized based on labels.
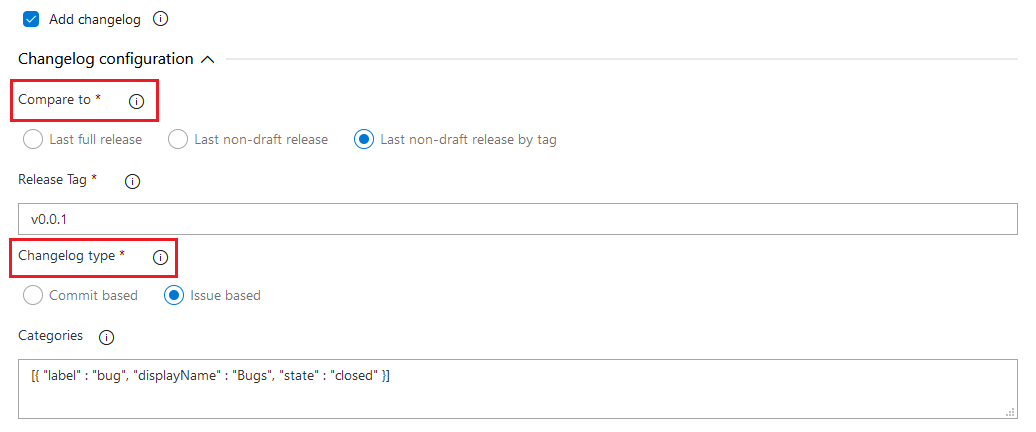
Open Policy Agent installer task
Open Policy Agent is an open source, general-purpose policy engine that enables unified, context-aware policy enforcement. We've added the Open Policy Agent installer task. It is particularly useful for in-pipeline policy enforcement with respect to Infrastructure as Code providers.
For example, Open Policy Agent can evaluate Rego policy files and Terraform plans in pipeline.
task: OpenPolicyAgentInstaller@0
    inputs:
          opaVersion: '0.13.5'
Support for PowerShell scripts in Azure CLI task
Previously, you could execute batch and bash scripts as part of an Azure CLI task. With this update, we added support for PowerShell and PowerShell core scripts to the task.

Service Mesh Interface based canary deployments in KubernetesManifest task
Previously when canary strategy was specified in the KubernetesManifest task, the task would create baseline and canary workloads whose replicas equaled a percentage of the replicas used for stable workloads. This was not exactly the same as splitting traffic up to the desired percentage at the request level. To tackle this, we've added support for Service Mesh Interface based canary deployments to the KubernetesManifest task.
Service Mesh Interface abstraction allows for plug-and-play configuration with service mesh providers such as Linkerd and Istio. Now the KubernetesManifest task takes away the hard work of mapping SMI's TrafficSplit objects to the stable, baseline and canary services during the lifecycle of the deployment strategy. The desired percentage split of traffic between stable, baseline and canary are more accurate as the percentage traffic split is controlled on the requests in the service mesh plane.
The following is a sample of performing SMI based canary deployments in a rolling manner.
- deployment: Deployment
    displayName: Deployment
    pool:
      vmImage: $(vmImage)
    environment: ignite.smi
    strategy:
      canary:
        increments: [25, 50]
        preDeploy:
          steps:
          - task: KubernetesManifest@0
            displayName: Create/update secret
            inputs:
              action: createSecret
              namespace: smi
              secretName: $(secretName)
              dockerRegistryEndpoint: $(dockerRegistryServiceConnection)
        deploy:
          steps:
          - checkout: self
          - task: KubernetesManifest@0
            displayName: Deploy canary
            inputs:
              action: $(strategy.action)
              namespace: smi
              strategy: $(strategy.name)
              trafficSplitMethod: smi
              percentage: $(strategy.increment)
              baselineAndCanaryReplicas: 1
              manifests: |
                manifests/deployment.yml
                manifests/service.yml
              imagePullSecrets: $(secretName)
              containers: '$(containerRegistry)/$(imageRepository):$(Build.BuildId)'
        postRouteTraffic:
          pool: server
          steps:
            - task: Delay@1
              inputs:
                delayForMinutes: '2'
Azure File Copy Task now supports AzCopy V10
The Azure file copy task can be used in a build or release pipeline to copy files to Microsoft storage blobs or virtual machines (VMs). The task uses AzCopy, the command-line utility build for fast copying of data from and into Azure storage accounts. With this update, we've added support for AzCopy V10 which is the latest version of AzCopy.
The azcopy copy command supports only the arguments associated with it. Because of the change in syntax of AzCopy, some of the existing capabilities are not available in AzCopy V10. These include:
- Specifying log location
- Cleaning log and plan files after the copy
- Resume copy if job fails
The additional capabilities supported in this version of the task are:
- Wildcard symbols in the file name/path of the source
- Inferring the content type based on file extension when no arguments are provided
- Defining the log verbosity for the log file by passing an argument
Improve pipeline security by restricting the scope of access tokens
Every job that runs in Azure Pipelines gets an access token. The access token is used by the tasks and by your scripts to call back into Azure DevOps. For example, we use the access token to get source code, upload logs, test results, artifacts, or to make REST calls into Azure DevOps. A new access token is generated for each job, and it expires once the job completes. With this update, we added the following enhancements.
Prevent the token from accessing resources outside a team project
Until now, the default scope of all pipelines was the team project collection. You could change the scope to be the team project in classic build pipelines. However, you did not have that control for classic release or YAML pipelines. With this update we are introducing an collection setting to force every job to get a project-scoped token no matter what is configured in the pipeline. We also added the setting at the project level. Now, every new project and collection that you create will automatically have this setting turned on.
Note
The collection setting overrides the project setting.
Turning this setting on in existing projects and collections may cause certain pipelines to fail if your pipelines access resources that are outside the team project using access tokens. To mitigate pipeline failures, you can explicitly grant Project Build Service Account access to the desired resource. We strongly recommend that you turn on these security settings.
Limit build service repos scope access
Building upon improving pipeline security by restricting the scope of access token, Azure Pipelines can now scope down its repository access to just the repos required for a YAML-based pipeline. This means that if the pipelines's access token were to leak, it would only be able to see the repo(s) used in the pipeline. Previously, the access token was good for any Azure Repos repository in the project, or potentially the entire collection.
This feature will be on by default for new projects and collections. For existing collections, you must enable it in Collections Settings > Pipelines > Settings. When using this feature, all repositories needed by the build (even those you clone using a script) must be included in the repository resources of the pipeline.
Remove certain permissions for the access token
By default, we grant a number of permissions to the access token, one of this permission is Queue builds. With this update, we removed this permission to the access token. If your pipelines need this permission, you can explicitly grant it to the Project Build Service Account or Project Collection Build Service Account depending on the token that you use.
Project level security for service connections
We added hub level security for service connections. Now, you can add/remove users, assign roles and manage access in a centralized place for all the service connections.
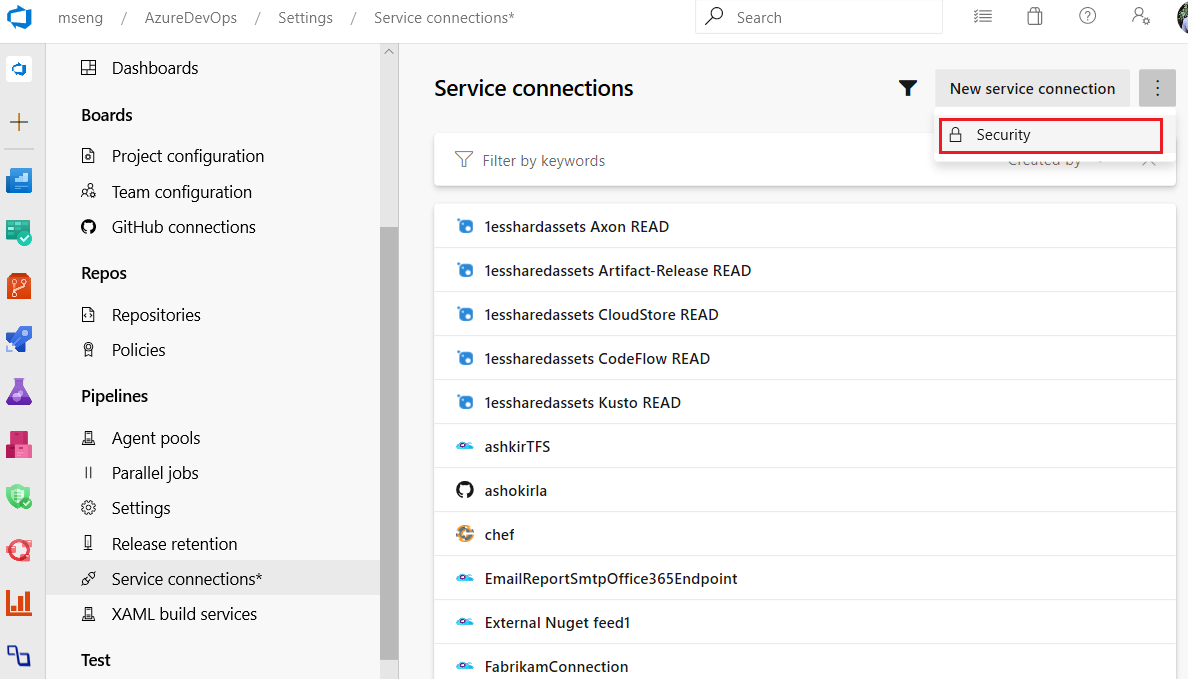
Step targeting and command isolation
Azure Pipelines supports running jobs either in containers or on the agent host. Previously, an entire job was set to one of those two targets. Now, individual steps (tasks or scripts) can run on the target you choose. Steps may also target other containers, so a pipeline could run each step in a specialized, purpose-built container.
Containers can act as isolation boundaries, preventing code from making unexpected changes on the host machine. The way steps communicate with and access services from the agent is not affected by isolating steps in a container. Therefore, we're also introducing a command restriction mode which you can use with step targets. Turning this on will restrict the services a step can request from the agent. It will no longer be able to attach logs, upload artifacts, and certain other operations.
Here's a comprehensive example, showing running steps on the host in a job container, and in another container:
resources:
  containers:
  - container: python
    image: python:3.8
  - container: node
    image: node:13.2

jobs:
- job: example
  container: python

  steps:
  - script: echo Running in the job container

  - script: echo Running on the host
    target: host

  - script: echo Running in another container, in restricted commands mode
    target:
      container: node
      commands: restricted
Read-only variables
System variables were documented as being immutable, but in practice they could be overwritten by a task and downstream tasks would pick up the new value. With this update, we tighten up the security around pipeline variables to make system and queue-time variables read-only. In addition, you can make a YAML variable read-only by marking it as follows.
variables:
- name: myVar
  value: myValue
  readonly: true
Role-based access for service connections
We have added role-based access for service connections. Previously, service connection security could only be managed through pre-defined Azure DevOps groups such as Endpoint administrators and Endpoint Creators.
As part of this work, we have introduced the new roles of Reader, User, Creator and Administrator. You can set these roles via the service connections page in your project and these are inherited by the individual connections. And in each service connection you have the option to turn inheritance on or off and override the roles in the scope of the service connection.
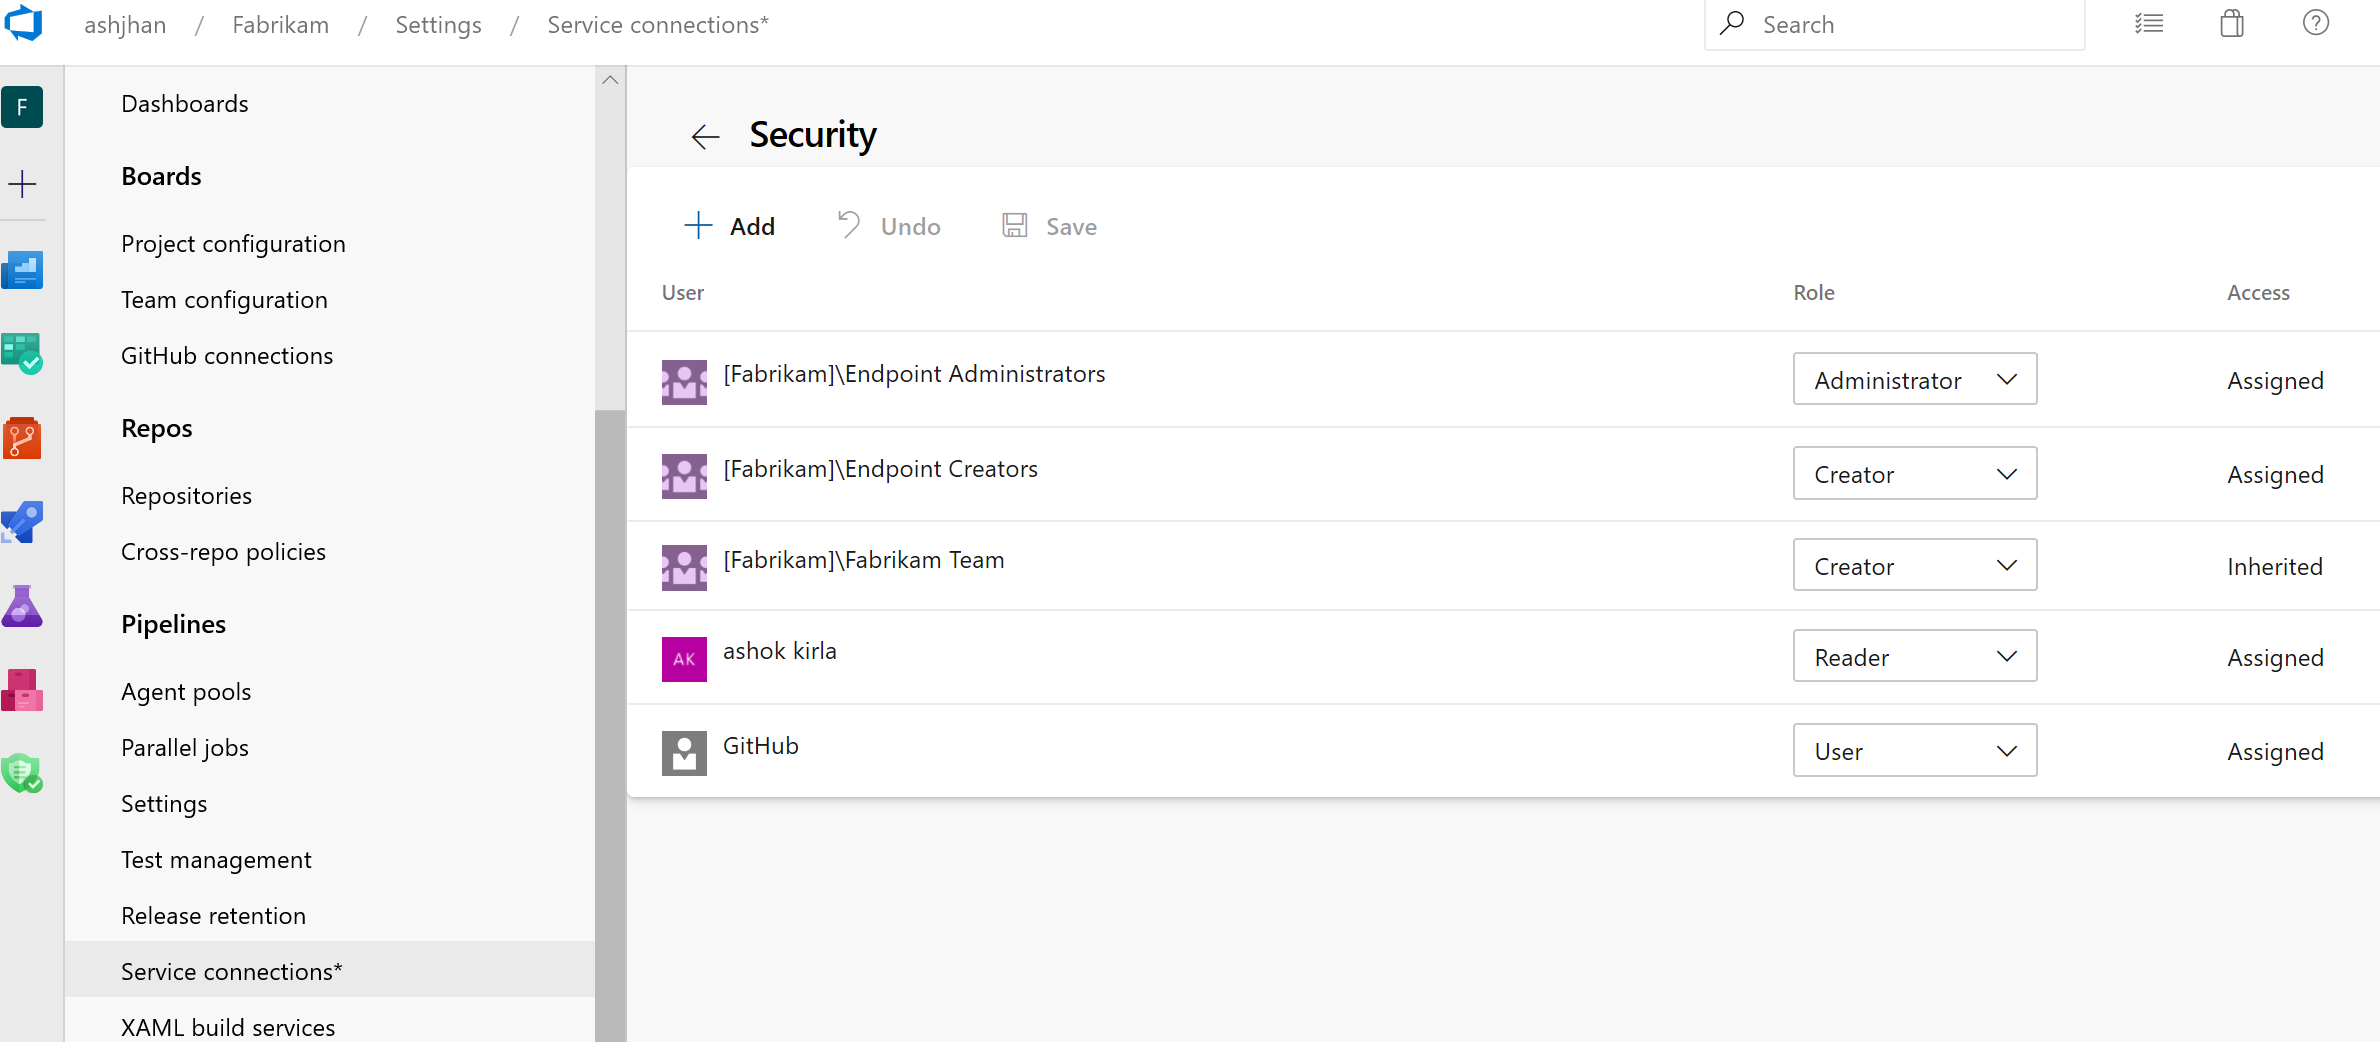
Learn more about service connections security here.
Cross-project sharing of service connections
We enabled support for service connection sharing across projects. You can now share your service connections with your projects safely and securely.
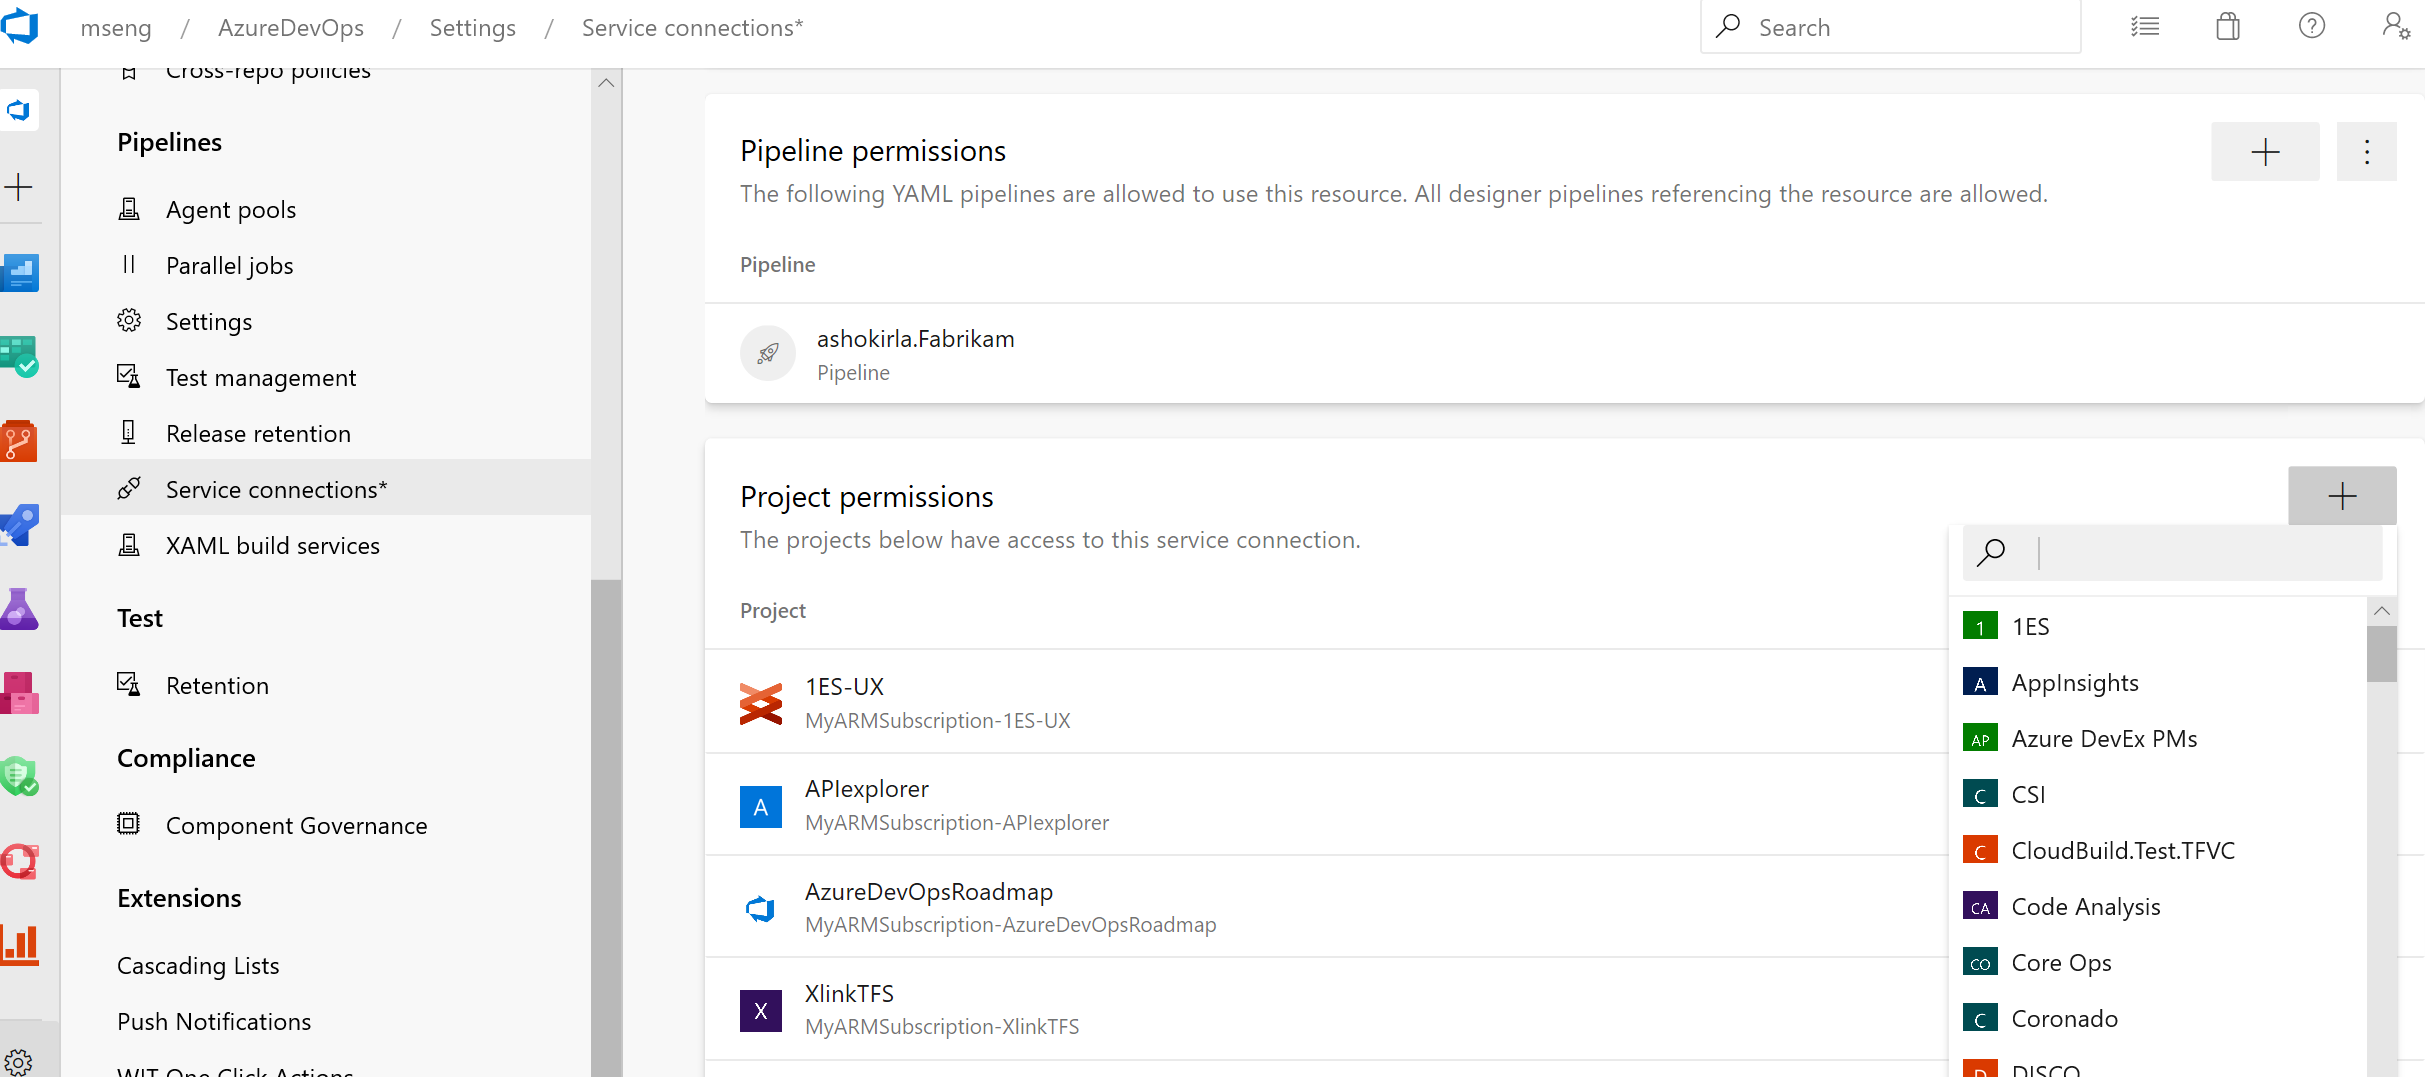
Learn more about service connections sharing here.
Traceability for pipelines and ACR resources
We ensure full E2E traceability when pipelines and ACR container resources are used in a pipeline. For every resource consumed by your YAML pipeline, you can trace back to the commits, work items and artifacts.
In the pipeline run summary view, you can see:
The resource version that triggered the run. Now, your pipeline can be triggered upon completion of another Azure pipeline run or when a container image is pushed to ACR.
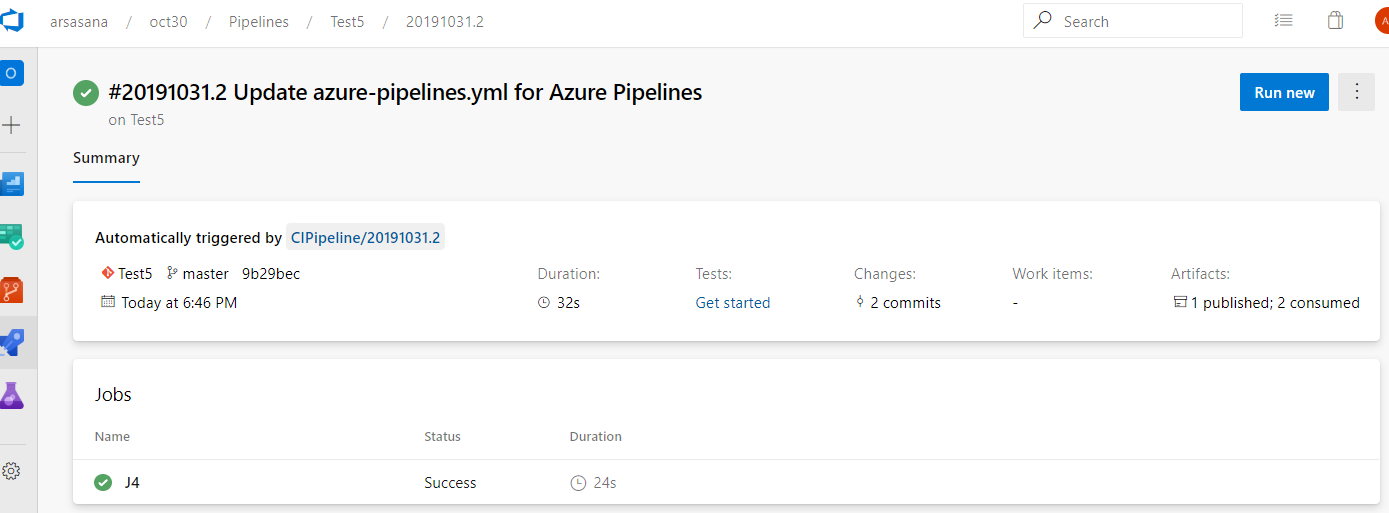
The commits that are consumed by the pipeline. You can also find the breakdown of the commits by each resource consumed by the pipeline.
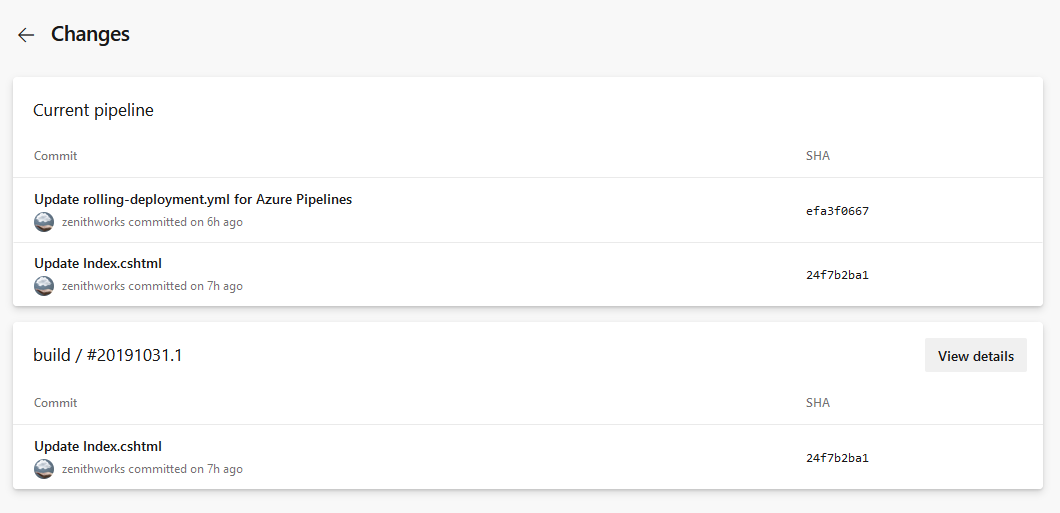
The work items that are associated with each resource consumed by the pipeline.
The artifacts that are available to be used by the run.
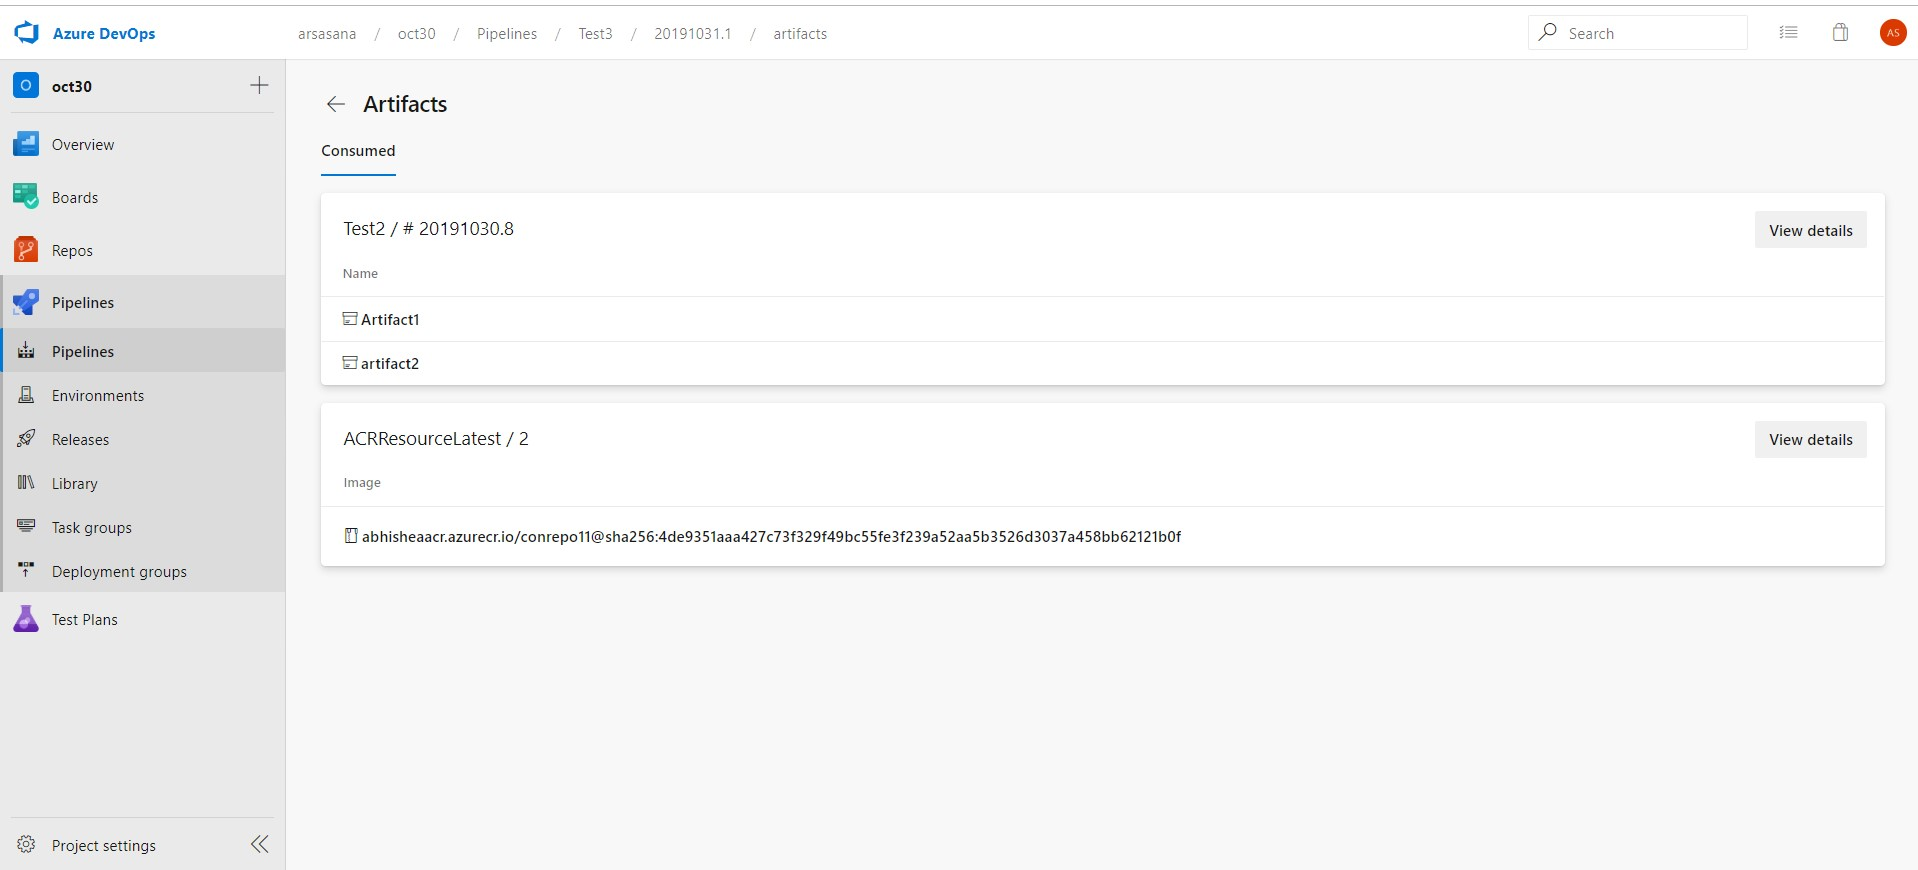
In the environment's deployments view, you can see the commits and work items for each resource deployed to the environment.

Support for large test attachments
The publish test results task in Azure Pipelines lets you publish test results when tests are executed to provide a comprehensive test reporting and analytics experience. Until now, there was a limit of 100MB for test attachments for both test run and test results. This limited the upload of big files like crash dumps or videos. With this update, we added support for large test attachments allowing you to have all available data to troubleshoot your failed tests.
You might see VSTest task or Publish test results task returning a 403 or 407 error in the logs. If you are using self-hosted builds or release agents behind a firewall which filters outbound requests, you will need to make some configuration changes to be able to use this functionality.
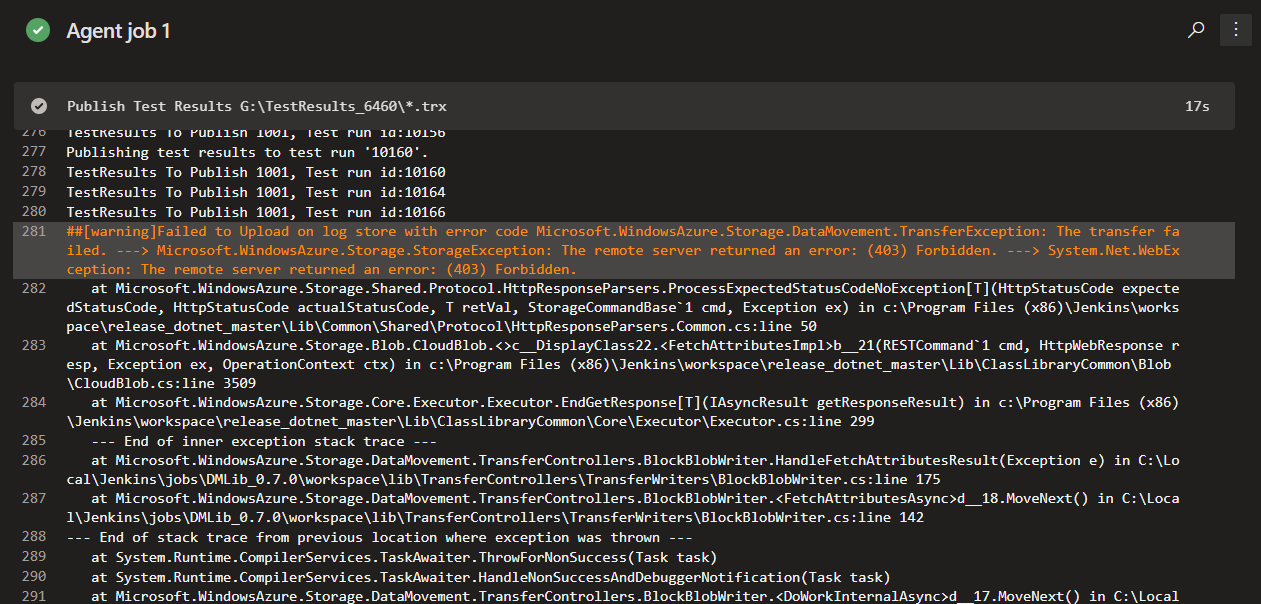
In order to fix this issue, we recommend that you update the firewall for outbound requests to https://*.vstmrblob.vsassets.io. You can find troubleshooting information in the documentation here.
Note
This is only required if you're using self-hosted Azure Pipelines agents and you're behind a firewall that is filtering outbound traffic. If you are using Microsoft-hosted agents in the cloud or that aren't filtering outbound network traffic, you don't need to take any action.
Show correct pool information on each job
Previously, when you used a matrix to expand jobs or a variable to identify a pool, we sometimes resolved incorrect pool information in the logs pages. These issues have been resolved.
CI triggers for new branches
It has been a long pending request to not trigger CI builds when a new branch is created and when that branch doesn't have changes. Consider the following examples:
- You use the web interface to create a new branch based on an existing branch. This would immediately trigger a new CI build if your branch filter matches the name of the new branch. This is unwanted because the content of the new branch is the same when compared to the existing branch.
- You have a repository with two folders - app and docs. You set up a path filter for CI to match "app". In other words, you do not want to create a new build if a change has been pushed to docs. You create a new branch locally, make some changes to docs, and then push that branch to the server. We used to trigger a new CI build. This is unwanted since you explicitly asked not to look for changes in docs folder. However, because of the way we handled a new branch event, it would seem as if a change has been made to the app folder as well.
Now, we have a better way of handling CI for new branches to address these problems. When you publish a new branch, we explicitly look for new commits in that branch, and check whether they match the path filters.
Jobs can access output variables from previous stages
Output variables may now be used across stages in a YAML-based pipeline. This helps you pass useful information, such as a go/no-go decision or the ID of a generated output, from one stage to the next. The result (status) of a previous stage and its jobs is also available.
Output variables are still produced by steps inside of jobs. Instead of referring to dependencies.jobName.outputs['stepName.variableName'], stages refer to stageDependencies.stageName.jobName.outputs['stepName.variableName'].
Note
By default, each stage in a pipeline depends on the one just before it in the YAML file. Therefore, each stage can use output variables from the prior stage. You can alter the dependency graph, which will also alter which output variables are available. For instance, if stage 3 needs a variable from stage 1, it will need to declare an explicit dependency on stage 1.
Disable automatic agents upgrades at a pool level
Currently, pipelines agents will automatically update to the latest version when required. This typically happens when there is a new feature or task which requires a newer agent version to function correctly. With this update, we're adding the ability to disable automatic upgrades at a pool level. In this mode, if no agent of the correct version is connected to the pool, pipelines will fail with a clear error message instead of requesting agents to update. This feature is mostly of interest for customers with self-hosted pools and very strict change-control requirements. Automatic updates are enabled by default, and we don’t recommend most customers disable them.
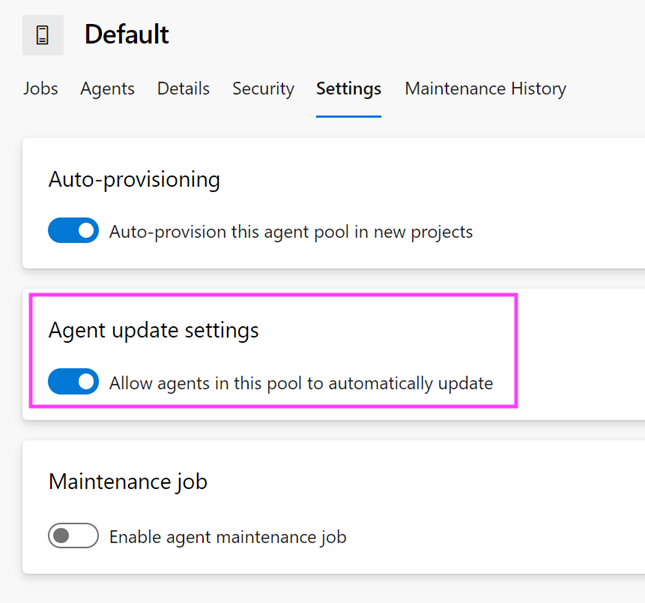
Agent diagnostics
We've added diagnostics for many common agent related problems such as many networking issues and common causes of upgrade failures. To get started with diagnostics, use run.sh --diagnostics or run.cmd --diagnostics on Windows.
Service hooks for YAML pipelines
Integrating services with YAML pipelines just got easier. Using service hooks events for YAML pipelines, you can now drive activities in custom apps or services based on progress of the pipeline runs. For example, you can create a helpdesk ticket when an approval is required, initiate a monitoring workflow after a stage is complete or send a push notification to your team's mobile devices when a stage fails.
Filtering on pipeline name and stage name is supported for all events. Approval events can be filtered for specific environments as well. Similarly, state change events can be filtered by new state of the pipeline run or the stage.
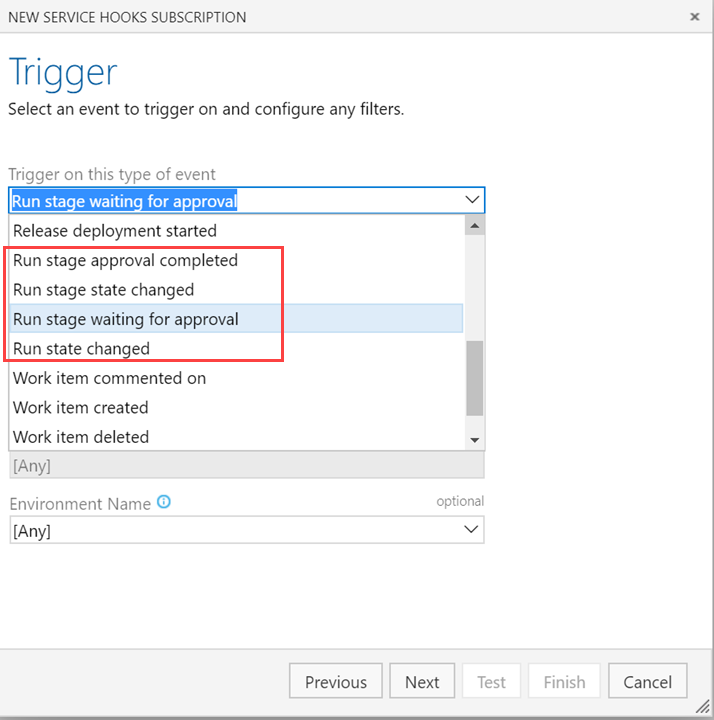
Optimizely integration
Optimizely is a powerful A/B testing and feature flagging platform for product teams. Integration of Azure Pipelines with Optimizely experimentation platform empowers product teams to test, learn and deploy at an accelerated pace, while gaining all DevOps benefits from Azure Pipelines.
The Optimizely extension for Azure DevOps adds experimentation and feature flag rollout steps to the build and release pipelines, so you can continuously iterate, roll features out, and roll them back using Azure Pipelines.
Learn more about the Azure DevOps Optimizely extension here.
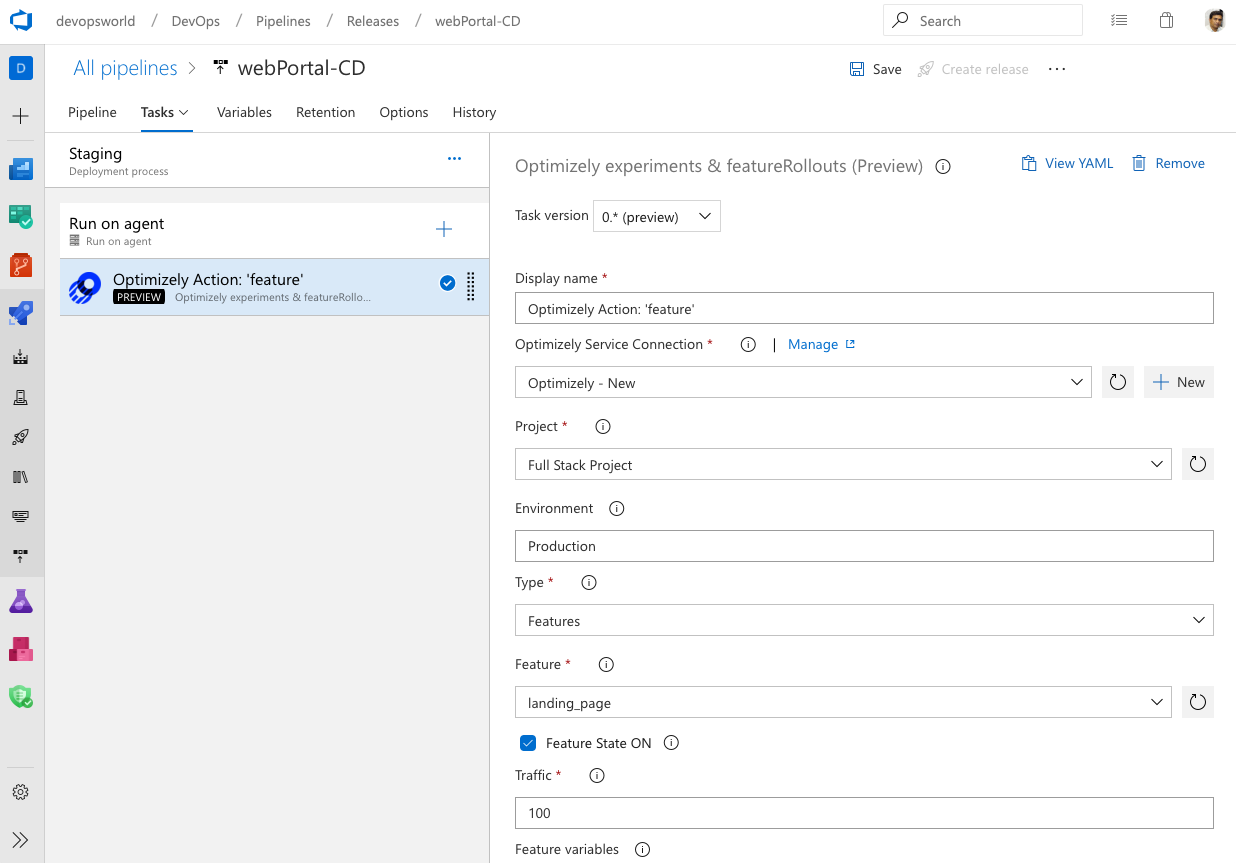
Add a GitHub release as an artifact source
Now you can link your GitHub releases as artifact source in Azure DevOps release pipelines. This will let you consume the GitHub release as part of your deployments.
When you click Add an artifact in the release pipeline definition, you will find the new GitHub Release source type. You can provide the service connection and the GitHub repo to consume the GitHub release. You can also choose a default version for the GitHub release to consume as latest, specific tag version or select at release creation time. Once a GitHub release is linked, it is automatically downloaded and made available in your release jobs.
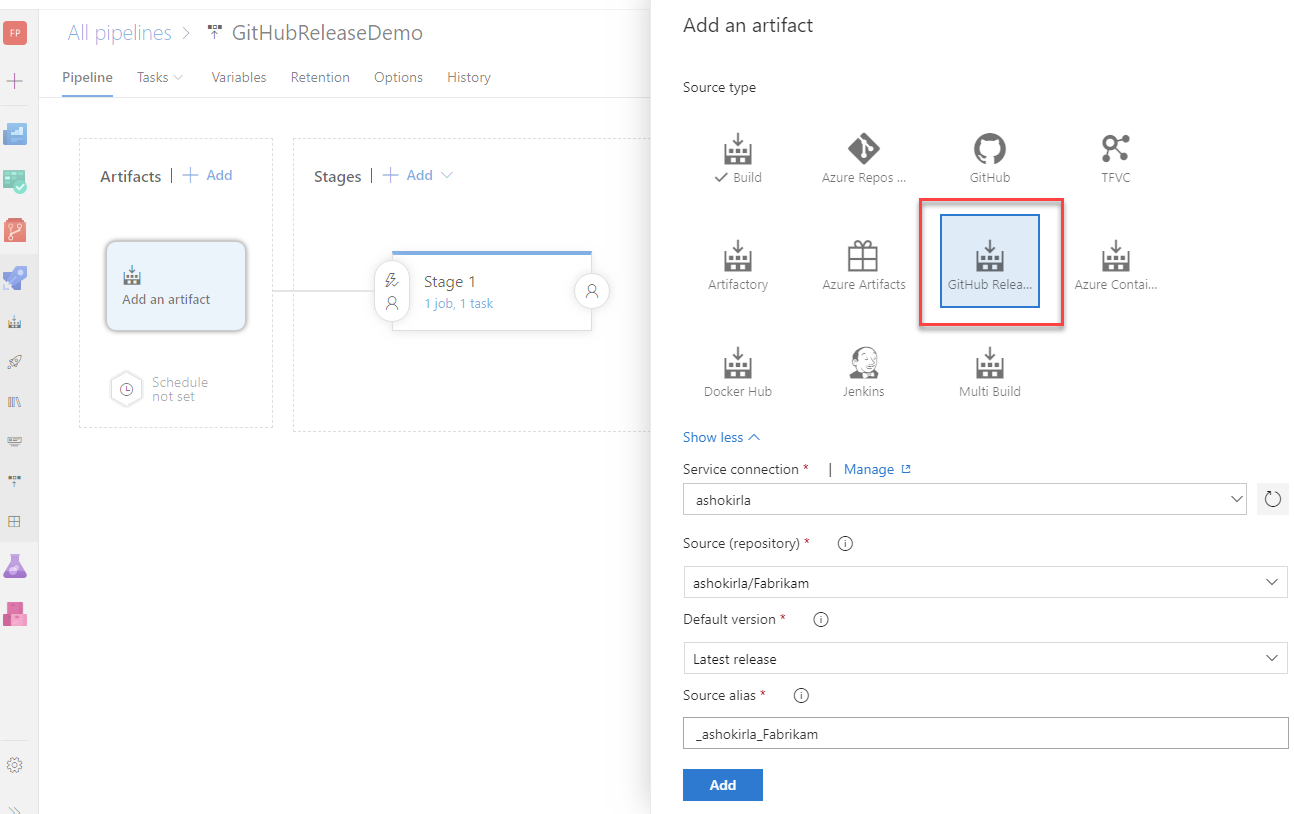
Terraform integration with Azure Pipelines
Terraform is an open-source tool for developing, changing and versioning infrastructure safely and efficiently. Terraform codifies APIs into declarative configuration files allowing you to define and provision infrastructure using a high-level configuration language. You can use the Terraform extension to create resources across all major infrastructure providers: Azure, Amazon Web Services (AWS) and Google Cloud Platform (GCP).
To learn more about the Terraform extension, see the documentation here.
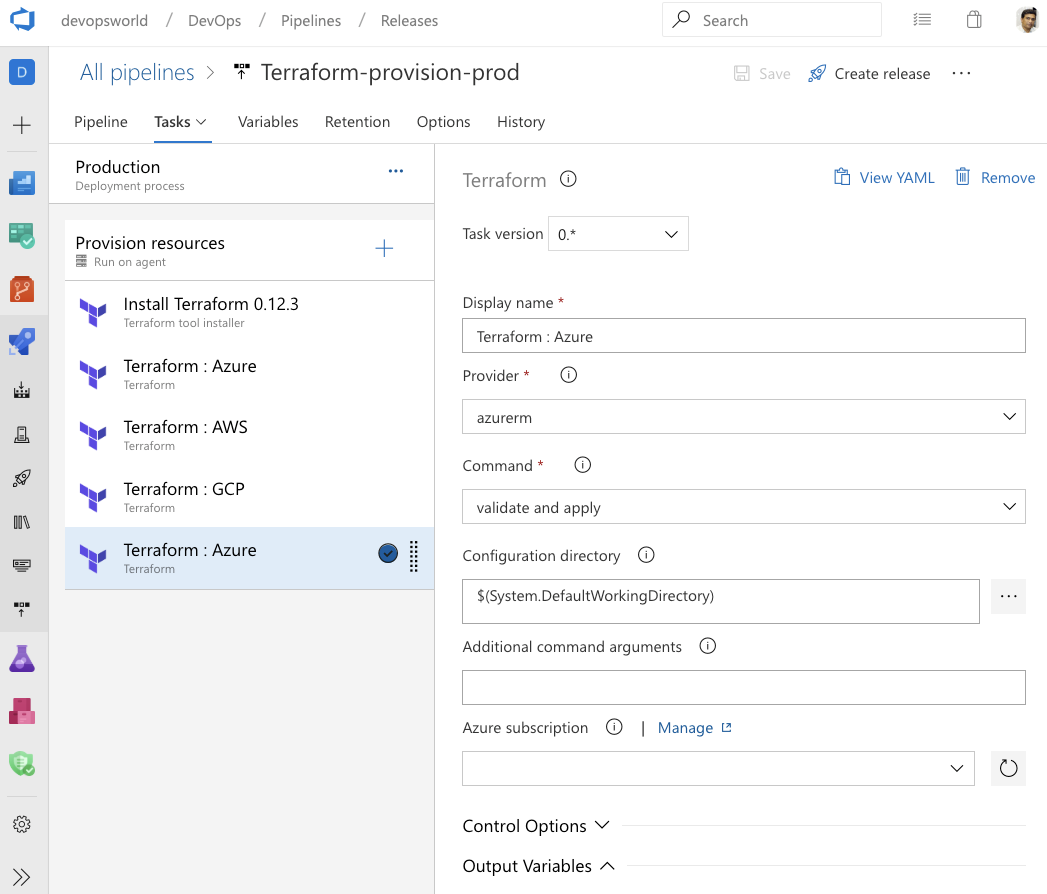
Integration with Google Analytics
The Google Analytics experiments framework lets you test almost any change or variation to a website or app to measure its impact on a specific objective. For example, you might have activities that you want your users to complete (e.g., make a purchase, sign up for a newsletter) and/or metrics that you want to improve (e.g., revenue, session duration, bounce rate). These activities let you identify changes worth implementing based on the direct impact they have on the performance of your feature.
The Google Analytics experiments extension for Azure DevOps adds experimentation steps to the build and release pipelines, so you can continuously iterate, learn and deploy at an accelerated pace by managing the experiments on a continuous basis while gaining all the DevOps benefits from Azure Pipelines.
You can download the Google Analytics experiments extension from the Marketplace.
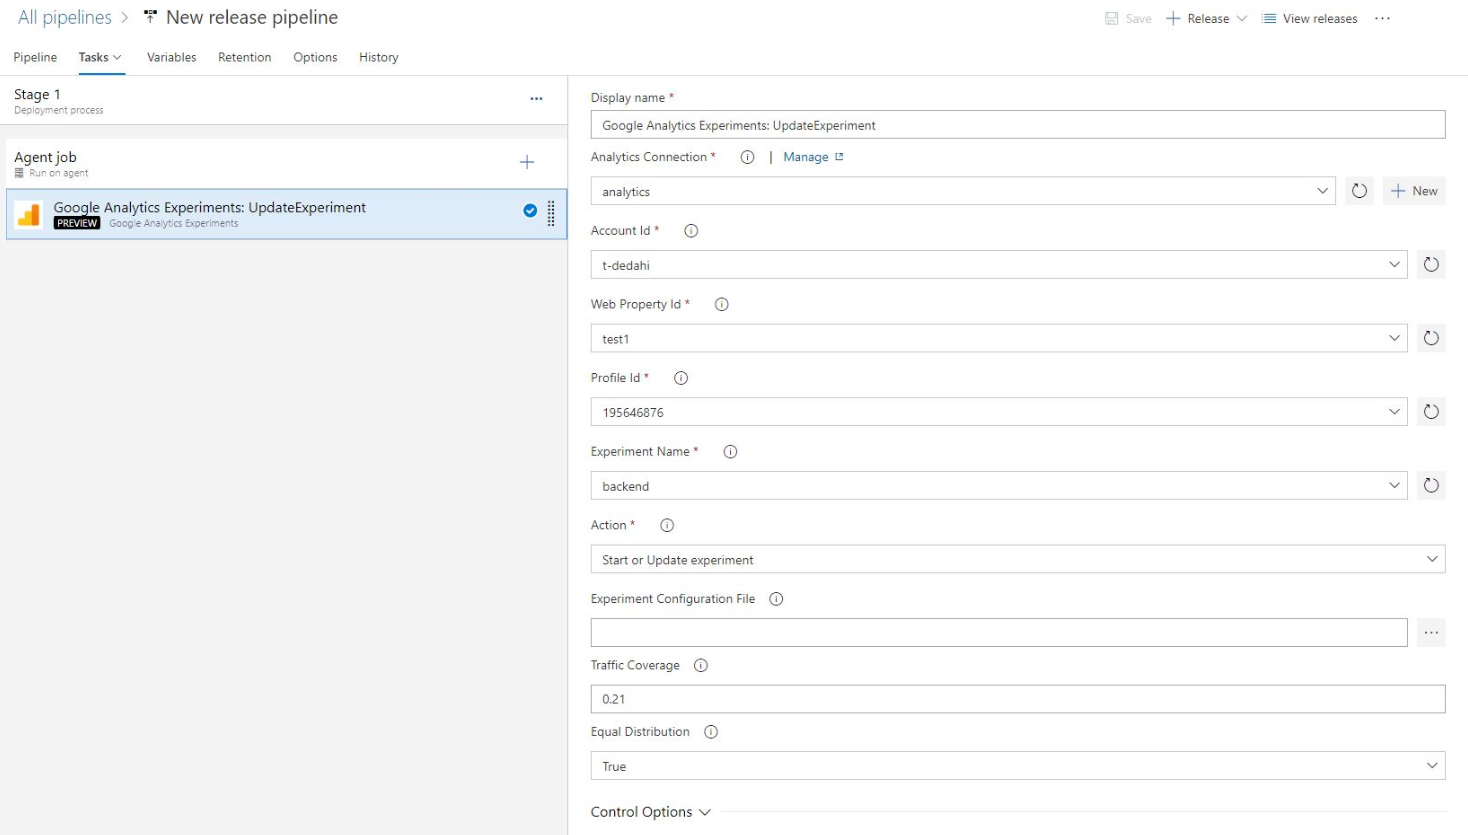
Updated ServiceNow integration with Azure Pipelines
The Azure Pipelines app for ServiceNow helps integrate Azure Pipelines and ServiceNow Change Management. With this update, you can integrate with the New York version of ServiceNow. The authentication between the two services can now be made using OAuth and basic authentication. In addition, you can now configure advanced success criteria so you can use any change property to decide the gate outcome.
Create Azure Pipelines from VSCode
We've added a new functionality to the Azure Pipelines extension for VSCode. Now, you will be able to create Azure Pipelines directly from VSCode without leaving the IDE.
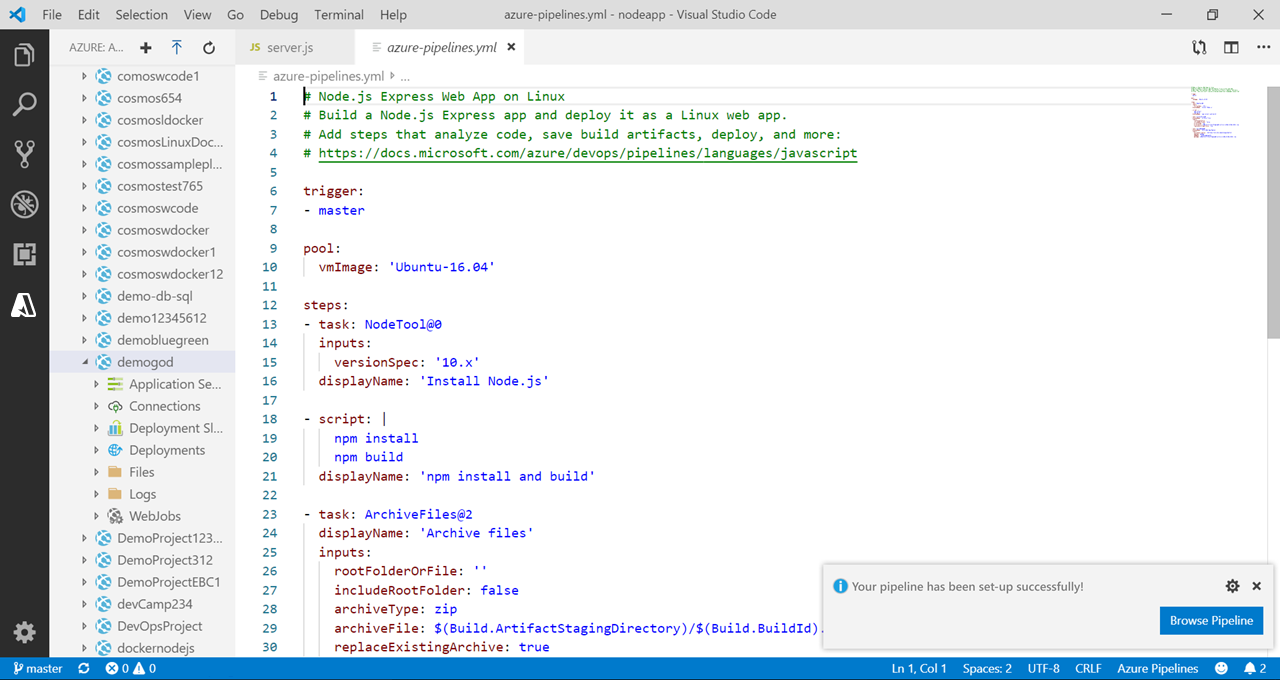
Flaky bug management and resolution
We introduced flaky test management to support end-to-end lifecycle with detection, reporting and resolution. To enhance it further we are adding flaky test bug management and resolution.
While investigating the flaky test you can create a bug using the Bug action which can then be assigned to a developer to further investigate the root cause of the flaky test. The bug report includes information about the pipeline like error message, stack trace and other information associated with the test.
When a bug report is resolved or closed, we will automatically unmark the test as unflaky.
Set VSTest tasks to fail if a minimum number of tests are not run
The VSTest task discovers and runs tests using user inputs (test files, filter criteria, and so forth) as well as a test adapter specific to the test framework being used. Changes to either user inputs or the test adapter can lead to cases where tests are not discovered and only a subset of the expected tests are run. This can lead to situations where pipelines succeed because tests are skipped rather than because the code is of sufficiently high quality. To help avoid this situation, we've added a new option in the VSTest task that allows you to specify the minimum number of tests that must be run for the task to pass.

VSTest TestResultsDirectory option is available in the task UI
The VSTest task stores test results and associated files in the $(Agent.TempDirectory)\TestResults folder. We've added an option to the task UI to let you configure a different folder to store test results. Now any subsequent tasks that need the files in a particular location can use them.
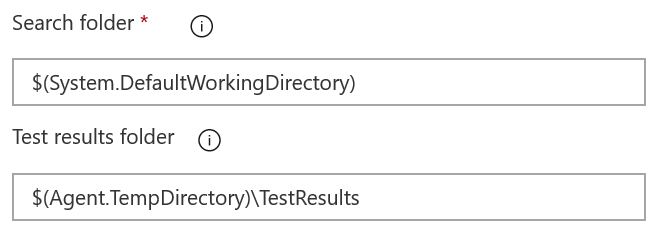
Markdown support in automated test error messages
We've added markdown support to error messages for automated tests. Now you can easily format error messages for both test run and test result to improve readability and ease the test failure troubleshooting experience in Azure Pipelines. The supported markdown syntax can be found here.

Use pipeline decorators to inject steps automatically in a deployment job
You can now add pipeline decorators to deployment jobs. You can have any custom step (e.g. vulnerability scanner) auto-injected to every life cycle hook execution of every deployment job. Since pipeline decorators can be applied to all pipelines in an collection, this can be leveraged as part of enforcing safe deployment practices.
In addition, deployment jobs can be run as a container job along with services side-car if defined.
Test Plans
New Test Plan page
A new Test Plans Page (Test Plans *) is available to all Azure DevOps collections. The new page provides streamlined views to help you focus on the task at hand - test planning, authoring or execution. It is also clutter-free and consistent with the rest of the Azure DevOps offering.
Help me understand the new page

The new Test Plans page has total of 6 sections of which the first 4 are new, while the Charts & Extensibility sections are the existing functionality.
- Test plan header: Use this to locate, favorite, edit, copy or clone a test plan.
- Test suites tree: Use this to add, manage, export or order test suites. Leverage this to also assign configurations and perform user acceptance testing.
- Define tab: Collate, add and manage test cases in a test suite of choice via this tab.
- Execute tab: Assign and execute tests via this tab or locate a test result to drill into.
- Chart tab: Track test execution and status via charts which can also be pinned to dashboards.
- Extensibility: Supports the current extensibility points within the product.
Lets take a broad stroke view of these new sections below.
1. Test plan header
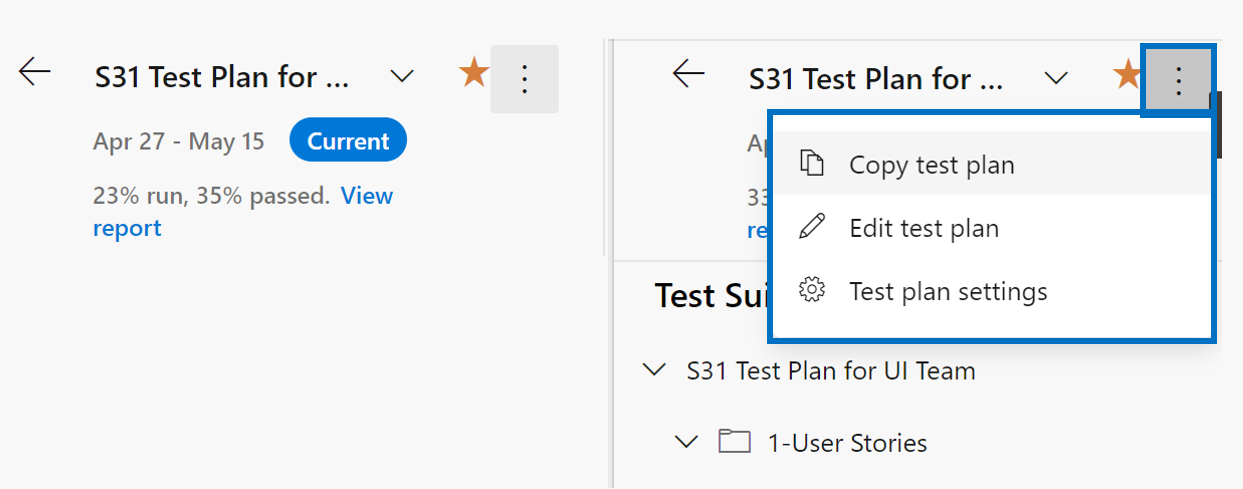
Tasks
The Test Plan header allows you to perform the following tasks:
- Mark a test plan as favorite
- Unmark a favorited test plan
- Easily navigate among your favorite test plans
- View the iteration path of the test plan, which clearly indicates if the test plan is Current or Past
- View the quick summary of the Test Progress report with a link to navigate to the report
- Navigate back to the All/Mine Test Plans page
Context menu options
The context menu on the Test Plan header provides the following options:
- Copy test plan: This is a new option that allows you to quickly copy the current test plan. More details below.
- Edit test plan: This option allows you to edit the Test Plan work item form to manage the work item fields.
- Test plan settings: This option allows you to configure the Test Run settings (to associate build or release pipelines) and the Test Outcome settings
Copy test plan (new capability)
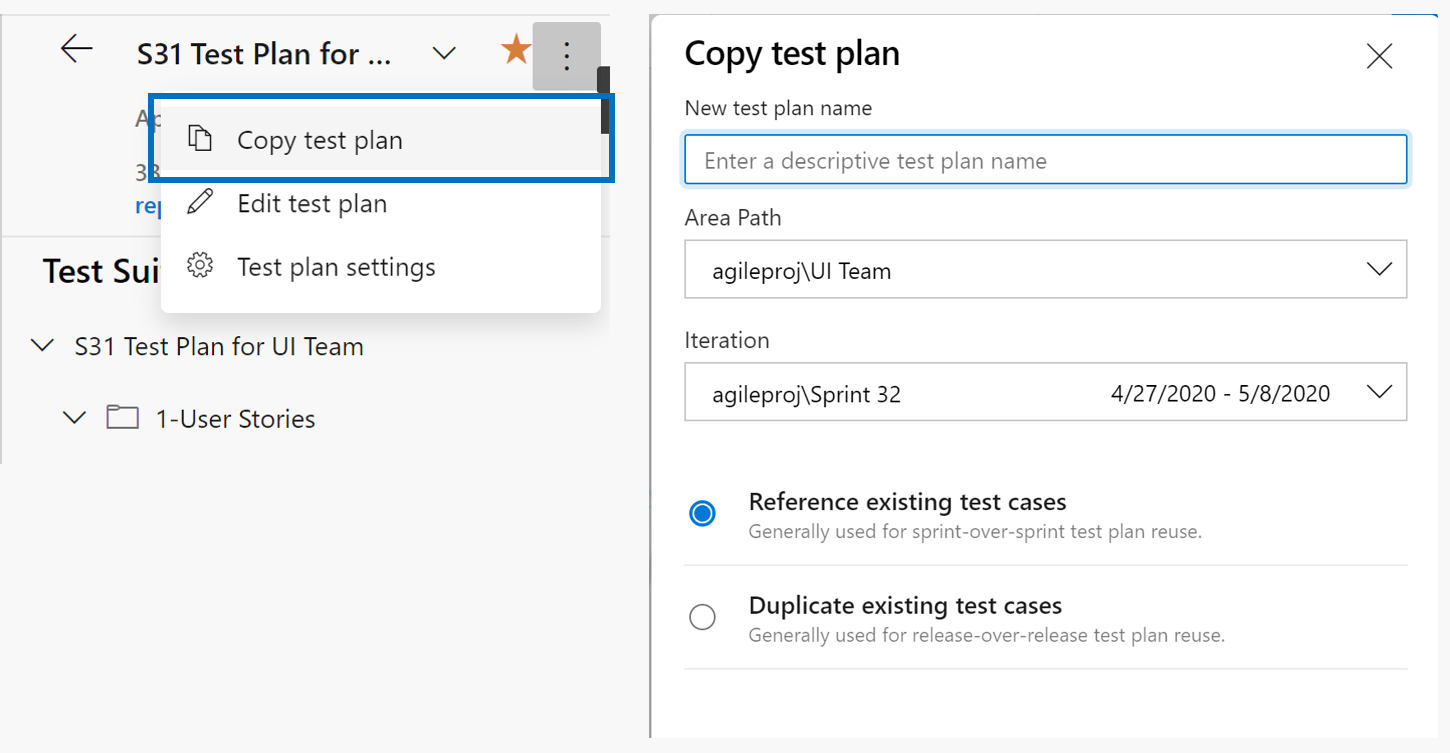
We recommend creating a new Test Plan per sprint/release. When doing so, generally the Test Plan for the prior cycle can be copied over and with few changes the copied test plan is ready for the new cycle. To make this process easy, we have enabled a 'Copy test plan' capability on the new page. By leveraging it you can copy or clone test plans. Its backing REST API is covered here and the API lets you copy/clone a test plan across projects too.
For more guidelines on Test Plans usage, refer here.
2. Test suites tree
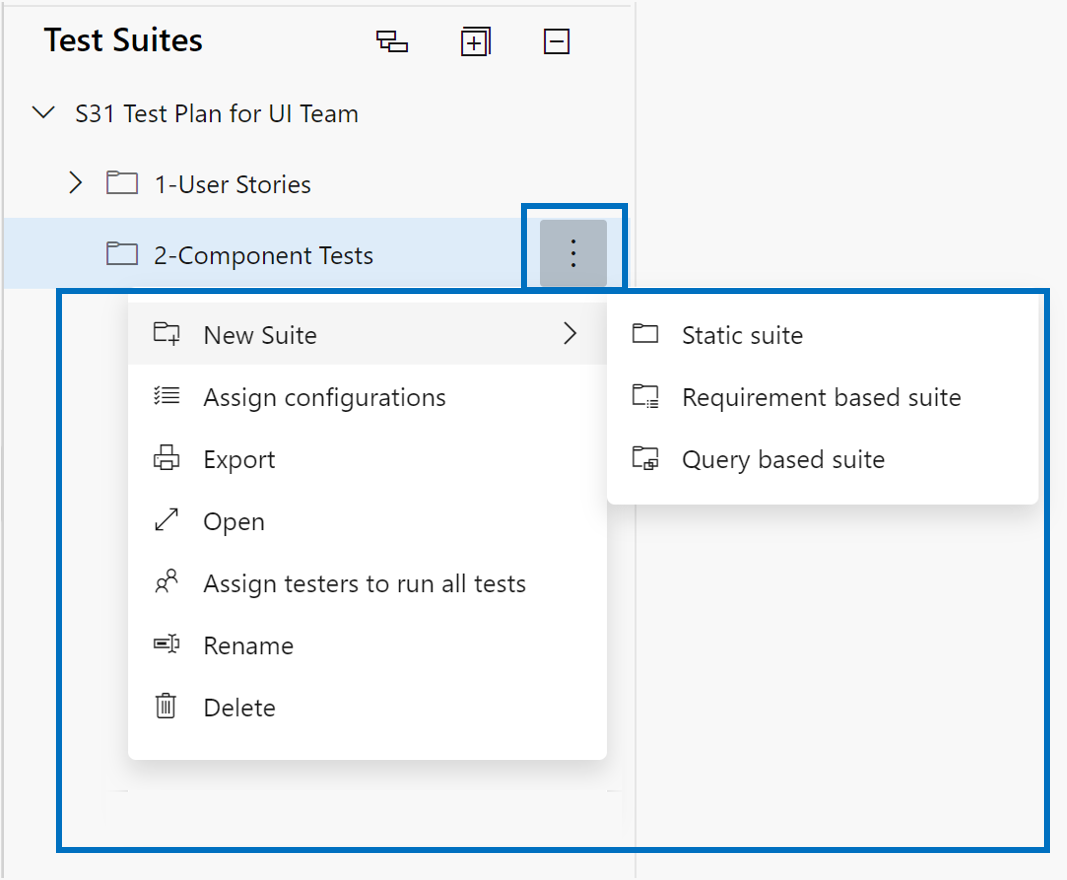
Tasks
The Test suite header allows you to perform the following tasks:
- Expand/collapse: This toolbar options allows you to expand or collapse the suite hierarchy tree.
- Show test points from child suites: This toolbar option is only visible when you are in the "Execute" tab. This allows you to view all the test points for the given suite and its children in one view for easier management of test points without having to navigate to individual suites one at a time.
- Order suites: You can drag/drop suites to either reorder the hierarchy of suites or move them from one suite hierarchy to another within the test plan.
Context menu options
The context menu on the Test suites tree provides the following options:
- Create new suites: You can create 3 different types of suites as follows:
- Use static suite or folder suite to organize your tests.
- Use requirement-based suite to directly link to the requirements/user stories for seamless traceability.
- Use query-based to dynamically organize test cases that meet a query criteria.
- Assign configurations: You can assign configurations for the suite (example: Chrome, Firefox, EdgeChromium) and these would then be applicable to all the existing test cases or new test cases that you add later to this suite.
- Export as pdf/email: Export the Test plan properties, test suite properties along with details of the test cases and test points as either "email" or "print to pdf".
- Open test suite work item: This option allows you to edit the Test suite work item form to manage the work item fields.
- Assign testers to run all tests: This option is very useful for User Acceptance testing (UAT) scenarios where the same test needs to be run/executed by multiple testers, generally belonging to different departments.
- Rename/Delete: These options allow you to manage the suite name or remove the suite and its content from the test plan.
3. Define tab

Define tab lets you collate, add and manage test cases for a test suite. Whereas the execute tab is for assigning test points and executing them.
The Define tab and certain operations are only available to users with Basic + Test Plans access level or equivalent. Everything else should be exercisable by a user with 'Basic' access level.
Tasks
The Define tab allows you to perform the following tasks:
- Add New test case using work item form: This option allows you to create a new test case using the work item form. The test case created will automatically be added to the suite.
- Add New test case using grid: This option allows you to create one or more test cases using the test cases grid view. The test cases created will automatically be added to the suite.
- Add Existing test cases using a query: This option allows you to add existing test cases to the suite by specifying a query.
- Order test cases by drag/drop: You can reorder test cases by dragging/dropping of one or more test cases within a given suite. The order of test cases only applies to manual test cases and not to automated tests.
- Move test cases from one suite to another: Using drag/drop, you can move test cases from one test suite to another.
- Show grid: You can use the grid mode for viewing/editing test cases along with test steps.
- Full screen view: You can view the contents of the entire Define tab in a full screen mode using this option.
- Filtering: Using the filter bar, you can filter the list of test cases using the fields of "test case title", "assigned to" and "state". You can also sort the list by clicking on the column headers.
- Column options: You can manage the list of columns visible in the Define tab using "Column options". The list of columns available for selection are primarily the fields from the test case work item form.
Context menu options
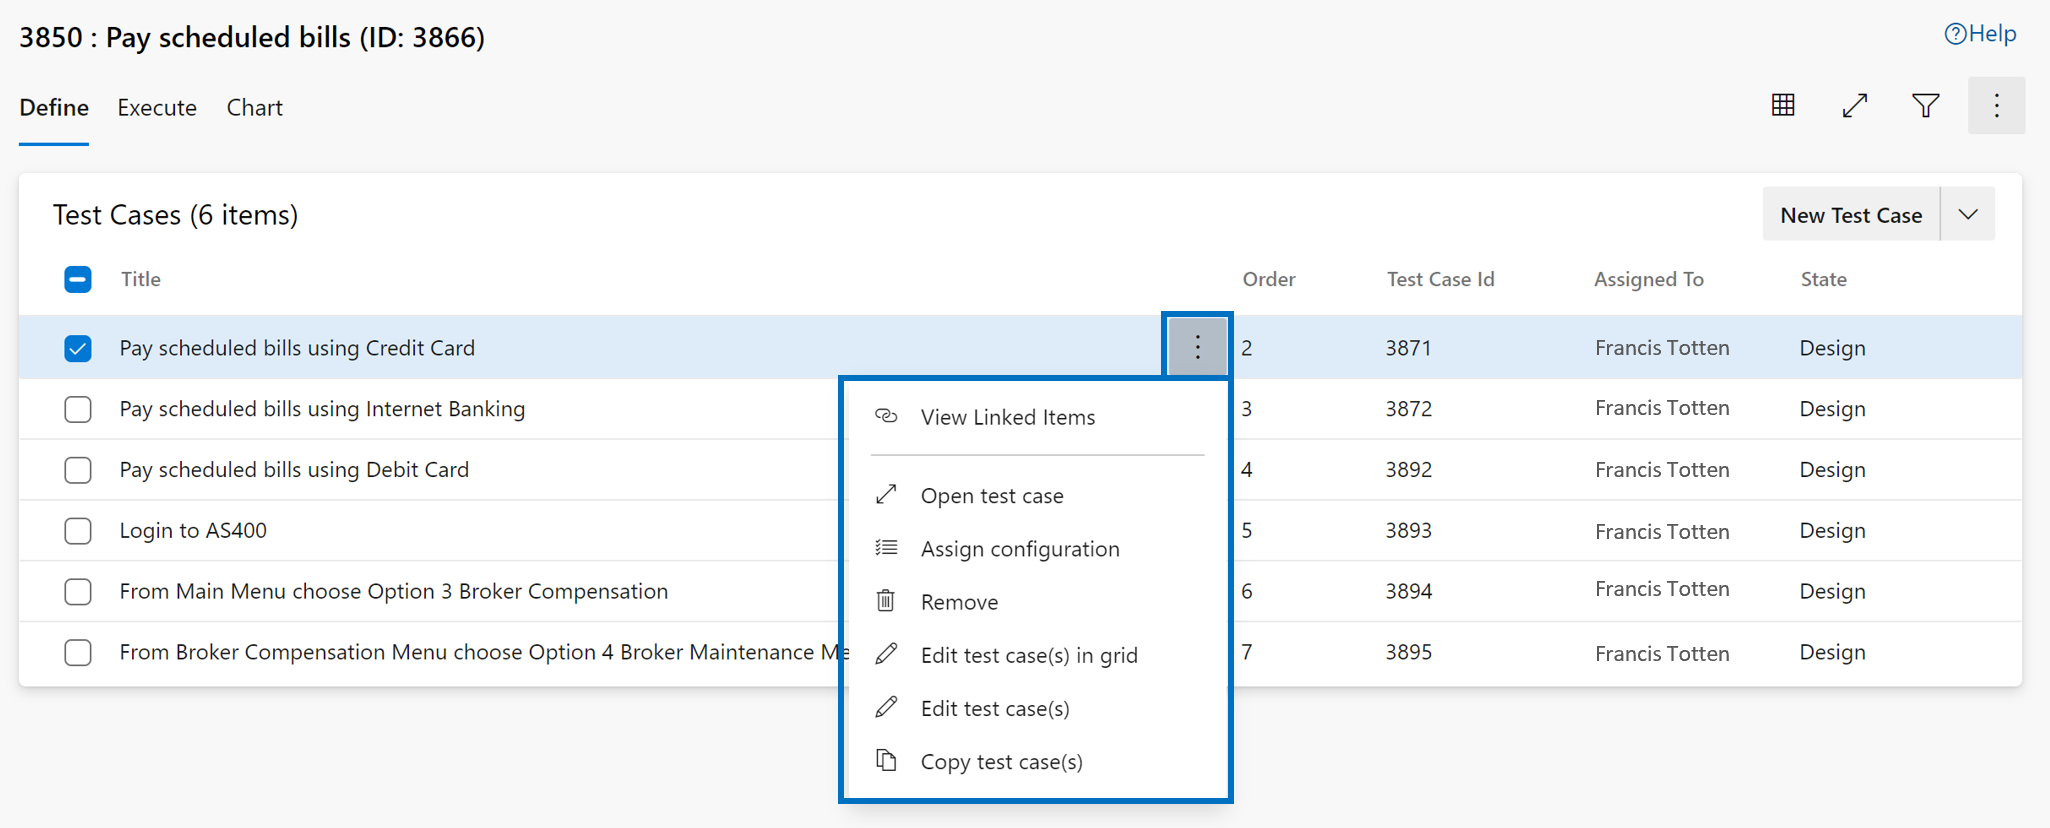
The context menu on the Test case node within the Define tab provides the following options:
- Open/edit test case work item form: This option allows you to edit a Test case using the work item form wherein you edit the work item fields including test steps.
- Edit test cases: This option allows you to bulk edit Test case work item fields. However, you cannot use this option to bulk edit test steps.
- Edit test cases in grid: This option allows you to bulk edit the selected test cases including test steps using the grid view.
- Assign configurations: This option allows you to override the suite level configurations with test case level configurations.
- Remove test cases: This option allows you to remove the test cases from the given suite. It does not change the underlying test case work item though.
- Create a copy/clone of test cases: This option allows you to create a copy/clone of selected test cases. See below for more details.
- View linked items: This option allows you to look at the linked items for a given test case. See below for more details.
Copy/clone test cases (new capability)
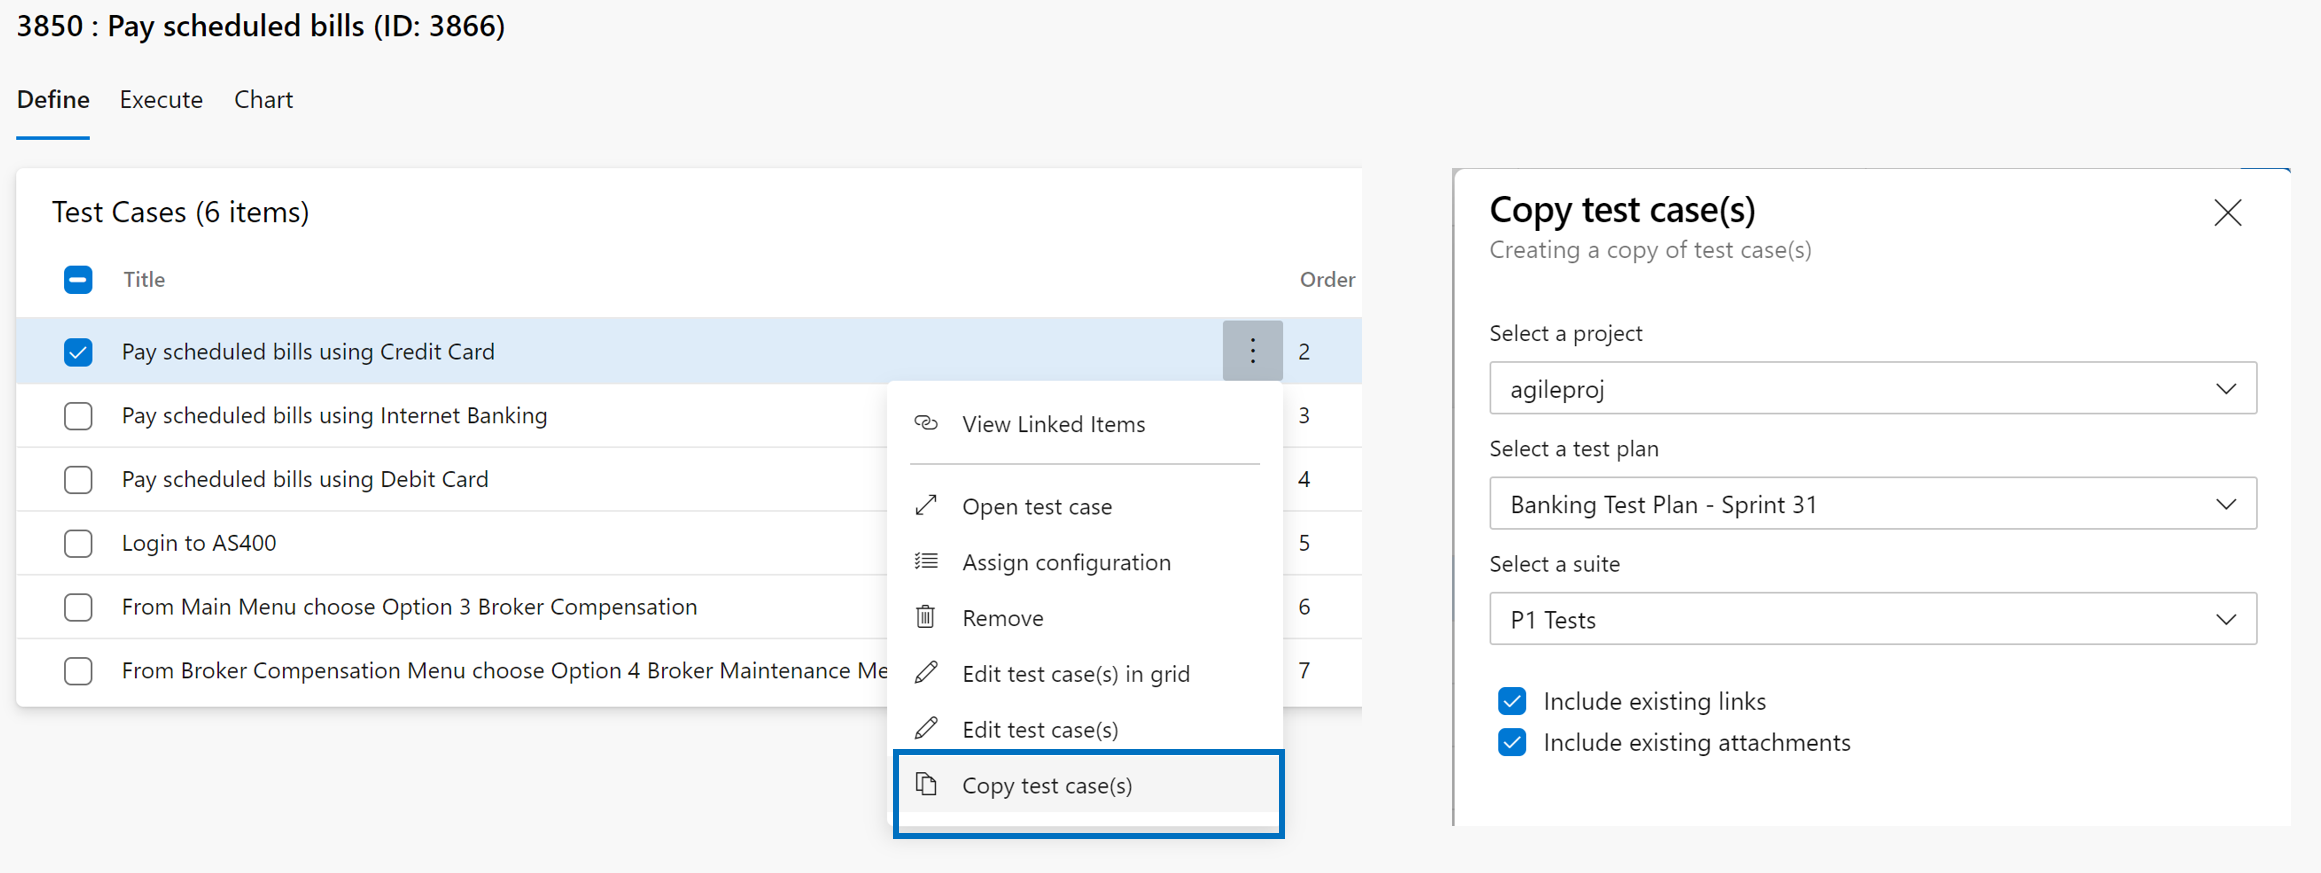
For scenarios where you want to copy/clone a test case, you can use the "Copy test case" option. You can specify the destination project, destination test plan and destination test suite in which to create the copy/cloned test case. In addition, you can also specify whether you want to include existing links/attachments to flow into the cloned copy.
View linked items (new capability)

Traceability among test artifacts, requirements and bugs is a critical value proposition of the Test Plans product. Using the "View linked items" option, you can easily look at all the linked Requirements that this test case is linked with, all the Test suites/Test plans where this test case has been used and all the bugs that have been filed as part of test execution.
4. Execute tab

Define tab lets you collate, add and manage test cases for a test suite. Whereas the execute tab is for assigning test points and executing them.
What is a test point? Test cases by themselves are not executable. When you add a test case to a test suite then test point(s) are generated. A test point is a unique combination of test case, test suite, configuration, and tester. Example: if you have a test case as "Test login functionality" and you add 2 configurations to it as Edge and Chrome then this results in 2 test points. Now these test points can be executed. On execution, test results are generated. Through the test results view (execution history) you can see all executions of a test point. The latest execution for the test point is what you see in the execute tab.
Hence, test cases are reusable entities. By including them in a test plan or suite, test points are generated. By executing test points, you determine the quality of the product or service being developed.
One of the primary benefits of the new page is for users who mainly do test execution/tracking (need to have only 'Basic' access level), they are not overwhelmed by the complexity of suite management (define tab is hidden for such users).
The Define tab and certain operations are only available to users with Basic + Test Plans access level or equivalent. Everything else, including the "Execute" tab should be exercisable by a user with 'Basic' access level.
Tasks
The Execute tab allows you to perform the following tasks:
- Bulk mark test points: This option allows you to quickly mark the outcome of the test points - passed, failed, blocked or not applicable, without having to run the test case via the Test runner. The outcome can be marked for one or multiple test points at one go.
- Run test points: This option allows you to run the test cases by individually going through each test step and marking them pass/fail using a Test runner. Depending upon the application you are testing, you can use the "Web Runner" for testing a "web application" or the "desktop runner" for testing desktop and/or web applications. You can also invoke the "Run with options" to specify a Build against which the testing you want to perform.
- Column options: You can manage the list of columns visible in the Execute tab using "Column options". The list of columns available for selection are associated with test points, such as Run by, Assigned Tester, Configuration, etc.
- Full screen view: You can view the contents of the entire Execute tab in a full screen mode using this option.
- Filtering: Using the filter bar, you can filter the list of test points using the fields of "test case title", "assigned to", "state", "test outcome", "Tester" and "Configuration". You can also sort the list by clicking on the column headers.
Context menu options
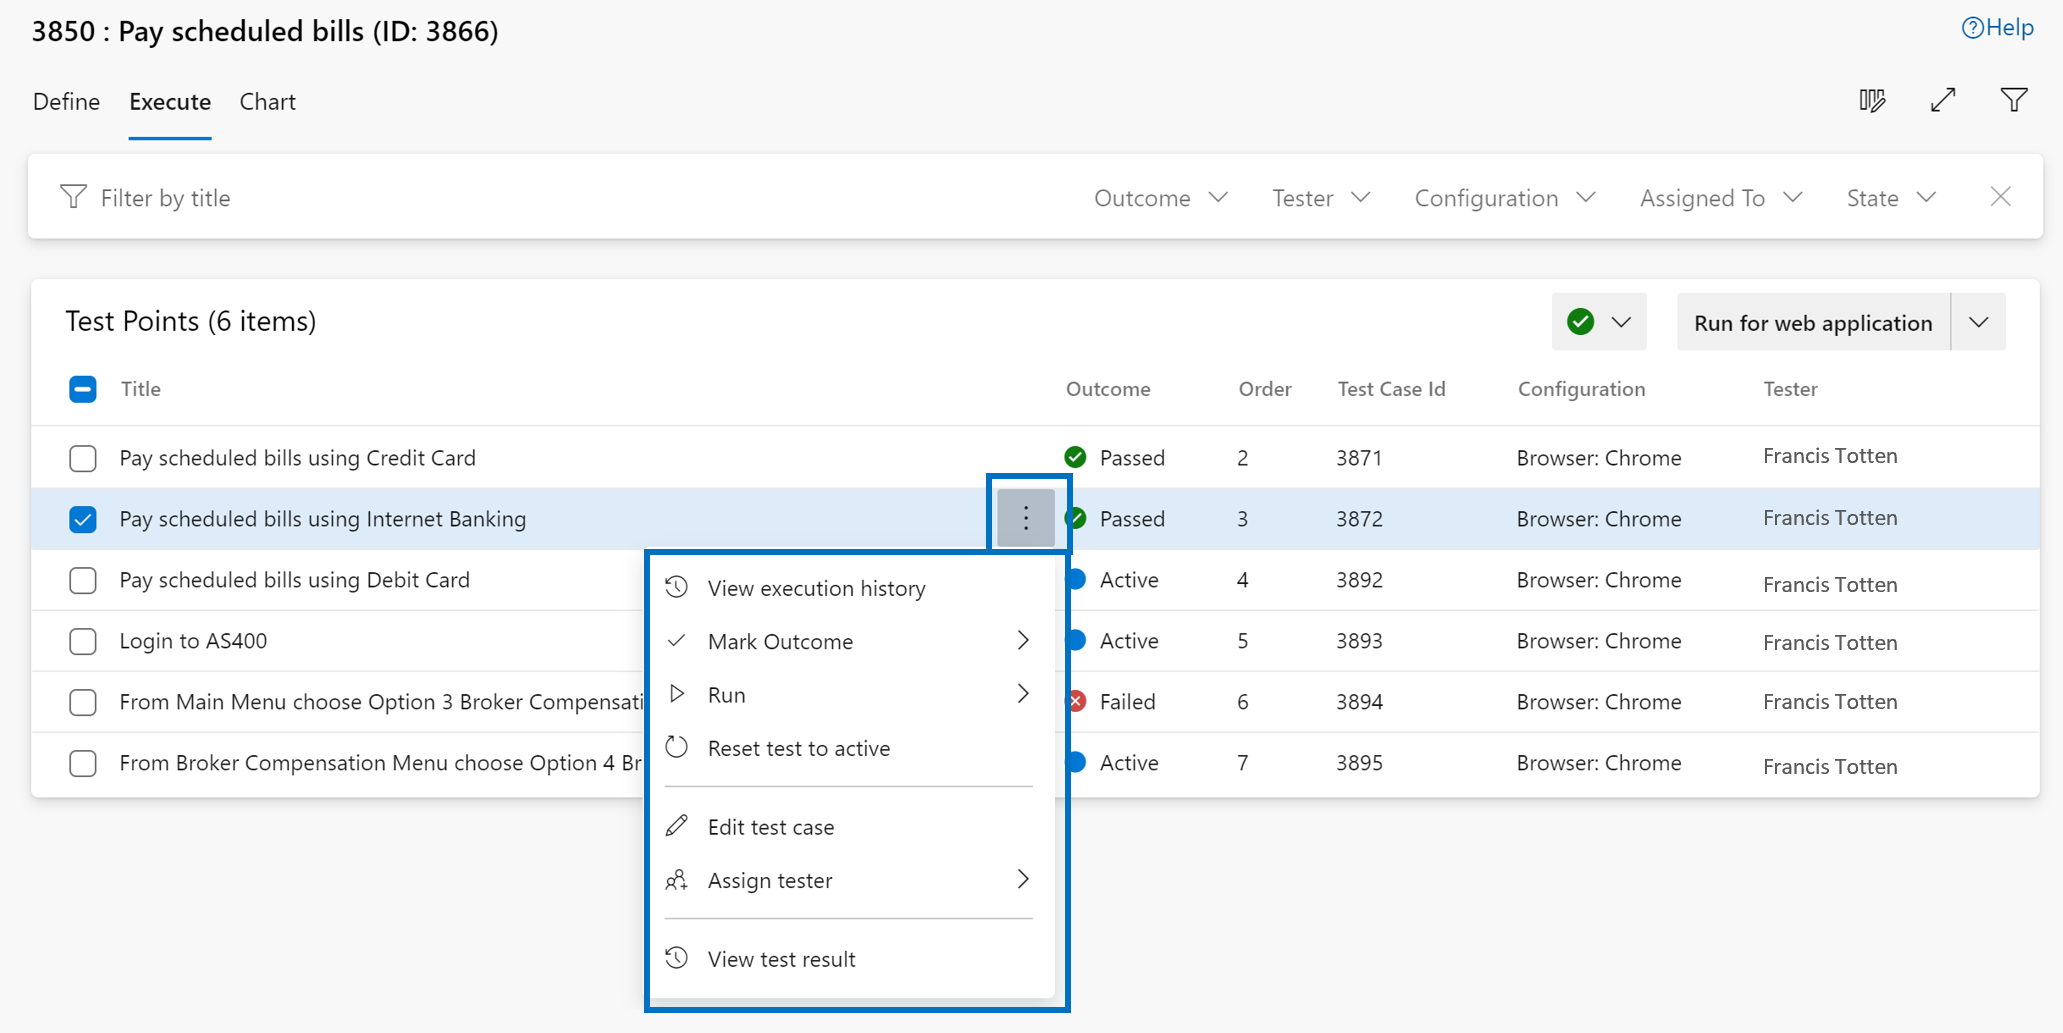
The context menu on the Test point node within the Execute tab provides the following options:
- Mark test outcome: Same as above, allows you to quickly mark the outcome of the test points - passed, failed, blocked or not applicable.
- Run test points: Same as above, allows you to run the test cases via test runner.
- Reset test to active: This option allows you to reset the test outcome to active, thereby ignoring the last outcome of the test point.
- Open/edit test case work item form: This option allows you to edit a Test case using the work item form wherein you edit the work item fields including test steps.
- Assign tester: This option allows you to assign the test points to testers for test execution.
- View test result: This option allows you to view the latest test outcome details including the outcome of each test step, comments added or bugs filed.
- View execution history: This option allows you to view the entire execution history for the selected test point. It opens up a new page wherein you can adjust the filters to view the execution history of not just the selected test point but also for the entire test case.
Test Plans Progress report
This out-of-the-box report helps you track the execution and status of one or more Test Plans in a project. Visit Test Plans > Progress report* to start using the report.
The three sections of the report include the following:
- Summary: shows a consolidated view for the selected test plans.
- Outcome trend: renders a daily snapshot to give you an execution and status trendline. It can show data for 14 days (default), 30 days, or a custom range.
- Details: this section lets you drill down by each test plan and gives you important analytics for each test suite.
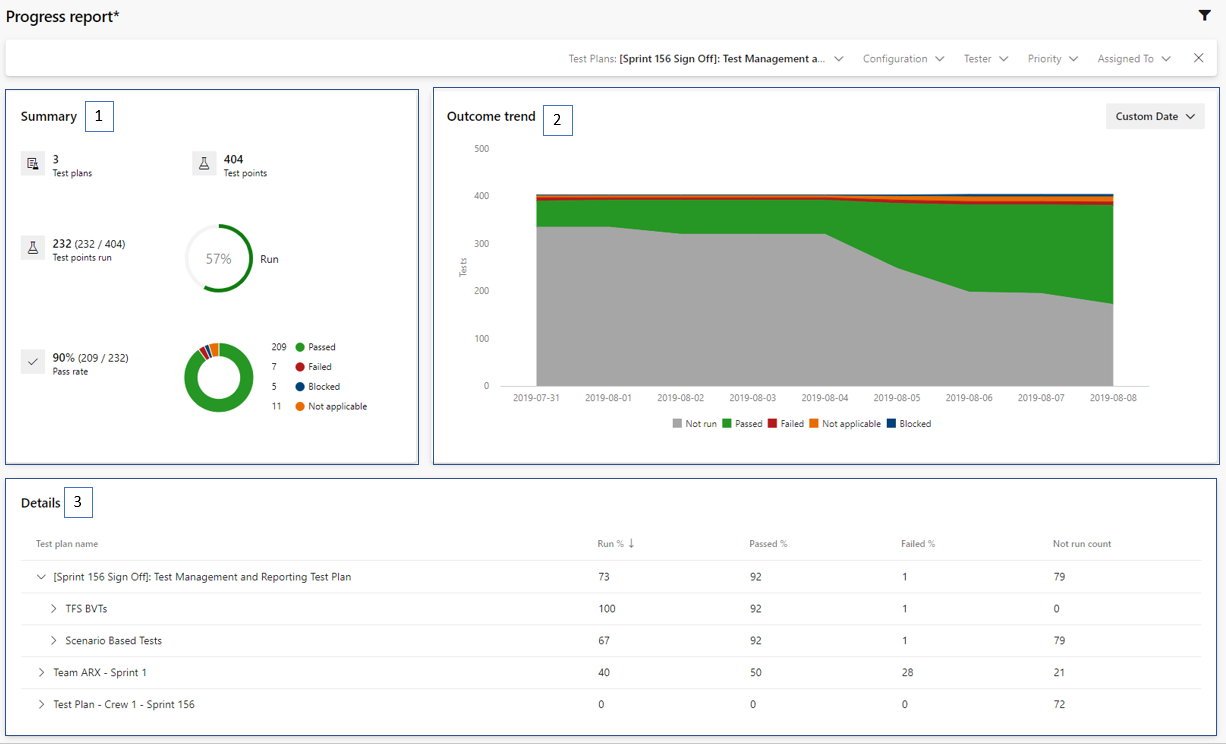
Artifacts
Note
Azure DevOps Server 2020 does not import feeds that are in the recycle bin during data import. If you wish to import feeds which are in the recycle bin, please restore them from the recycle bin before starting data import.
License expressions and embedded licenses
Now you can see the details of license information for NuGet packages stored in Azure Artifacts while browsing packages in Visual Studio. This applies to licenses which are represented using license expressions or embedded licenses. Now you can see a link to the license information in the Visual Studio package details page (red arrow in the image below).
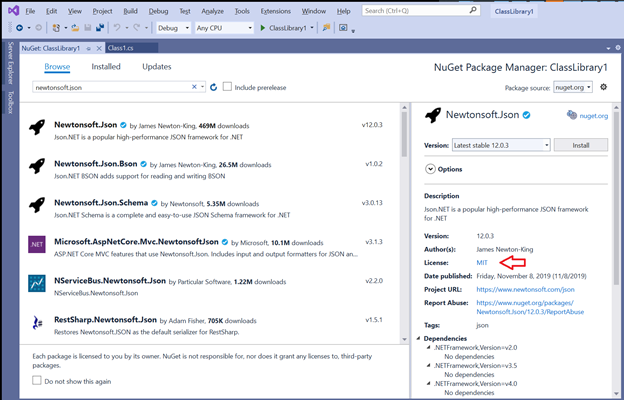
Clicking on the link will take you to a web page where you can view the details of the license. This experience is the same for both license expressions and embedded licenses, so you can see license details for packages stored in Azure Artifacts in one place (for packages which specify license information and are supported by Visual Studio).
Lightweight authentication tasks
You can now authenticate with popular package managers from Azure Pipelines using light-weight authentication tasks. This includes NuGet, npm, PIP, Twine, and Maven. Previously, you could authenticate with these package managers using tasks which provided a large amount of functionality, including the ability to publish and download packages. However, this required using these tasks for all activities which interacted with the package managers. If you had your own scripts to run for performing tasks like publishing or downloading packages, you would not be able to use them in your Pipeline. Now, you can use scripts of your own design in your pipeline YAML and perform authentication with these new lightweight tasks. An example using npm:

The use of the "ci" and "publish" command in this illustration are arbitrary, you could use any commands supported by Azure Pipelines YAML. This enables you to have complete control of command invocation and makes it easy to use shared scripts in your pipeline configuration. For more information, please see the NuGet, npm, PIP, Twine, and Maven authentication task documentation.
Improvements to feed page load time
We are excited to announce that we have improved the feed page load time. On average, feed page load times have decreased by 10%. The largest feeds have seen the most improvement the 99th percentile feed page load time (load times in the highest 99% of all feeds) decreased by 75%.
Share your packages publicly with public feeds
You can now create and store your packages inside public feeds. Packages stored within public feeds are available to everyone on the internet without authentication, whether or not they're in your collection, or even logged into an Azure DevOps collection. Learn more about public feeds in our feeds documentation or jump right into our tutorial for sharing packages publicly.
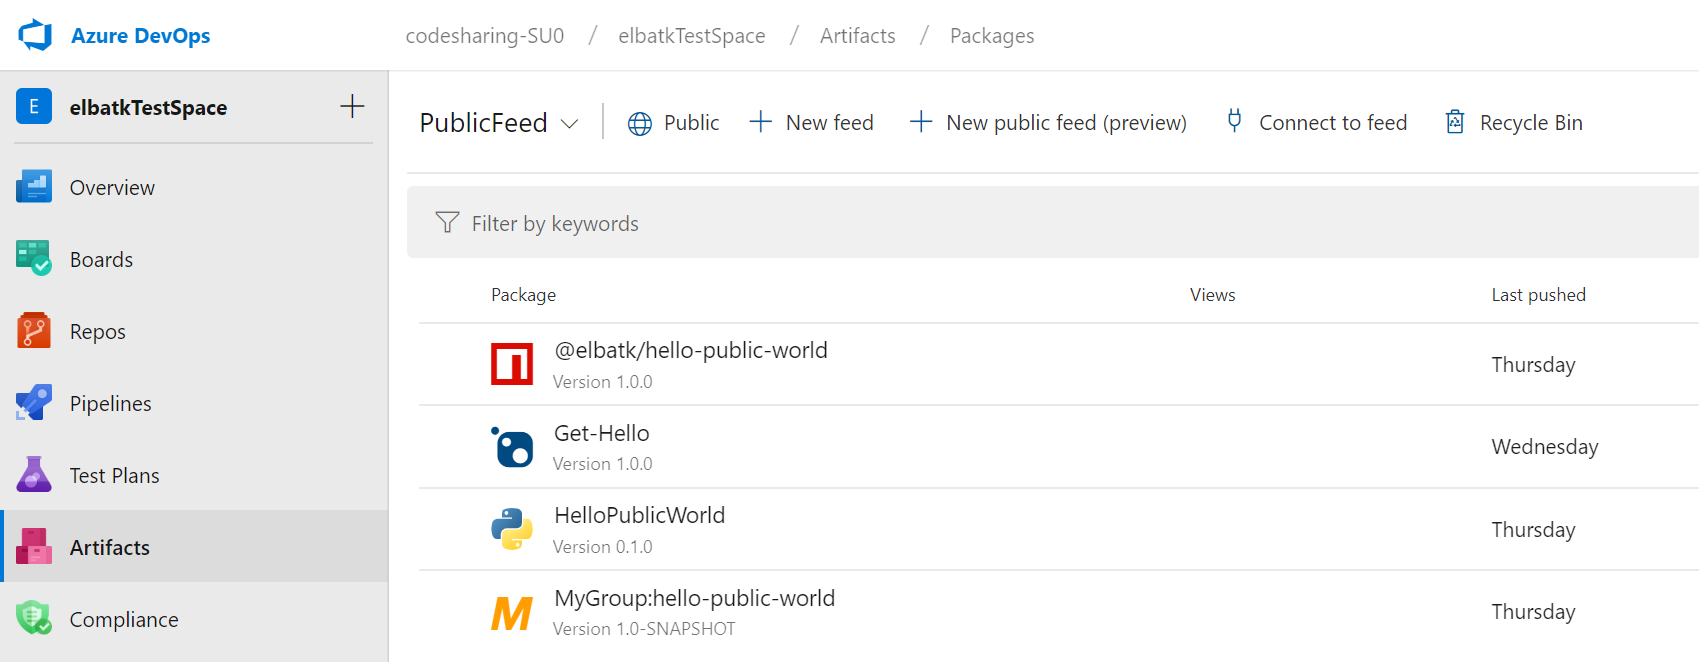
Configure upstreams in different collections within an AAD tenant
You can now add a feed in another collection associated with your Azure Active Directory (AAD) tenant as an upstream source to your Artifacts feed. Your feed can find and use packages from the feeds that are configured as upstream sources, allowing packages to be shared easily across collections associated with your AAD tenant. See how to set this up in the docs.
Use the Python Credential Provider to authenticate pip and twine with Azure Artifacts feeds
You can now install and use the Python Credential Provider (artifacts-keyring) to automatically set up authentication to publish or consume Python packages to or from an Azure Artifacts feed. With the credential provider, you don't have to set up any configuration files (pip.ini/pip.conf/.pypirc), you will simply be taken through an authentication flow in your web browser when calling pip or twine for the first time. See more information in the documentation.
Azure Artifacts feeds in the Visual Studio Package Manager
We now show package icons, descriptions, and authors in the Visual Studio NuGet Package Manager for packages served from Azure Artifacts feeds. Previously, most of this metadata was not provided to VS.
Updated Connect to feed experience
The Connect to feed dialog is the entryway to using Azure Artifacts; it contains information on how to configure clients and repositories to push and pull packages from feeds in Azure DevOps. We've updated the dialog to add detailed set-up information and expanded the tools we give instructions for.
Public feeds are now generally available with upstream support
The public preview of public feeds has received great adoption and feedback. In this release, we extended additional features to general availability. Now, you can set a public feed as an upstream source from a private feed. You can keep your config files simple by being able to upstream both to and from private and project-scoped feeds.
Create project-scoped feeds from the portal
When we released public feeds, we also released project-scoped feeds. Until now, project-scoped feeds could be created via REST APIs or by creating a public feed and then turning the project private. Now, you can create project-scoped feeds directly in the portal from any project if you have the required permissions. You can also see which feeds are project and which are collection-scoped in the feed picker.
npm performance improvements
We have made changes to our core design to improve the way we store and deliver npm packages in Azure Artifacts feeds. This has helped us achieve up to 10-fold reduction in latency for some of the highest used APIs for npm.
Accessibility improvements
We have deployed fixes to address accessibility issues on our feeds page. The fixes include the following:
- Create feed experience
- Global feed settings experience
- Connect to feed experience
Wiki
Rich editing for code wiki pages
Previously, when editing a code wiki page, you were redirected to the Azure Repos hub for editing. Currently, the Repo hub is not optimized for markdown editing.
Now you can edit a code wiki page in the side-by-side editor inside wiki. This lets you use the rich markdown toolbar to create your content making the editing experience identical to the one in project wiki. You can still choose to edit in repos by selecting the Edit in Repos option in the context menu.
Create and embed work items from a wiki page
As we listened to your feedback, we heard that you use wiki to capture brainstorming documents, planning documents, ideas on features, spec documents, minutes of meeting. Now you can easily create features and user stories directly from a planning document without leaving the wiki page.
To create a work item select the text in the wiki page where you want to embed the work item and select New work item. This saves you time since you don't have to create the work item first, go to edit and then find the work item to embed it. It also reduces context switch as you don’t go out of the wiki scope.
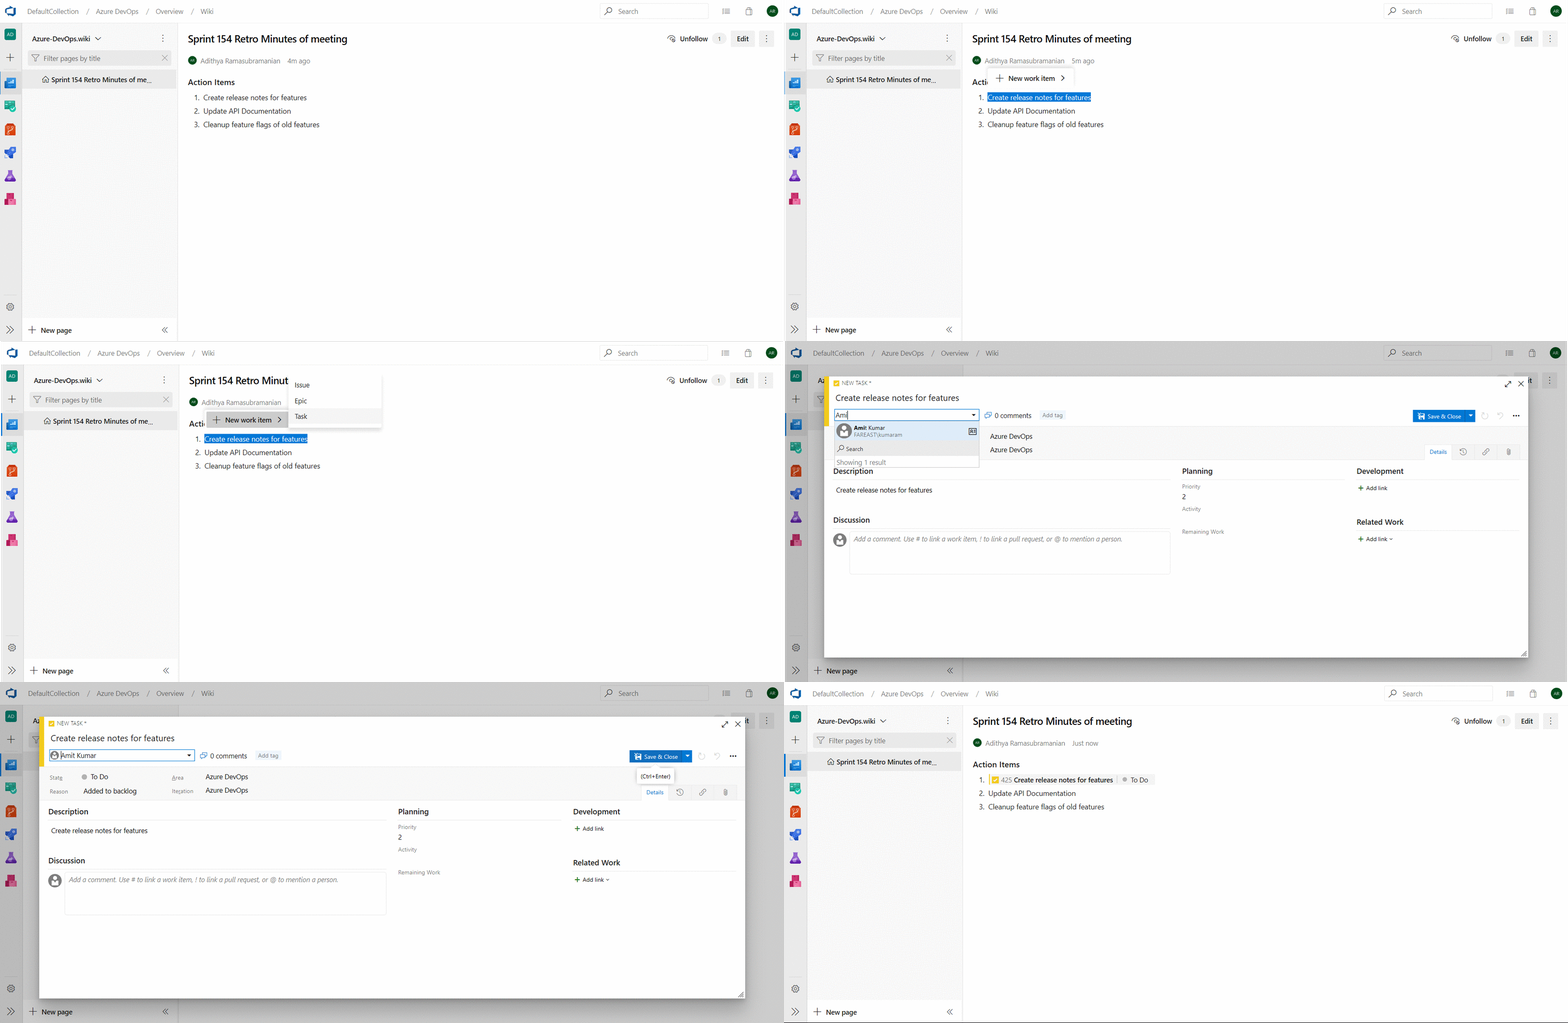
To learn more about creating and embedding a work item from wiki, see our documentation here.
Comments in wiki pages
Previously, you didn't have a way to interact with other wiki users inside the wiki. This made collaborating on content and getting questions answered a challenge since conversations had to happen over mail or chat channels. With comments, you can now collaborate with others directly within the wiki. You can leverage the @mention users functionality inside comments to draw the attention of other team members. This feature was prioritized based on this suggestion ticket. For more on comments, please see our documentation here.
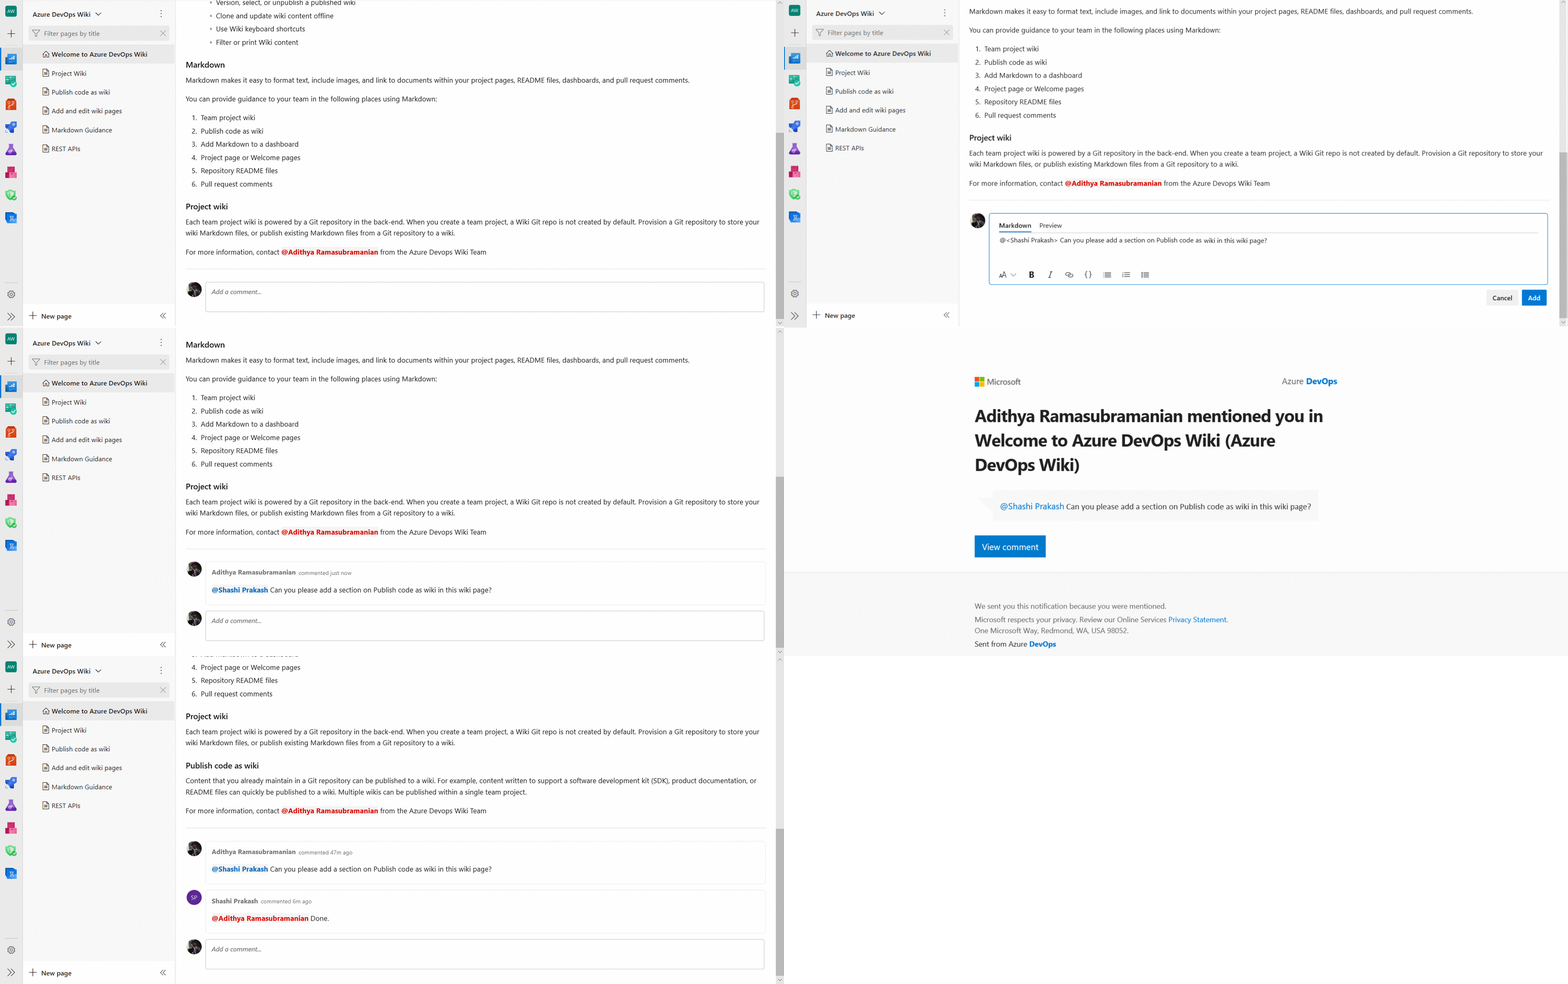
Hide folders and files starting with “.” in wiki tree
Until now, the wiki tree showed all the folders and files starting with a dot (.) in the wiki tree. In code wiki scenarios, this caused folders like .vscode, which are meant to be hidden, to show up in the wiki tree. Now, all the files and folders starting with a dot will remain hidden in the wiki tree hence reducing unnecessary clutter.
This feature was prioritized based on this suggestion ticket.
Short and readable Wiki page URLs
You no longer have to use a multiline URL to share wiki page links. We are leveraging the page IDs in the URL to remove parameters hence making the URL shorter and easier to read.
The new structure of URLs will look like:
https://dev.azure.com/{accountName}/{projectName}/_wiki/wikis/{wikiName}/{pageId}/{readableWiki PageName}
This is an example of the new URL for a Welcome to Azure DevOps Wiki page:
https://dev.azure.com/microsoft/ AzureDevOps/_wiki/wikis/AzureDevOps.wiki/1/Welcome-to-Azure-DevOps-Wiki
This was prioritized based on this feature suggestion ticket from the Developer Community.
Synchronous scroll for editing wiki pages
Editing wiki pages is now easier with synchronous scroll between the edit and the preview pane. Scrolling on one side will automatically scroll the other side to map the corresponding sections. You can disable the synchronous scroll with the toggle button.

Note
The state of the synchronous scroll toggle is saved per user and account.
Page visits for wiki pages
You can now get insights into the page visits for wiki pages. The REST API let you access the page visits information in the last 30 days. You can use this data to create reports for your wiki pages. In addition, you can store this data in your data source and create dashboards to get specific insights like top-n most viewed pages.
You will also see an aggregated page visits count for the last 30 days in every page.
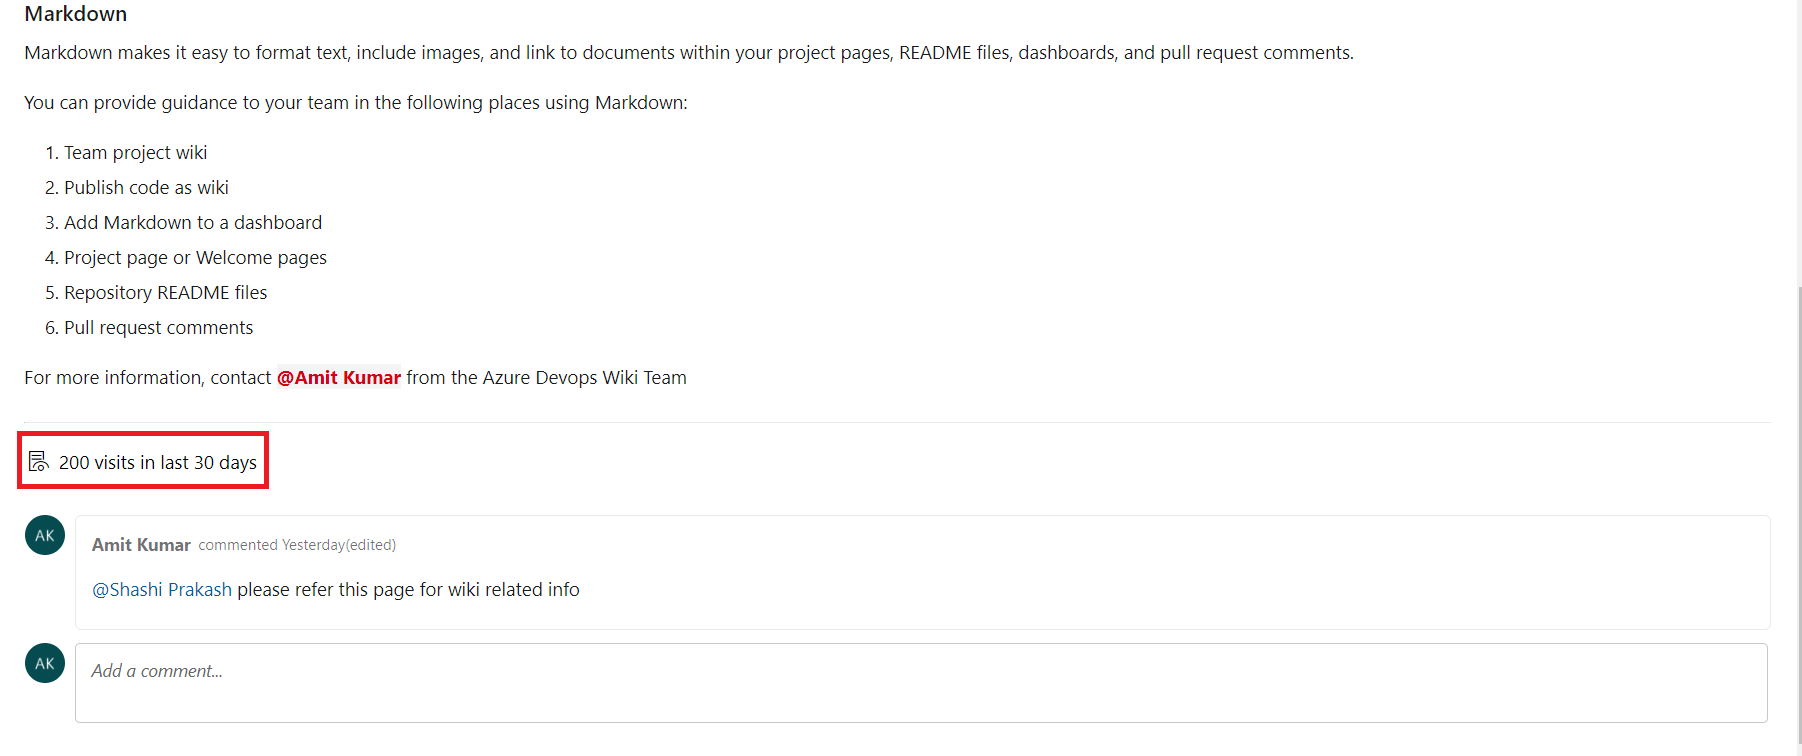
Note
A page visit is defined as a page view by a given user in a 15-minute interval.
Reporting
Pipeline failure and duration reports
Metrics and insights help you continuously improve the throughput and stability of your pipelines. We have added two new reports to provide you insights about your pipelines.
- Pipeline failure report shows the build pass rate and the failure trend. In addition, it will also show the tasks failure trend to provide insights on which task in the pipeline is contributing to the maximum number of failures.
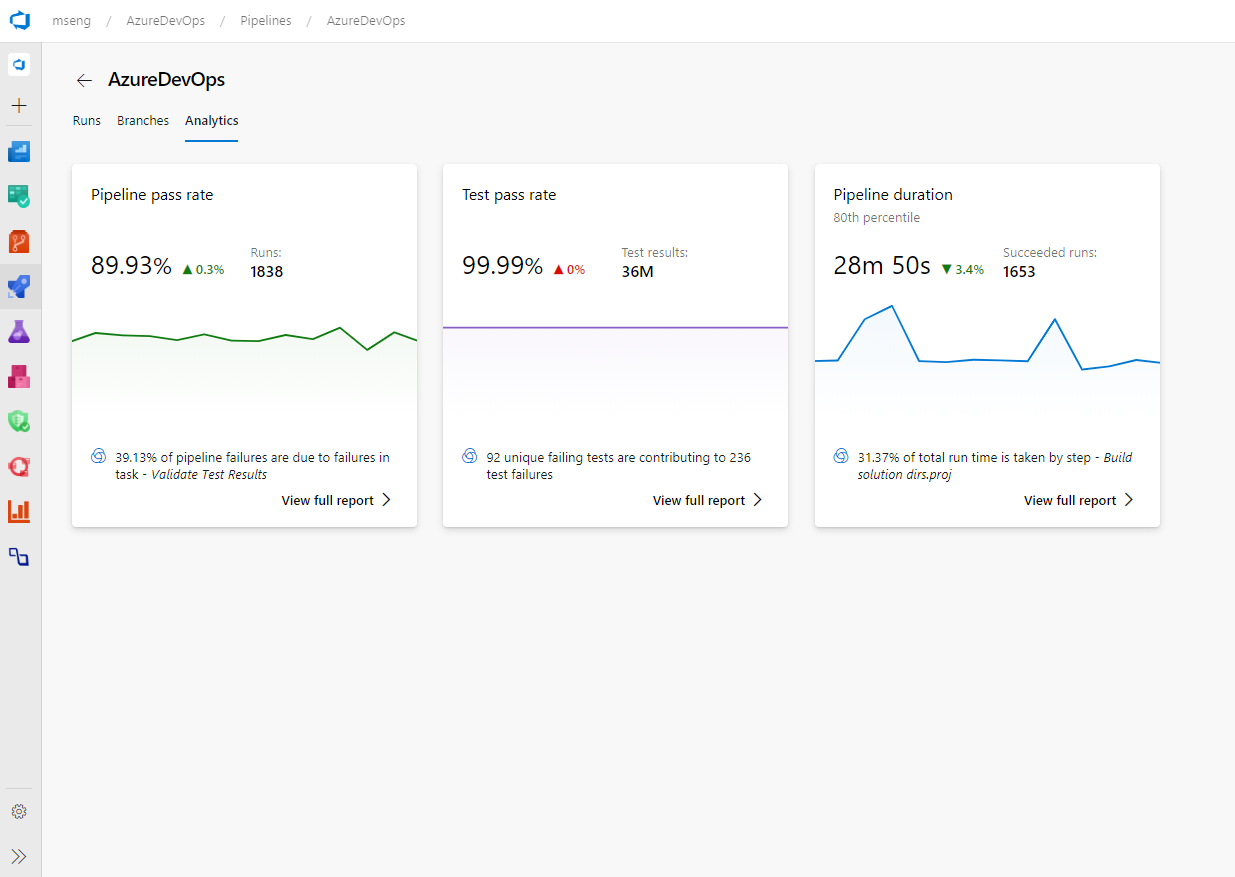
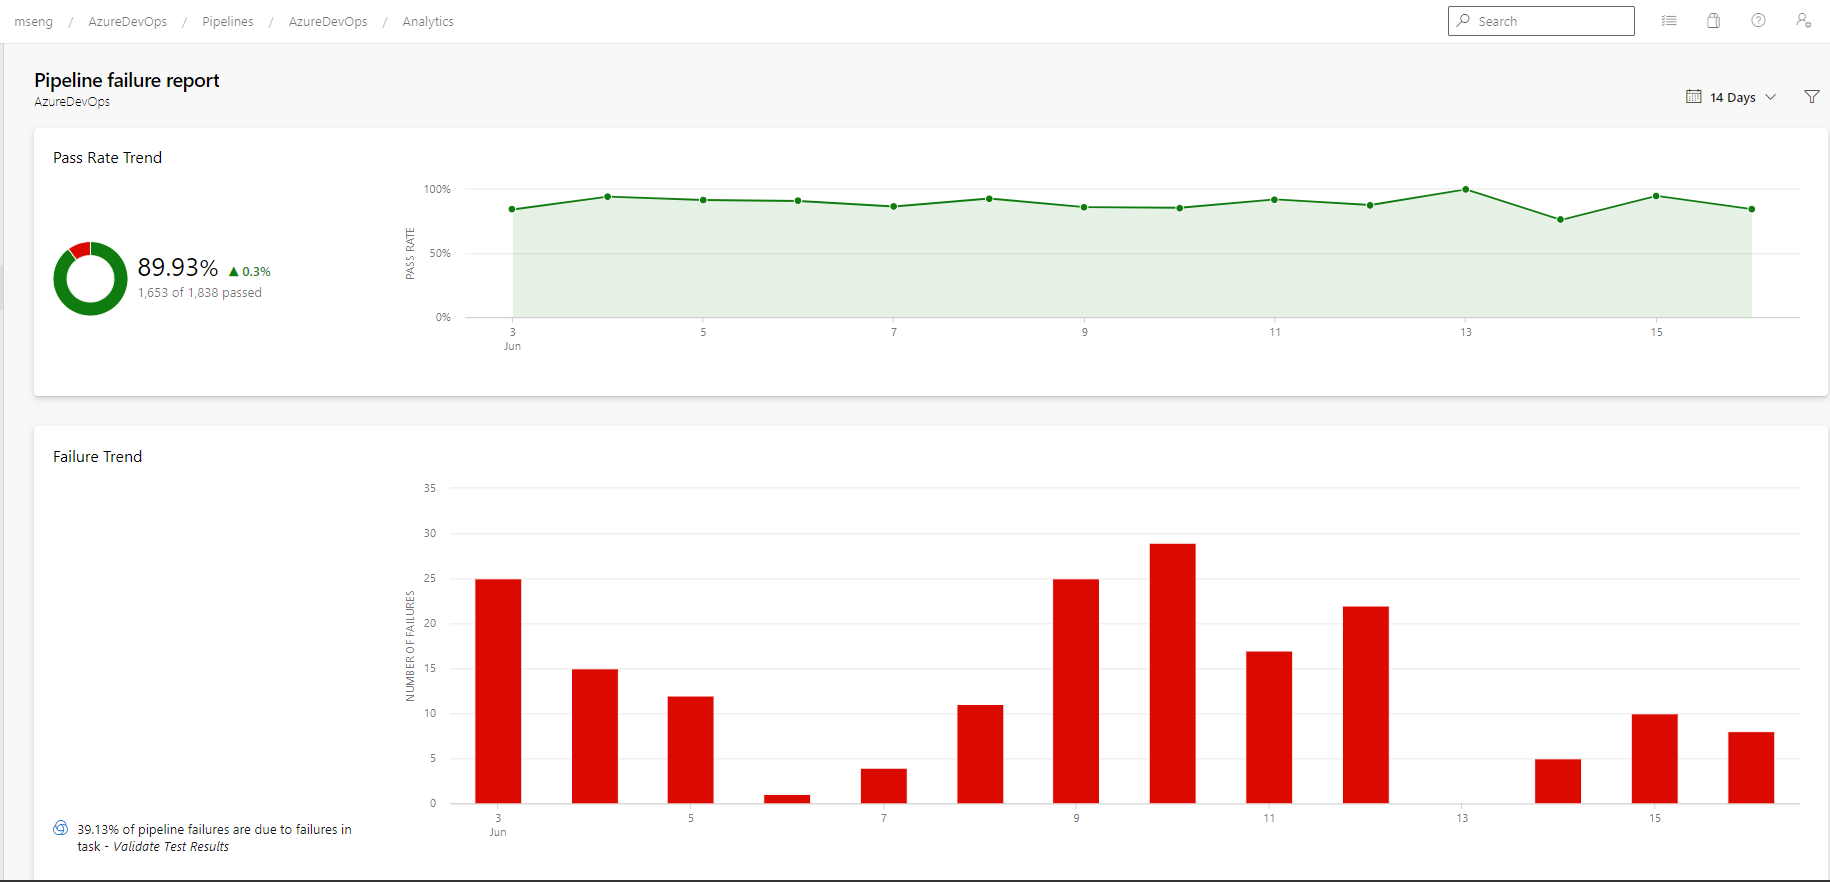
- Pipeline duration report shows the trend of time taken for a pipeline to run. It also shows which tasks in the pipeline are taking the most amount of time.
Improvement to the Query Results widget
The query results widget is one of our most popular widgets, and for good reason. The widget displays the results of a query directly on your dashboard and is useful in many situations.
With this update we included many long-awaited improvements:
- You can now select as many columns as you want to display in the widget. No more 5-column limit!
- The widget supports all sizes, from 1x1 to 10x10.
- When you resize a column, the column width will be saved.
- You can expand the widget to full screen view. When expanded, it will display all the columns returned by the query.
Lead and Cycle Time widgets advanced filtering
Lead and cycle time are used by teams to see how long it takes for work to flow through their development pipelines, and ultimately deliver value to their customers.
Until now, the lead and cycle time widgets did not support advanced filter criteria to ask questions such as: "how long is it taking my team to close out the higher priority items?"
With this update questions like this can be answered by filtering on the Board swimlane.
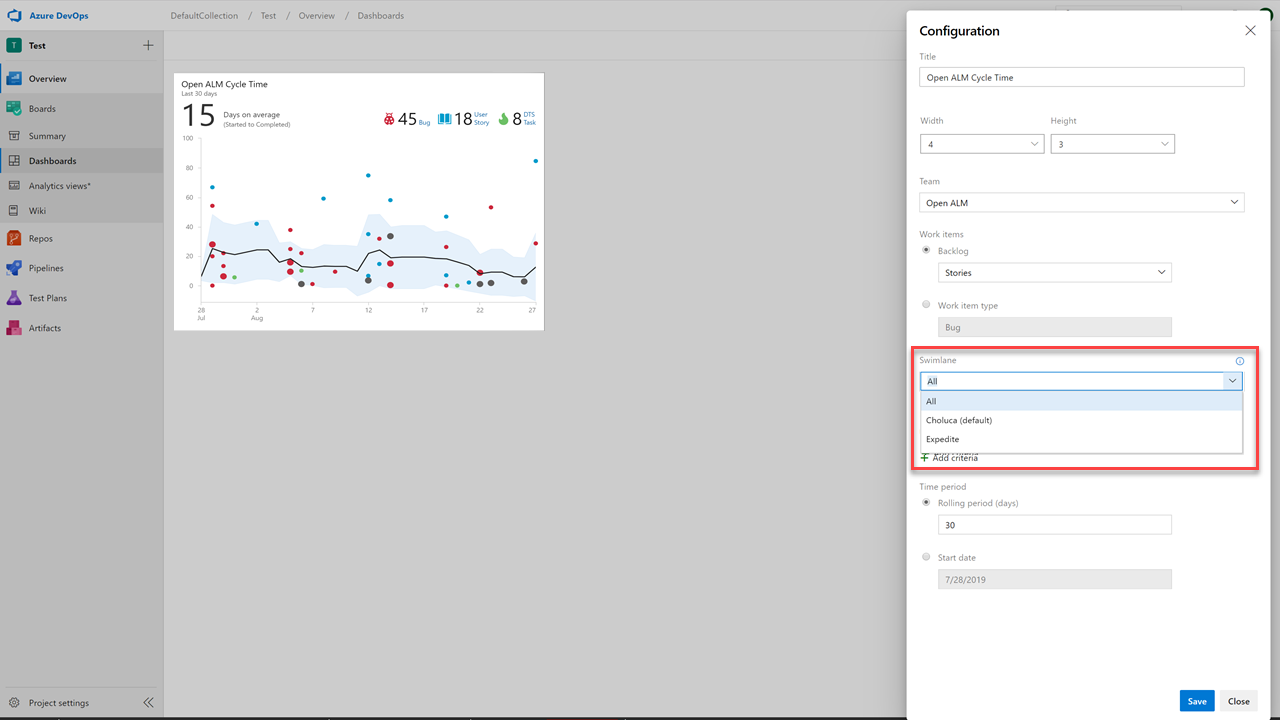
We've also included work item filters in order to limit the work items that appear in the chart.
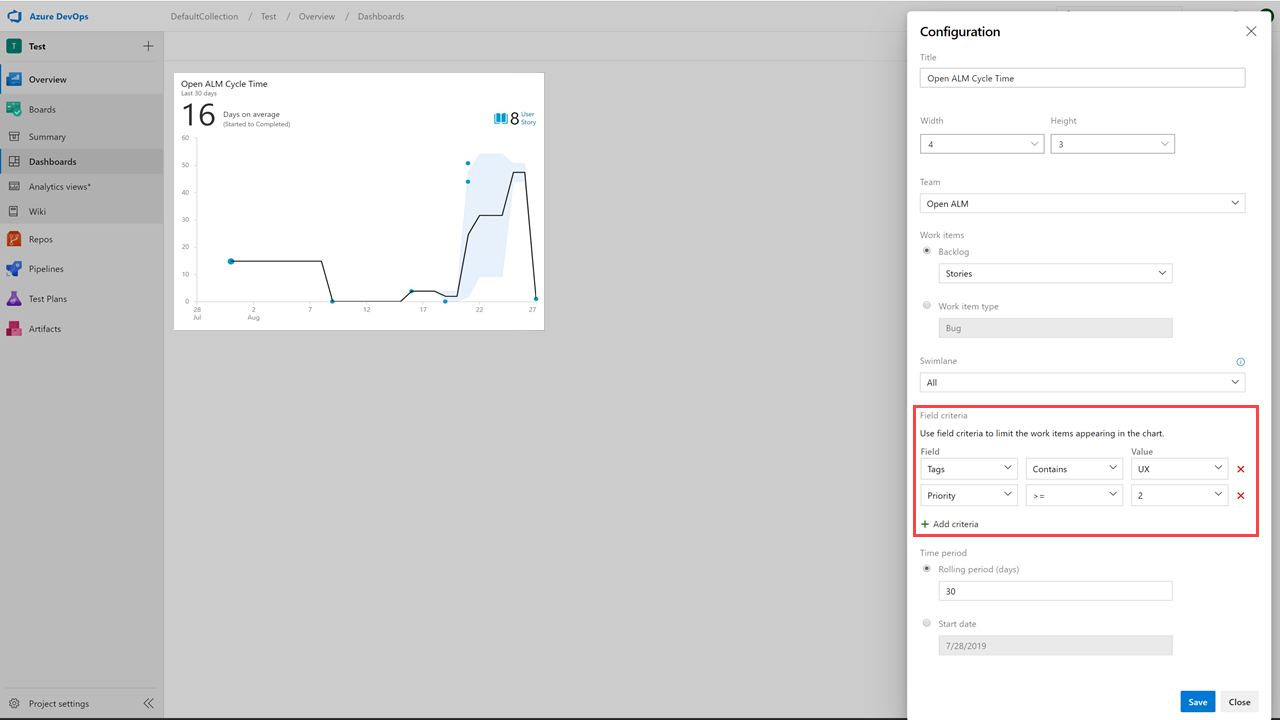
Inline sprint burndown using story points
Your Sprint Burndown can now burndown by Stories. This addresses your feedback from the Developer Community.
From the Sprint hub select the Analytics tab. Then configure you report as follows:
- Select Stories backlog
- Select to burndown on Sum of Story Points
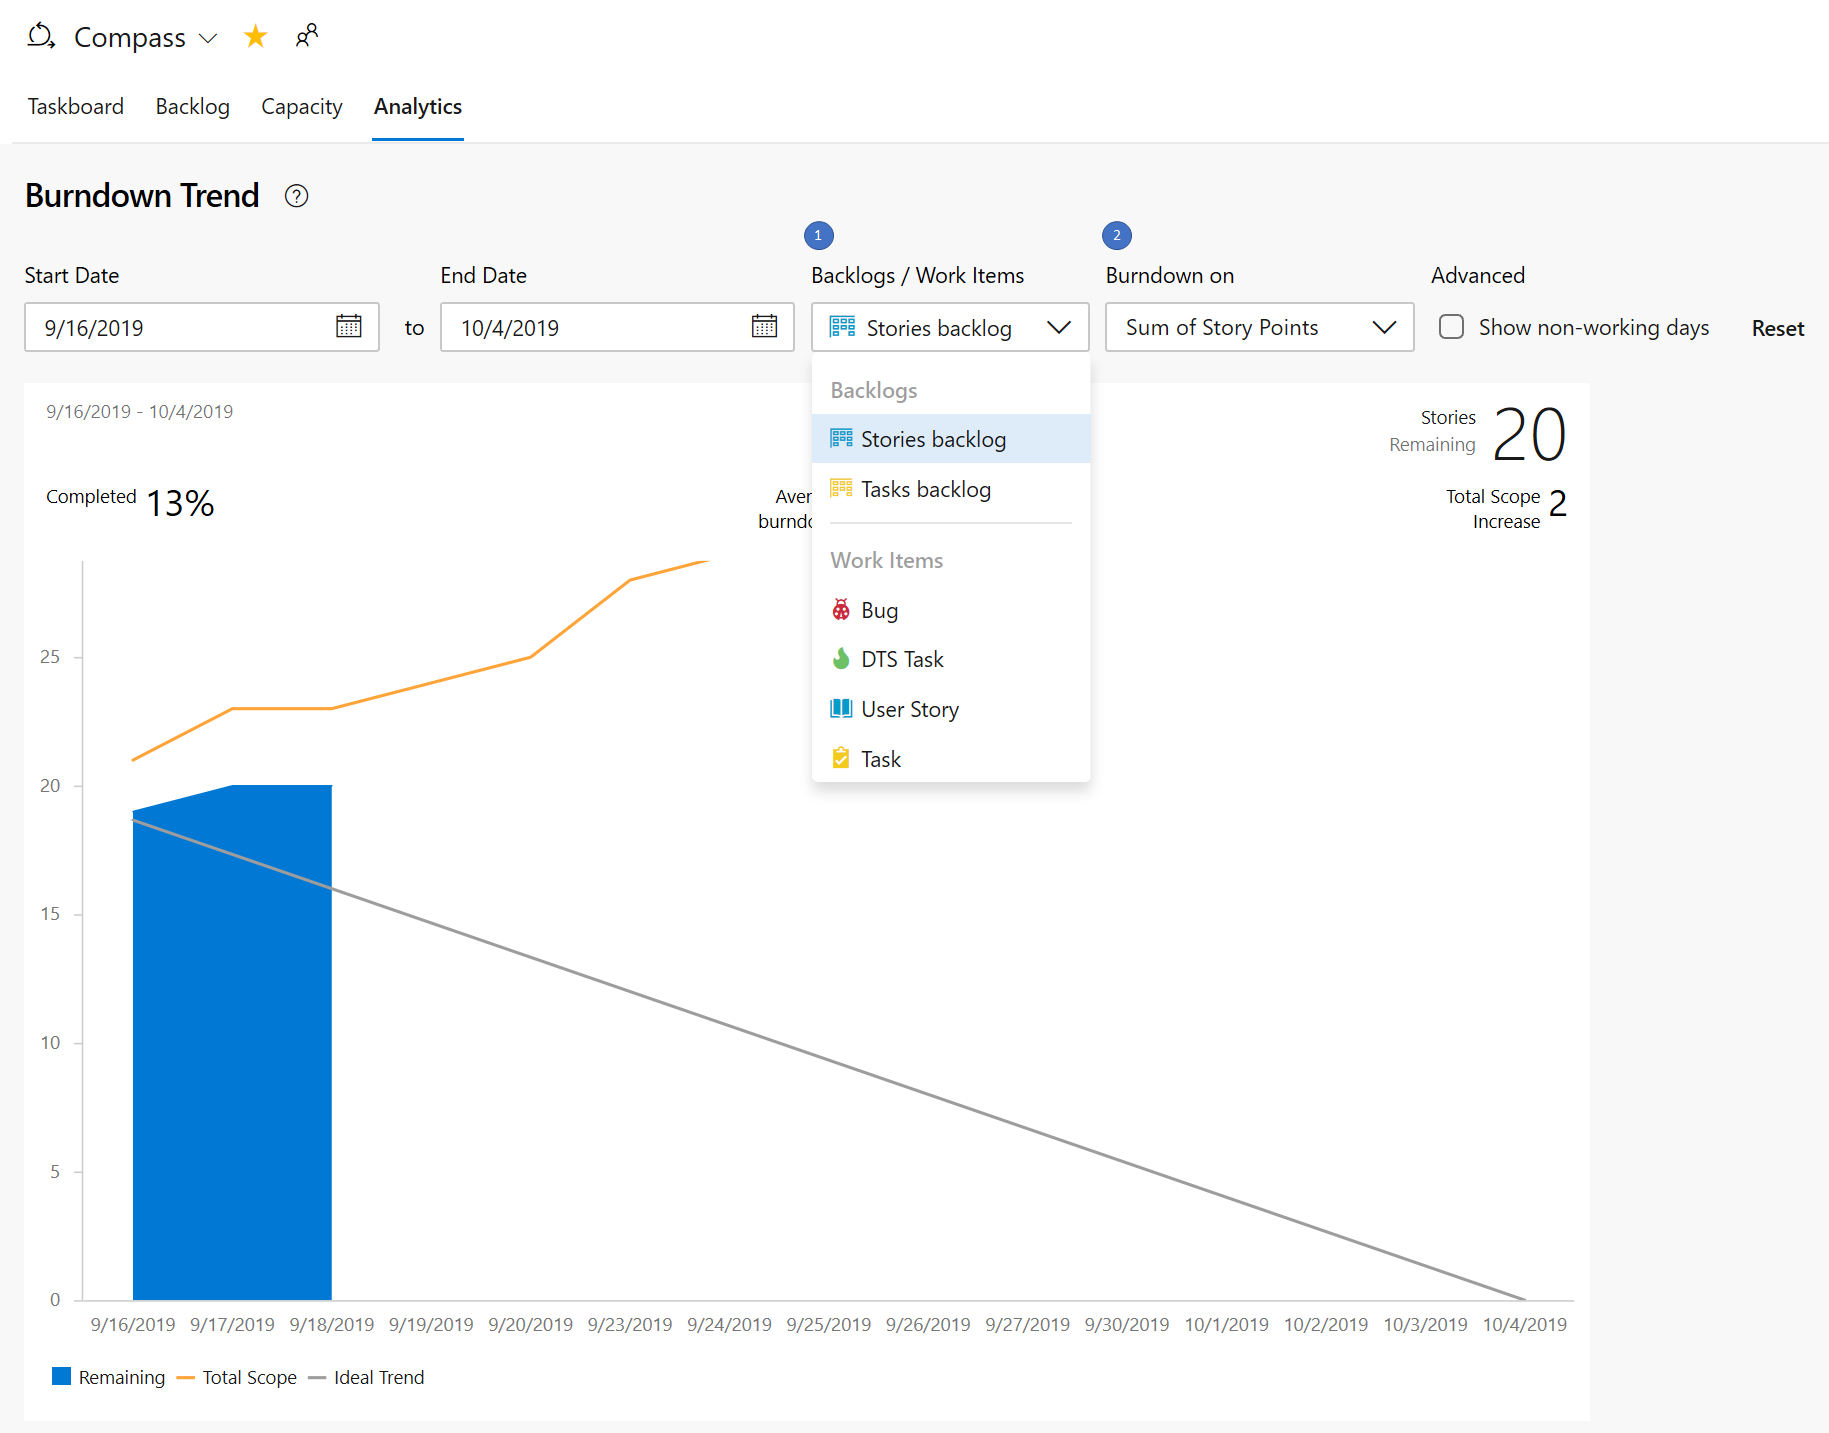
A Sprint Burndown widget with everything you've been asking for
The new Sprint Burndown widget supports burning down by Story Points, count of Tasks, or by summing custom fields. You can even create a sprint burndown for Features or Epics. The widget displays average burndown, % complete, and scope increase. You can configure the team, letting you display sprint burndowns for multiple teams on the same dashboard. With all this great information to display, we let you resize it up to 10x10 on the dashboard.
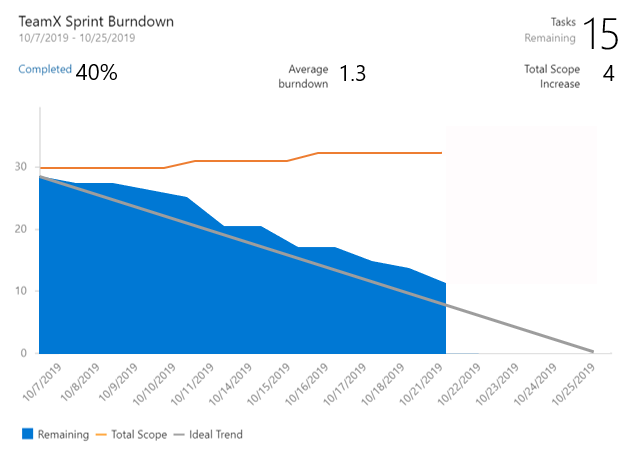
To try it out, you can add it from the widget catalog, or by editing the configuration for the existing Sprint Burndown widget and checking the Try the new version now box.
Note
The new widget uses Analytics. We kept the legacy Sprint Burndown in case you don't have access to Analytics.
Inline sprint burndown thumbnail
The Sprint Burndown is back! A few sprint ago, we removed the in-context sprint burndown from the Sprint Burndown and Taskboard headers. Based on your feedback, we've improved and reintroduced the sprint burndown thumbnail.

Clicking on the thumbnail will immediately display a larger version of the chart with an option to view the full report under the Analytics tab. Any changes made to the full report will be reflected in the chart displayed in the header. So you can now configure it to burndown based on stories, story points, or by count of tasks, rather than just the amount of work remaining.
Create a dashboard without a team
You can now create a dashboard without associating it with a team. When creating a dashboard, select the Project Dashboard type.
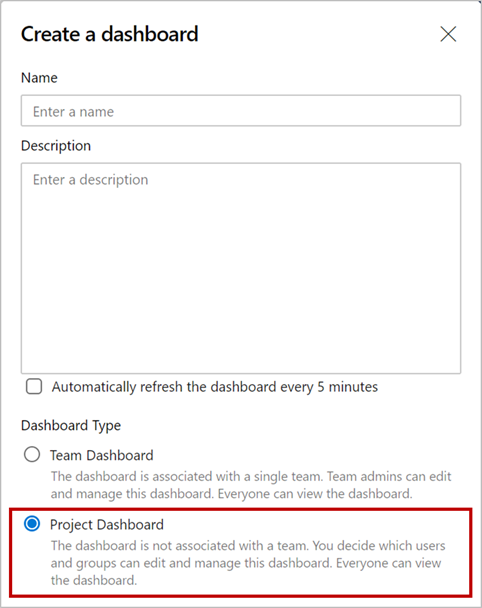
A Project Dashboard is like a Team Dashboard, except it's not associated with a Team and you can decide who can edit/manage the dashboard. Just like a Team Dashboard, it is visible to everyone in the project.
All Azure DevOps widgets that require a team context have been updated to let you select a team in their configuration. You can add these widgets to Project Dashboards and select the specific team you want.

Note
For custom or third-party widgets, a Project Dashboard will pass the default team's context to those widgets. If you have a custom widget that relies on team context, you should update the configuration to let you select a team.
Feedback
We would love to hear from you! You can report a problem or provide an idea and track it through Developer Community and get advice on Stack Overflow.