Create a custom person query
Tip
You can find a demo video, download sample results, and go through a Show me how explanation while you’re building your query. Select these options just above Query setup.

Overview
Each of these steps takes place within one section of the advanced insights app's Custom queries > Person query page.
Note
If you're an existing Viva Insights customer, refer to the note in the Introduction for more information about using the new platform.
To run a person query, you'll follow five basic steps:
- Set up your query.
- Add metrics.
- Add conditions and condition groups.
- Add employee attributes.
- Run your query.
In this article, we talk about how to complete each of these steps, and also give some important background information about how metrics, conditions, and attributes work.
Set up your query
Section: Query setup
The following steps are optional. We describe default values below.
Under Query setup:
Name your query. Queries are assigned a default name, which follows this format: Query type, user ID, date, and time. Make sure the name is unique.
Select a Time period. This field defaults to Last 3 months, but you can select another time period you want your query to analyze. Pick from Last 1 year, Last 6 months, Last 1 month, or a Custom date range. If you choose a Custom date range, use the date picker to select the range.
Set the query to automatically update by selecting the Auto-Refresh box. When you select the auto-refresh option, your query automatically runs and computes a new result every time Viva Insights gets updated collaboration data for licensed people. This option is deselected by default, but you can select it on any query where the Time period isn’t customized.
Note
If the organizational data used in an auto-refreshing query changes (for example, an attribute name is altered or an attribute is removed), you might see an error when you run the query.
Type a Description.
Set how the query is grouped. By default, custom person queries are grouped by Month. To change this setting to Week, select More Settings beneath the Description box.
Selecting More Settings brings you to the More Settings pane. Along with Group by, this pane shows the metric rules that apply to your query. To find out more about metric rules that apply to your query, select See metric rule details.
Note
Metrics are criteria used to measure the productivity and wellbeing of employees, and metric rules are rules Viva Insights uses to improve the accuracy of your query results.
To learn more about metrics used in Viva Insights, refer to Metric definitions. To learn more about metric rules, refer to Metric rules.
Add metrics
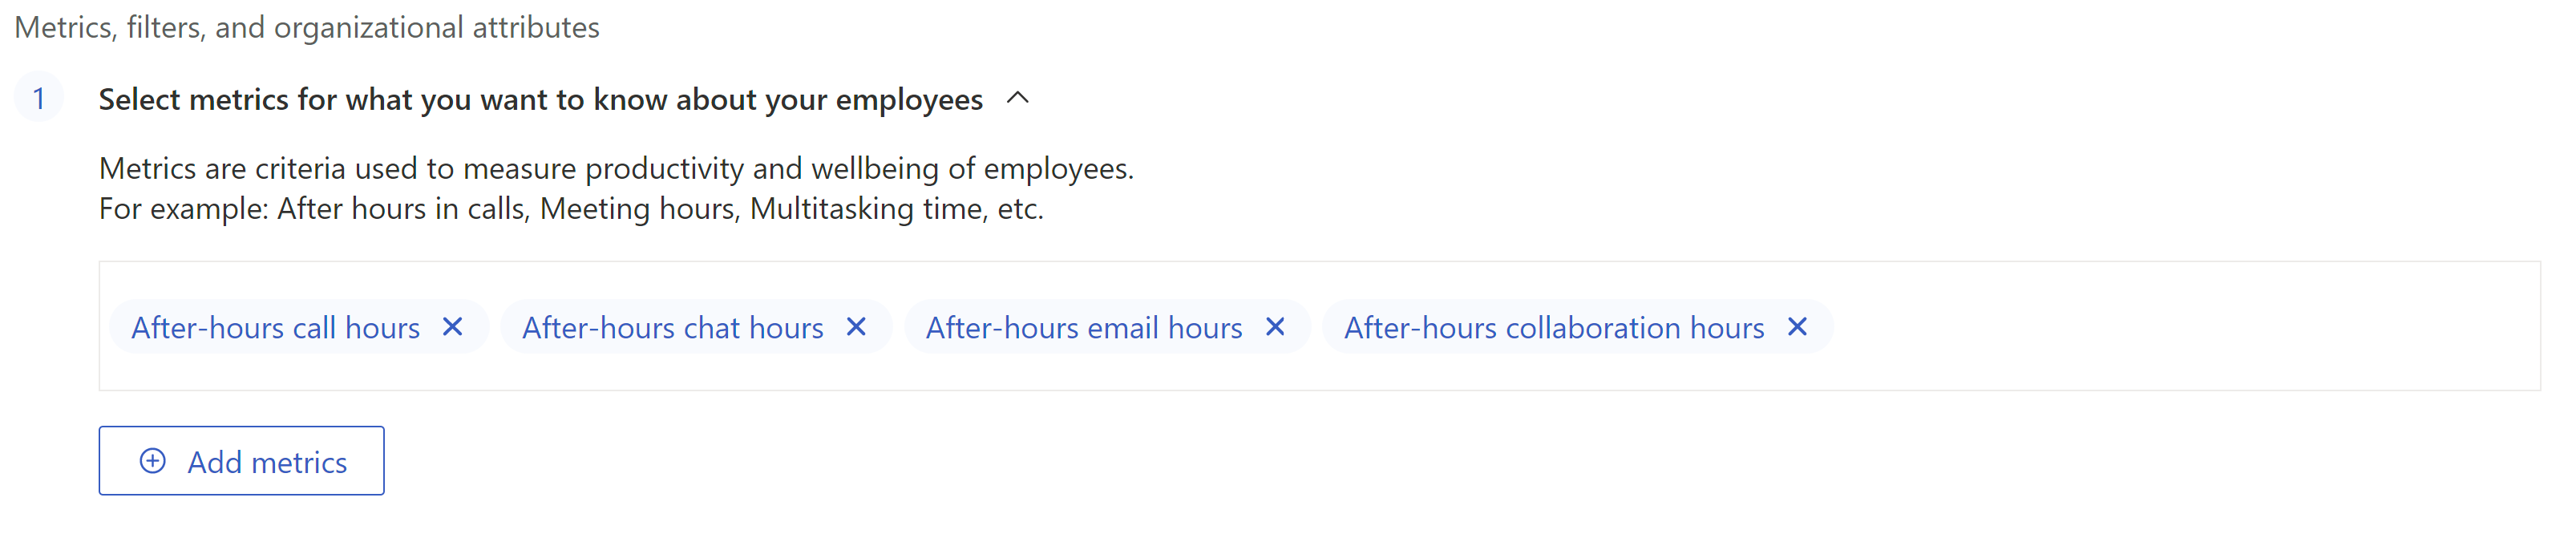
Section: Select metrics for what you want to know about your employees
Under Select metrics for what you want to know about your employees, select the Add metrics button.
The Add metrics button brings you to the Select metrics pane. Using the check marks and the tools described later in this section (filter, search, and groupings) select the metrics you want to use in the query, then select Add to query.
The Add to query button adds these metrics into your query and takes you back to the setup screen. The metrics you selected appear as tags in the box beneath the section description.
You can also add Microsoft 365 Copilot metrics to your custom person query. These metrics provide insights around how employees are using Microsoft Copilot with Microsoft 365 apps, and they’re part of your .csv output file. To include these metrics when you’re setting up your query, select Include Microsoft 365 Copilot metrics in this query.
Here is a list of these Copilot metrics that you can use for your query:
Metric Description Date from when the data is available and the customers can view Meetings summarized by Copilot The number of meetings summarized by Copilot. 10/15/2023 Chat conversation summaries created by Copilot The number of times users summarized chats and channel conversations in Teams using Copilot. 10/15/2023 Chat message drafts composed using Copilot The number of chat and channel message drafts created in Teams using Copilot. 10/15/2023 Email drafts generated by Copilot The number email drafts users generated using Copilot. 11/15/2023 Email coaching actions taken using Copilot Number of times users selected email coaching with Copilot. 11/15/2023 Email thread summaries created by Copilot Number of times users summarized email conversations with Copilot. 11/15/2023 Document drafts created by Copilot The number of times users drafted Word documents with Copilot. 10/15/2023 Document summaries created by Copilot The number of times users summarized Word documents using Copilot. 10/15/2023 Presentations created by Copilot Number of times users created PowerPoint presentations with Copilot. 10/15/2023 Rewrite text actions taken using Copilot Number of times users modified Word documents with Copilot. 10/15/2023 Presentation summaries created by Copilot Number of times users summarized PowerPoint presentations with Copilot. 10/15/2023 Excel analysis actions taken using Copilot Number of times users analyzed data to show insights as charts, PivotTable objects, summaries, trends, or outliers in Excel with Copilot. 10/15/2023 Excel formulas created by Copilot Number of times users generated new columns with formulas based on Excel data with Copilot. 10/15/2023 Excel formatting actions taken using Copilot Number of times each user highlighted, sorted, and filtered tables in Excel with Copilot. 10/15/2023 Meetings summarized by Copilot Number of meetings summarized with Copilot per user. 12/18/2023 Meeting hours summarized by Copilot The number of hours of meetings summarized by Copilot. 12/18/2023 Chat conversations summarized by Copilot The number of chats and channel conversations summarized by Copilot. 12/18/2023 Emails sent using Copilot The number of emails sent with assistance from Copilot. 11/15/2023 Copilot actions taken in Copilot chat The number of Copilot actions completed by active Copilot users in Copilot chat. 10/15/2023 Copilot actions taken in Excel The number of Copilot actions completed by active Copilot users in Excel. 10/15/2023 Copilot actions taken in Outlook The number of Copilot actions completed by active Copilot users in Outlook. 10/15/2023 Copilot actions taken in PowerPoint The number of Copilot actions completed by active Copilot users in PowerPoint. 10/15/2023 Copilot actions taken in Teams The number of Copilot actions completed by active Copilot users in Teams. 10/15/2023 Copilot actions taken in Word The number of Copilot actions completed by active Copilot users in Word. 10/15/2023 Days of active Copilot usage in Excel The number of days the user actively used Copilot in Excel. 10/15/2023 Days of active Copilot usage in Loop The number of days the user was actively using Copilot in Loop. 10/15/2023 Days of active Copilot usage in OneNote The number of days the user was actively using Copilot in OneNote. 10/15/2023 Days of active Copilot usage in Outlook The number of days the user was actively using Copilot in Outlook. 10/15/2023 Days of active Copilot usage in PowerPoint The number of days the user was actively using Copilot in PowerPoint. 10/15/2023 Days of active Copilot usage in Teams The number of days the user was actively using Copilot in Microsoft Teams. 10/15/2023 Days of active Copilot usage in Word The number of days the user was actively using Copilot in Word. 10/15/2023 Days of active Copilot usage in Copilot chat The number of days the user was actively using Copilot chat. 10/15/2023 Copilot enabled days for Copilot chat The number of days the user had Copilot with Graph-grounded chat enabled. 10/15/2023 Copilot enabled days for Power Platform connectors The number of days the user had Power Platform Connectors in Copilot for Microsoft 365 enabled. 10/15/2023 Copilot enabled days for productivity apps The number of days the user had a Microsoft Copilot apps service plan enabled. 10/15/2023 Copilot enabled days for Intelligent Search The number of days the user had an Intelligent search service plan enabled. 10/15/2023 Copilot enabled days for Teams The number of days the user had a Microsoft Copilot Teams service plan enabled. 10/15/2023 Total Copilot active days The number of days the user was actively using Copilot in any of the apps. 10/15/2023 Total Copilot enabled days The number of days the user had at least one service plan for Microsoft Copilot enabled. 10/15/2023
About metrics
Metrics are criteria used to measure the productivity and wellbeing of employees. For example, if you’re wondering how much time employees spend collaborating after their working hours, you could use the After-hours scheduled call hours and After-hours chat hours metrics in your query.
Select metrics pane
Metric categories
In the Select metrics pane, metrics are grouped by metric category. Expand the categories to see which metrics they contain. Let’s say you were looking for the After-hours scheduled call hours and After-hours chat hours metrics in our earlier example. You’d find them in the After-hours collaboration metric category.
Filters, keyword search, and more information
There are a few other ways you can find metrics to include in your query. You can filter by type (for example, Activity count metrics or Meeting metrics) on the left side of the pane, or use the search bar to find metrics by keyword. If you're working with Power BI templates, use Filter by Power BI templates to pick metrics used in particular reports.
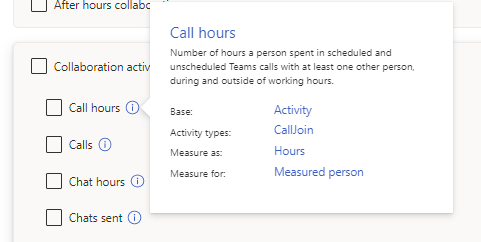
To find out more about a metric, hover over its information icon.
Add conditions and condition groups
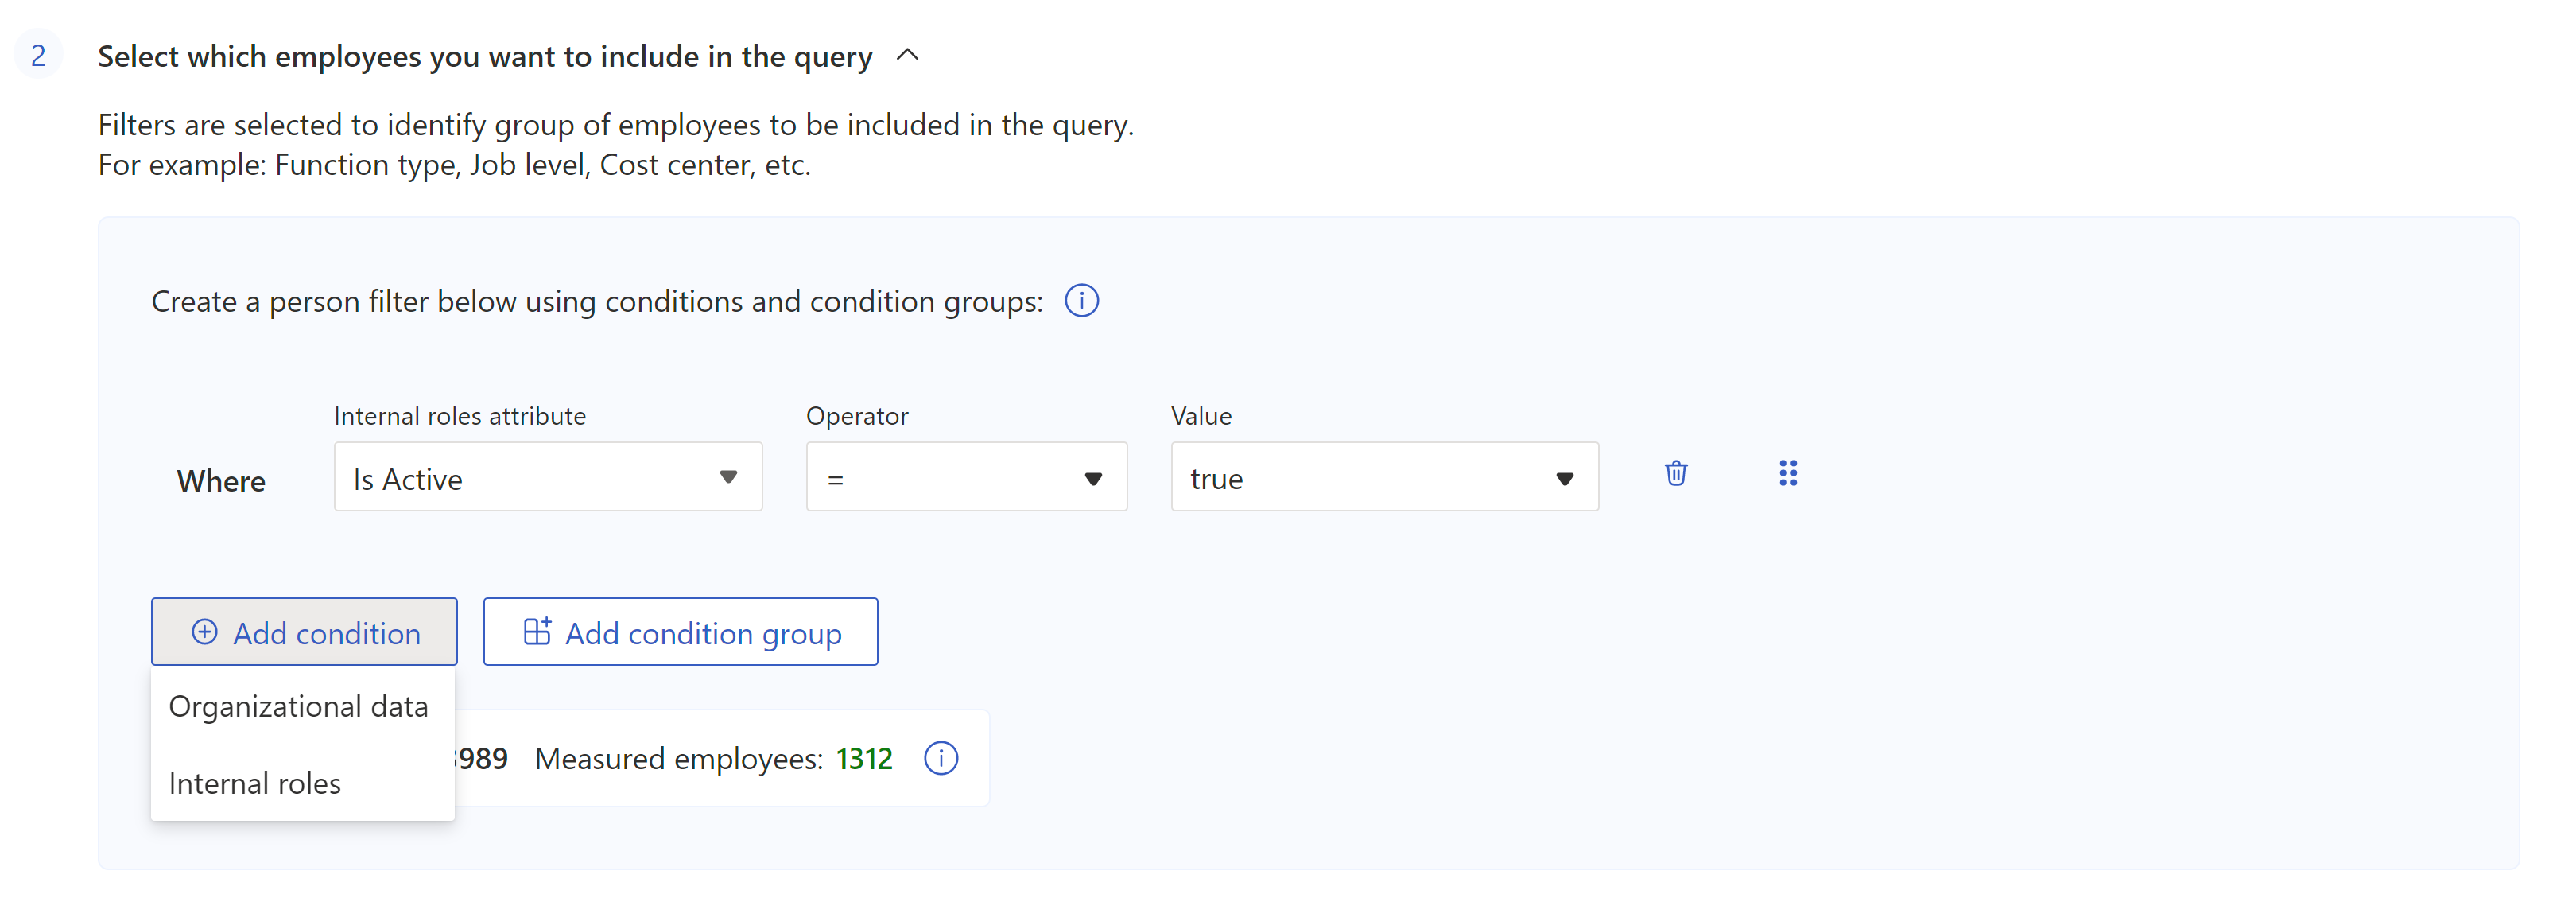
Section: Select which employees you want to include in the query
Underneath the predefined "Is Active" filter, select the Add condition button, then select Organizational data.
Using conditions and condition groups, add one or multiple filters to narrow your analysis of employees.
Note
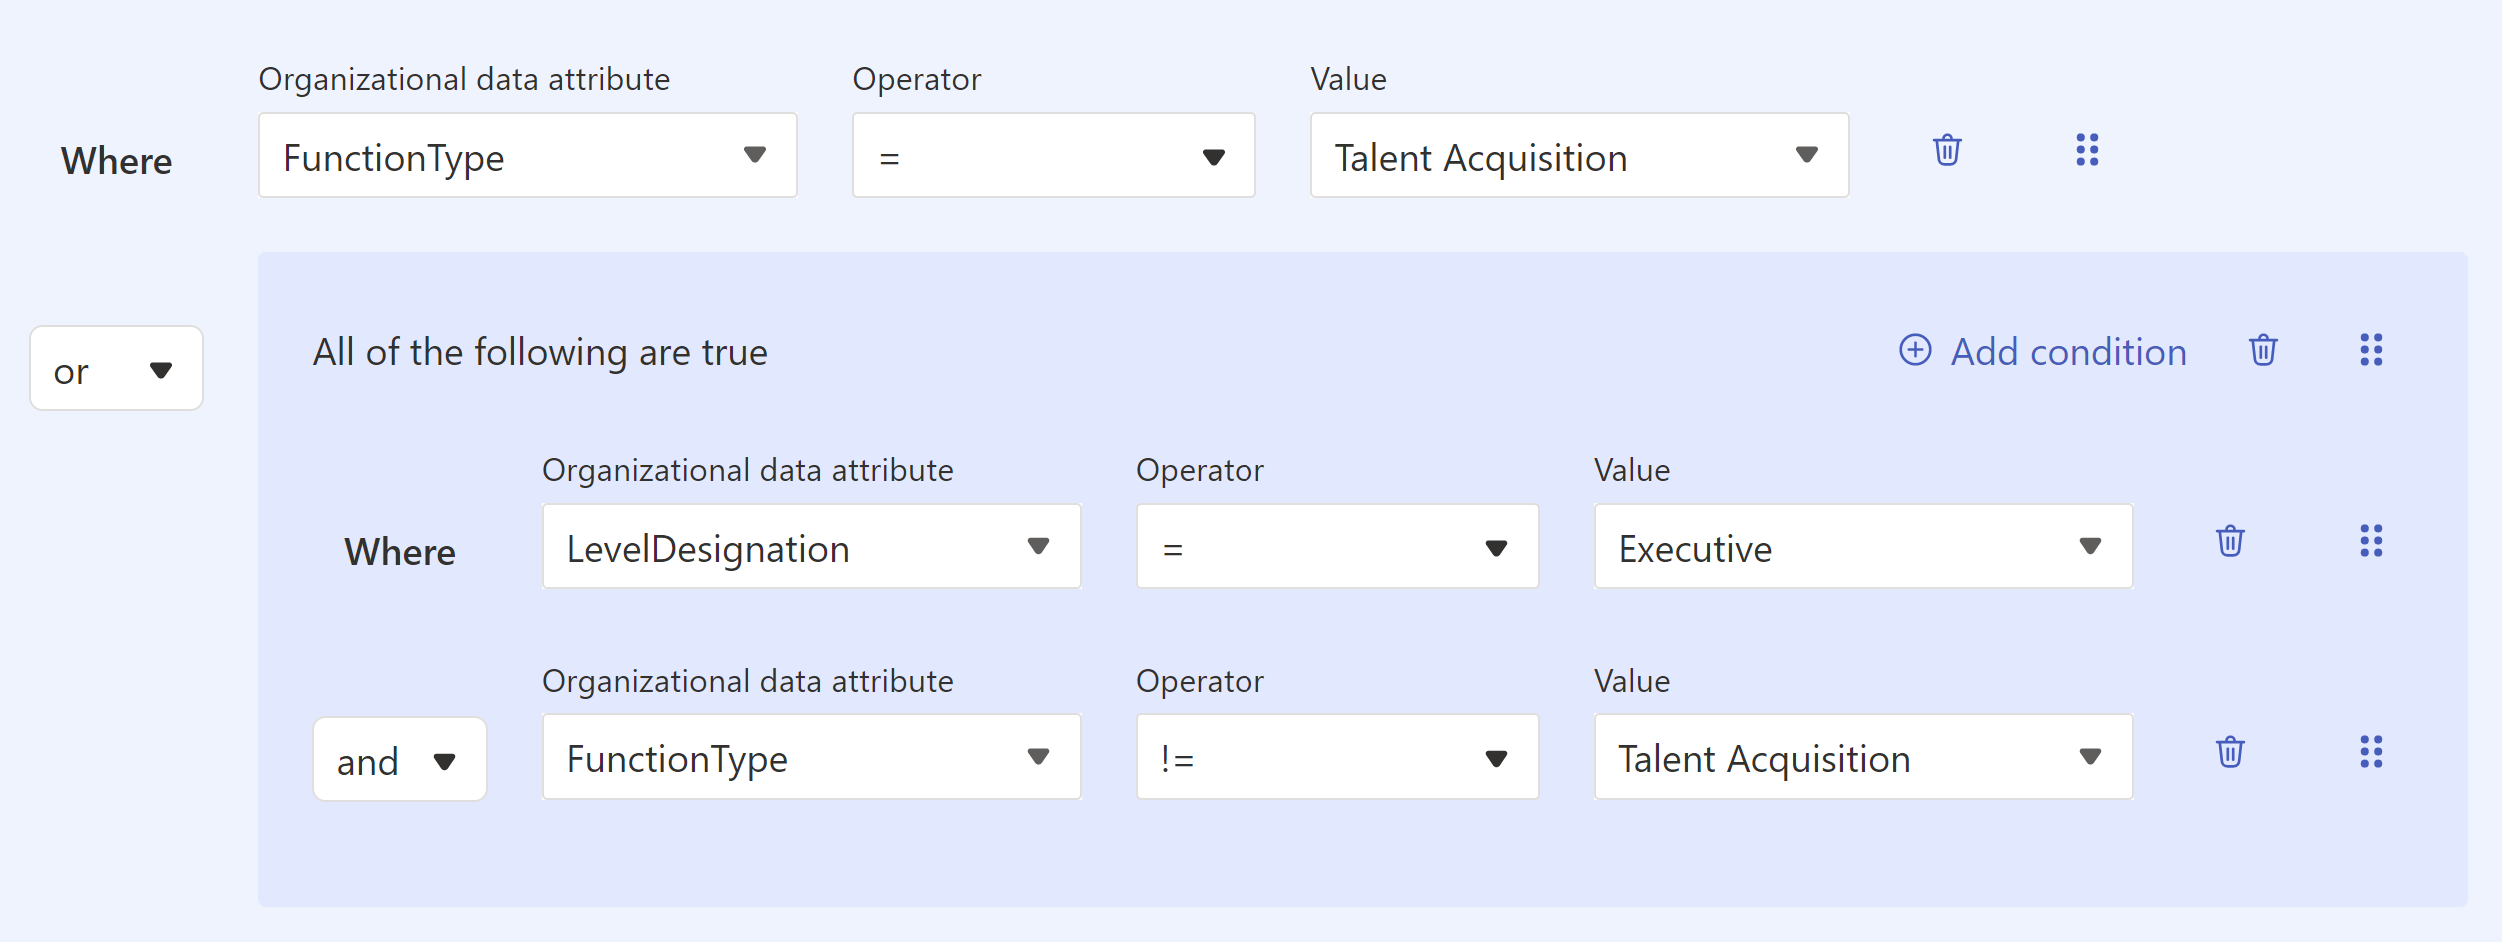
The default conjunction for conditions and condition groups is “and.” To select “or” instead, use the dropdown menu.
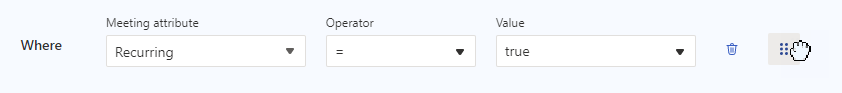
About conditions and condition groups
A condition is a statement about one attribute you want to analyze in your query. A condition only extracts rows from your organizational data that meet certain criteria, which you specify in the condition statement. For example, if your condition statement read, “Organization = Contoso.com,” the query would only extract rows that equal Contoso.com” under the Organization column. A condition group is a combination of conditions connected with a conjunction ("and" or "or"). In the following image, the condition group is in the block to the right of the conjunction "or."
To learn more about filters and conditions, refer to our Filters article.
Is Active
The app predefines one condition for you: “Is Active.” If you leave this condition set to “true,” the query only analyzes active employees. Active employees send at least one email or Teams chat during the unit of time—day, week, or month—defined by the query’s Group by setting.
When you open your query results file, you'll see a Boolean value of "TRUE" or "FALSE" in the IsActive column for each row.
Total and measured employees
Beneath the Add condition and Add condition group buttons, you’ll see a number for Total employees and Measured employees. These numbers represent how many employees could be measured and how many employees the query is actually measuring, respectively. Checking these numbers before running your query can help you determine whether you’ve selected the right conditions and condition groups.
To move and delete conditions and condition groups
To move a condition or condition group, take the following actions:
- Select the six-dot icon to the right.
- Drag the six-dot icon above or below other conditions or groups.
To delete a condition or condition group, select the trashcan icon to the right.
Add employee attributes
Section: Select which employee attributes you want to include in the query
Select the Select attributes button, then on the right pane, use the checklist to make selections.
When you're done picking attributes, select the Add to query button.
Attributes appear as tags in the box above the Select attributes button.
Note
If an attribute appears as a red tag, that attribute might have been removed or renamed. You might see red tags if you’re cloning or editing a query and the attributes have changed since the query was last run. You can remove these marked attributes to get the query to run properly.
About employee attributes
Employee attributes are the data fields—or columns—that you’ve uploaded in your employee data. In Select which employee attributes you want to include in the query, you narrow down which data fields your query includes—for example, Job level or Hire date—to prevent your output (.csv) file from being larger than necessary. Making selections here:
- Improves data analysis with fewer columns in a smaller file.
- Further protects private data by excluding columns from the file.
- Enables you to select Clear all to clear the selected columns.
Run the query
Select the Run button in the screen’s upper right to run the query.
To access your query results
After your query runs, access its results on the Query results page, where you can also edit and clone your query. For further information, refer to Access query results and modify existing queries.
Example person query for after-hours communication
Let’s say you wanted to run a custom person query to find out how often managers are emailing and sending Teams chats after their working hours. You want to:
- Analyze your company’s “West” organization only, which is provided in your employee data.
- See data for the last six months, grouped by month.
- Exclude Senior managers from the query.
Here’s how you might do that:
Set up your query.
- Query name: Give your query a custom name by typing in something like “AfterHoursWest.”
- Time period: Select Last 6 months.
- Auto-Refresh: You just want to have this run once, so leave the Auto-Refresh box deselected.
- Description: Other analysts in your organization might want to know more about this query, so give it a brief description.
- More settings: You want this query to be grouped by month, not week. Select More settings, then change Group by to Month.
Add metrics.
- Under Select metrics for what you want to know about your employees, select the Add metrics button.
- Because you want to add metrics about collaboration after hours, expand the After hours collaboration metric category.
- Select the After hours email hours and After hours instant messages metrics.
- Select the Add to query button.
Specify the employees you want to analyze.
- Under Select which employees you want to include in the query, leave the "Is Active" filter set to “true.“
- Select Add condition.
- Select Organizational data.
- Select Organization, leave the Operator at “=,” and select an employee organization of your company from the dropdown list. As we identified earlier, you’d select “West” from this list.
- Select Add condition group. You don’t want to include Senior managers in this query, so:
- Select Level designation from the Organizational data dropdown.
- Leave the Operator at “=.”
- If you want, you can use the search bar to help find titles with “Manager.” Select Manager, Sales manager, and Design manager from the dropdown list.
- Check the Total employees against the Measured employees. If this number seems off, adjust your conditions above.
Choose the employee attributes you want to include in your output file.
- Under Select which employee attributes you want to include in the query, select the Select attributes button.
- From the right pane, select PopulationType.
- Select the Add to query button.
Run the query. On the upper right of the screen, select the Run button.
After the query successfully runs, find its results in the Query results page. To:
- Download the .csv output file: Select the CSV icon from the Downloads column. If you want to connect the query to another file, like a Power BI visualization, you can select the copy link icon.
- Edit, Edit query name, Clone, Favorite, or Delete the query: Select the ellipses to the right of the Downloads column, then select the appropriate choice.
Caution
Editing queries overwrites existing results. If you want to keep your query’s results, use the Clone feature—which creates an identical copy of the query—instead.
Note
Only the analyst who originally ran the query can Edit query name, Edit, or Delete the query. Other analysts in the organization can View, Clone, and Favorite the query.
Related topics
Saran dan Komentar
Segera hadir: Sepanjang tahun 2024 kami akan menghentikan penggunaan GitHub Issues sebagai mekanisme umpan balik untuk konten dan menggantinya dengan sistem umpan balik baru. Untuk mengetahui informasi selengkapnya, lihat: https://aka.ms/ContentUserFeedback.
Kirim dan lihat umpan balik untuk