Impact explorer report
Using a template populated by Microsoft Viva Insights, the Impact explorer report estimates how taking actions facilitated by Viva Insights can positively impact your organization.
Note
This report provides impact estimates for several different scenarios. Depending on the page and topic, "impact" can refer to how employee hours or employees would be affected by taking certain actions. For example, the impact of reducing recurring long and large meetings could be 23,000 employee hours.
With this report, you can:
- Explore potential opportunities to:
- Give employees back time from meetings.
- Help employees stay productive during their non-meeting time.
- Estimate how taking actions might impact your organization. These estimates are based on default values, which you can customize for your organization.
- Track adoption progress for focus time kept by employees in Viva Insights.
To populate the report in Power BI, you’ll need to set up and successfully run the predefined Impact explorer query in Viva Insights.
Demonstration
The following demonstration uses sample data that’s only representative of this report and might not be exactly what you see in a live report specific to your organization's unique data.
Prerequisites
Before you can run the queries and populate the report in Power BI, you’ll need to:
Be assigned the role of Insights Analyst in Viva Insights.
Have the December 2022 (or newer) version of Power BI Desktop installed. If you have an earlier version of Power BI installed, uninstall it before installing the new version. Then go to Get Power BI Desktop to download and install the latest version.
Report setup
Run query
- In the Viva Insights analyst experience, select Analysis.
- Under Power BI templates, navigate to Impact explorer and select Start analysis.
Under Query setup:
- Type a Query name.
- Select a Time period. Time period defaults to Last 6 months.
- Set Auto-refresh (optional). You can set the query to automatically update by checking the Auto-refresh box. When you select the Auto-refresh option, your query automatically runs and computes a new result every time Viva Insights gets updated collaboration data for licensed people.
Note
If organizational data used in an auto-refreshing query changes (for example, an attribute name is altered or an attribute is removed), the query might stop auto-refreshing.
- Type a Description (optional).
- Change the metric rule (optional). To set a new metric rule, select More settings. Then, pick a new rule from the list. For more information about metric rules, refer to Metric rules.
Note
The More settings pane also contains Group by settings. Power BI queries are set to Group by Week, and you're not able to edit this field.
Under Predefined template metrics, view the list of preselected metrics, which appear as gray tags. These metrics are required to set up the Power BI report and you can’t remove them. You can add other metrics by selecting Add metrics. Including the preselected ones, you can have up to seven metrics in your query.
Important
Low-quality or missing organizational data might affect your metrics and result in warnings or errors. Learn more about data-quality notifications in Data quality in the analyst experience.
In Select which employees you want to include in the query, add filters to narrow down the employees in scope for your report. Don’t remove the predefined “Is Active” filter. For more details about filter and metric options, refer to Filters. If you notice a warning or error here, it's because one of your attributes is missing from your organizational data or is of low quality.
Under Select which employee attributes you want to include in the query, add up to seven organizational attributes. Once the query runs, you can use these attributes to group and filter the reports.
Important
This PowerBI query needs some specific attributes to run, and we've preselected them for you. These attributes appear in gray and you can't remove them. We might also include some attributes that help your template, but aren't required for your query to run. These attributes appear in blue and you can remove them.
If you notice attributes marked with yellow warnings, that attribute's quality is low. If you notice attributes marked in red and the query's Run button disabled, then your organizational data is missing that attribute.
Learn more about attributes and data quality in Data quality in the analyst experience.
Select Run on the upper right side of the screen. The query might take a few minutes to run.
When your query results are ready, go to the Query results page and select the Power BI icon. Download the Power BI template and get the partition and query identifiers. You’ll need these identifiers later.
Link report to query
- Open the downloaded template.
- If you're prompted to select a program, select Power BI.
- When you're prompted by Power BI:
- Paste in the partition and query identifiers.
- Set the Minimum group size for data aggregation within this report's visualizations in accordance with your company's policy for viewing Viva Insights data.
- Select Load to import the query results into Power BI.
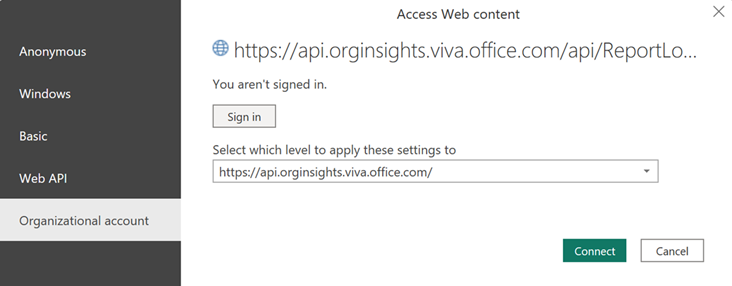
- If prompted by Power BI, sign in using your organizational account. Power BI then loads and prepares the data. For large files, this process might take a few minutes.
Important
You need to sign in to Power BI with the same account you use to access Viva Insights. If available, select Organizational account from the left. You might have to sign in more than once.
Report settings
After you run the query and link it to Power BI, you can adjust the report’s settings.
Settings page
View and set the following parameters on the Settings page. Find Settings on the right panel of the introduction page, or adjust the report settings as you go through the report pages by selecting the Settings icon.
| Setting | Description |
|---|---|
| Select the time period to measure | Set the time period that you want to analyze—for example, 3/10/2022 – 9/10/2022. |
| Select an organizational attribute to view the report by | Set the primary group-by attribute shown in all subsequent reports. You can change this attribute at any time and all subsequent report pages will group values by the new attribute. |
| Select optional filters to exclude employee groups | Filter the measured employee population by selecting organizational attributes—for example, “Region”—and then selecting values for those attributes—for example, "Pacific." When you use filters, the Measured employees count on the page’s top right will show a reduced number. |
| Average employee hourly rate | Enter the average hourly rate for your employees. The report’s default rate is 75. To adjust the value, type in the average hourly rate in your organization or locate the number by moving the slicer. What you enter here affects how the Overview page estimates the monetary worth of repurposed employee time. |
| Exclude weeks marked with a holiday indicator | Select this control to exclude unusually low collaboration weeks based on individual collaboration patterns. These low collaboration weeks usually occur when employees are taking time off from work. |
| Exclude non-knowledge workers | Select this control to exclude employees who spend a weekly average of no more than five hours in meetings, emails, chats, and calls. These employees are unlikely to be knowledge workers or they don’t use Outlook or Teams. |
| Select the preferred language for your report | Pick your report’s language. |
About default values in Identify opportunities sections
In each of the following pages’ Identify opportunities sections, you’ll find default values within dropdown menus:
- Give employees time back from meetings
- Protect employee non-meeting time
- Foster an engaged workforce
The report uses these values to make its estimates.
To more accurately reflect your organization, you can change these values. After you make changes, the report refreshes its estimate calculations. Refer to About the report for more details on adjusting these default values for each page.
About the report
Note
The estimates presented in this report are base estimates to help you start identifying and evaluating opportunities in your organization. These values aren’t a product promise or a full coverage of the product value.
Overview
Based on the Impact areas in the table below, the Overview page gives three estimates near the top of the page:
- Employee time that could be repurposed – The total number of employee hours that could be repurposed if your organization did two things through Viva Insights:
- Gave time back from meetings. We define this as shortening meetings and reducing long and large recurring meetings by half.
- Protected employee non-meeting time. We define this as using focus time, taking time to learn a new skill, or taking a break at lunch.
- Estimated weekly potential impact per employee – This value is Employee time that could be repurposed averaged per week, per employee. Use this estimate to find out how an average employee might benefit from using Viva Insights each week.
- Estimated worth of employee time that could be repurposed – This value is the employee time that could be repurposed multiplied by the average employee hourly rate. To change hourly rates, go to the Settings page.
Potential impact by impact area and actions
For each of the following four actions, this table shows you the potential impact in hours and weekly impact per employee:
- Shorten meetings
- Optimize recurring long and large meetings
- Protect time to focus
- Schedule learning time and lunch breaks
Use this table to:
- Find the total potential impact of an action item.
- Find the weekly per-person impact for each action item.
- Identify and prioritize high-impact opportunities for your organization.
Top groups by potential impact
View how groups in your organization could most benefit from taking all actions listed in the table to the left.
To view the top groups that could benefit from taking a particular action, select an action—like Shorten meetings—on the Potential impact by impact area and actions table. You’ll get an impact estimate for groups in your organization based on that action only.
More impact areas in this report
Access other report pages in this section:
- Foster an engaged workforce – Identify opportunities to enhance manager coaching and protect after-hours time.
- Track progress for focus time – Track adoption and explore the impact of booking and keeping focus time.
More about our impact
Access the latest published article that highlights 5 ways Microsoft Viva can help you save time and money.
Give employees time back from meetings
Get an estimate of the hours employees could get back from meetings if your organization did two things through Viva Insights:
- Shortened meetings.
- Your organization can shorten meetings automatically through a shared meeting plan.
- Reduced recurring long and large meetings.
- To find out which recurring meetings might be good candidates to reduce, your organization can use the Recurring meeting audit Power BI template.
Understand the baseline
View the:
- Weekly average hours spent in meetings per employee.
- Time spent in 30-60 minutes meetings and longer ones.
Identify opportunities
Get an estimate of the hours employees could get back from meetings if your organization rolled out the shorten meeting solution, which is part of the shared meeting plan. To view how many employees could benefit from this solution, select the Employees button.
The report calculates this estimate using the default values beneath the bar graph. These values represent the number of minutes each meeting would be automatically shortened by if your organization used the shorten meeting solution. To change these numbers and update the estimates, use the dropdown menus.
Note
The numbers in this visual are a base estimate according to employee meeting behaviors during this report's selected time period.
Take action
Select:
- Try it for your team to start a shared meeting plan with your reports.
- Try it for yourself to automatically shorten the meetings you schedule.
- Learn more to access online documentation for the shared meeting plan.
Reclaim more employee time
Get an estimate of how much time employees could save if your organization made recurring long and large meetings half as long. You can review and audit the recurring meetings through the Recurring meeting audit Power BI report.
Note
Large and long meeting hours are meeting hours with a duration of more than one hour and nine or more invitees, including the organizer.
Large and long recurring meeting hours are recurring meeting hours with a duration of more than one hour and nine or more invitees, including the organizer.
View all metric definitions, including those for meeting types, in Metric definitions.
Protect employee non-meeting time
Get an estimate of the hours employees could use to focus on individual tasks, develop career skills, or take lunch breaks.
Understand the baseline
Identify how much unscheduled time is available per week, per employee. Unscheduled time is the number of working hours that aren’t:
- Occupied by meetings.
- Scheduled as focus time through Viva Insights.
Employees could protect some of this unscheduled time for productive use, like focusing on high-priority tasks or learning a new skill.
Identify opportunities
Get an estimate of the number of hours employees could reserve as focus time in Viva Insights. The report bases this calculation on the default value beneath the bar graph. Like on other pages, you can change the value here to better fit your organization.
When it makes this estimate calculation, the report considers how employees are already using focus time in Viva Insights. Let’s say someone kept one hour of focus time each day during the report’s selected time period. However, the preferred amount is two hours, as indicated in the default value beneath the bar graph. When it makes this opportunity calculation, the report will capture the remaining one hour this employee could use for focus time.
Select the Employee button for an estimate of the number of employees who could benefit from more focus time in Viva Insights.
Take action
Select:
- Set up shared focus plan to start a focus plan with your team.
- Set up focus plan for yourself to start a personal focus plan.
- Track progress for focus time to jump to this other page in the report.
- Learn more to access our online documentation about shared focus plans.
More ways to protect time
Get an estimate of the time employees could protect to learn a skill or to connect with friends or colleagues at lunch.
Foster an engaged workforce
Find opportunities to empower employees and keep them engaged through regular manager 1:1s and discover tools that can protect their time after work.
Understand the baseline
Identify how much time each employee spends with their manager in recurring 1:1 conversations every four weeks.
Identify opportunities
Get an estimate of the number of employees who could benefit from connecting more regularly with their managers. The report bases this calculation on the default value beneath the bar graph—that is, the number of minutes employees spend with their manager every four weeks. Like on other pages, you can change the value here to better fit your organization.
Select the Hours button to view the estimated time your organization could invest in empowering employees.
Take action
Select Learn more to access our team insights documentation, which explains how to use the Viva Insights app in Teams to keep up with your direct reports.
Protect employee time after work
Get an estimate of the hours employees spend asynchronously collaborating after work—like sending emails and Teams chats—that they could shift to their working hours.
Track progress for focus time kept by employees
Find out how your organization is adopting focus time in Viva Insights, including the impact of booking and keeping that focus time. While earlier report pages focus on the potential value of focus time, this page helps show the value that focus time is already bringing to your organization.
Note
“Kept focus time” means that an employee booked focus time in Viva Insights that didn’t overlap with their meetings, and they didn’t later delete that focus time from their calendar. This time includes time booked with and without a focus plan.
Focus time kept
View the:
- Total hours employees kept as focus time over the report’s selected time period.
- The average number of hours kept per person per week.
Focus time adoption
Track how your organization is adopting focus time over time, and identify pockets of employees who are using focus time at work. Also, discover how employees are booking their focus time—through a focus plan or without a focus plan.
Are employees able to focus?
Discover whether employees have enough time to focus or are double-booking their focus time. Select the information (i) icon to discover groups who have more focus-time/meeting conflicts.
What’s the impact of focus time?
Find out whether focus time is helping reduce employees’ after-hours collaboration load. Select the information (i) icon to discover which pockets of employees benefited the most from it.
Take action
Select:
- Set up no-meeting day to arrange a recurring no-meeting day with your team.
- Learn more to view our online documentation about shared no-meeting days.
Power BI tips, FAQs, and troubleshooting
For details about how to share the report and other Power BI tips, troubleshoot any issues, or review the FAQ, see Power BI tips, FAQ, and troubleshooting.
Related topics
Saran dan Komentar
Segera hadir: Sepanjang tahun 2024 kami akan menghentikan penggunaan GitHub Issues sebagai mekanisme umpan balik untuk konten dan menggantinya dengan sistem umpan balik baru. Untuk mengetahui informasi selengkapnya, lihat: https://aka.ms/ContentUserFeedback.
Kirim dan lihat umpan balik untuk