Improve customer relationship with relationship analytics
Relationship analytics uses the activity history of a seller with a contact or account and calculates key performance indicators (KPIs) based on their interactions. KPIs are available for contacts, accounts, opportunities, and leads. Each KPI is displayed as a graph to help you quickly identify relationships that need to be nurtured and KPIs to improve.
Depending on your Dynamics 365 Sales license and configuration, you'll see basic insights or enhanced insights. Basic insights are available for early access.
License and role requirements
| Requirement type | You must have |
|---|---|
| License | Dynamics 365 Sales Enterprise or Dynamics 365 Sales Premium More information: Dynamics 365 Sales pricing |
| Security roles | Any primary sales role, such as salesperson or sales manager More information: Primary sales roles |
View analytics and KPIs for an individual lead, account, contact, or opportunity
Tip
Images that include an icon that looks like this:  may be expanded to show more detail. Select the image to expand it. To close it, press the Esc key.
The following steps describe how to view the analytics for a lead. The steps to view relationship analytics for account, contact, and opportunity records are similar.
In the Sales Hub app, select Leads, and then open a lead.
Select the Sales Insights form.
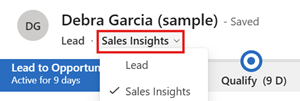
Select the Relationship Analytics tab.

Get the big picture with the relationship analytics view
The relationship analytics view lists the following KPIs and health indicators for your open opportunities, leads, accounts, or contacts:
- Activity history and KPIs for contact, opportunity, lead, and account records
- Health score and health trend for contact, opportunity, and lead records
- Previous and next activity for contact, opportunity, lead, and account records
The following steps describe how to view the relationship analytics for a lead. The steps to view relationship analytics for account, contact, and opportunity records are similar.
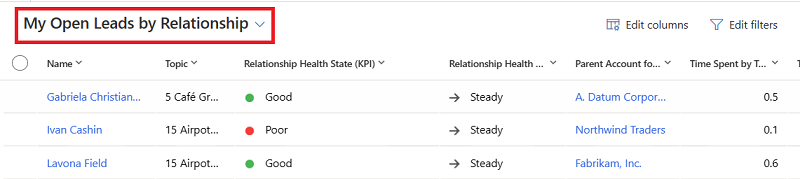
In the Sales Hub app, select Leads.
In the views list, select My Open Leads by Relationship.

Identify critical opportunities with the relationship pipeline view
The relationship pipeline view provides a bubble chart that gives you a quick overview of the health, close date, and estimated revenue of your upcoming opportunities.
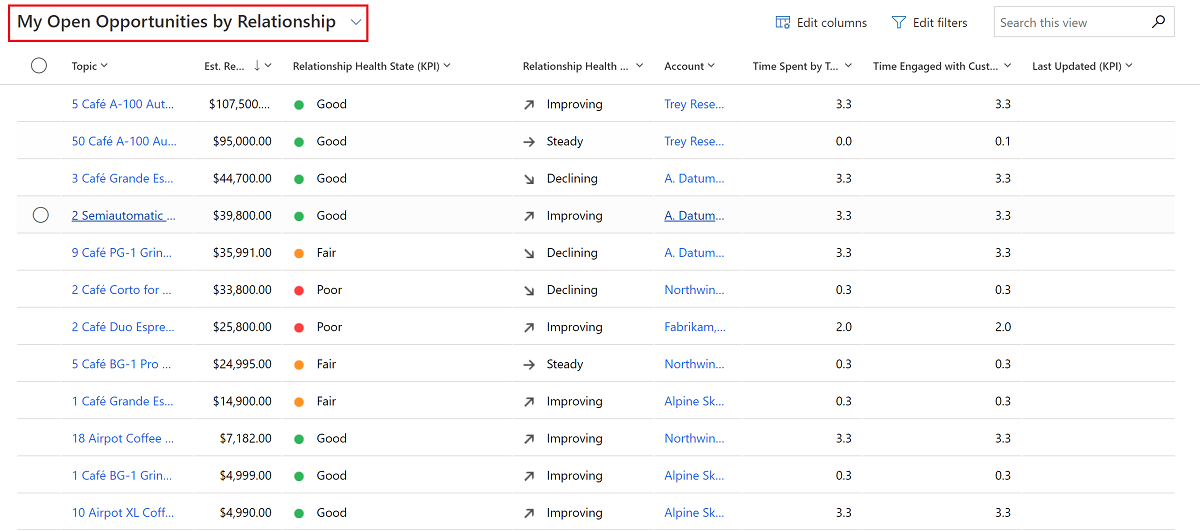
Go to Sales > Opportunities.
In the list, select My Open Opportunities by Relationship.
In the command bar, select Show Chart.
In the charts list, select Relationship Pipeline.
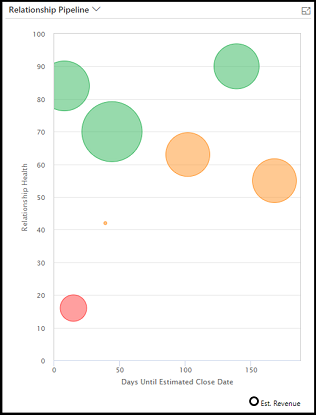
Each upcoming opportunity is plotted as a bubble on the chart. The size of each bubble indicates the estimated revenue of the opportunity. Health is plotted on the y-axis. The higher up the bubble appears on the chart, the better its health. Estimated close date is plotted on the x-axis. Opportunities on the left side of the chart may expire soon. Therefore, the most critical opportunities are the ones with the largest bubbles located near the lower-left corner, while the most promising opportunities are near the top of the chart.
Hover over a bubble to see the name of the opportunity and other details. Select a bubble to open its opportunity record. The color of each bubble indicates relationship health:
- green for good
- amber for fair
- red for poor
- blue for pending computation
- gray for no computation (the results haven't been calculated or there isn't enough data)
The relationship pipeline chart relies on several values being available for each opportunity record. In some cases, these values may be missing for some or all opportunities. This could be due to an oversight, or it could be because you don't use these fields in your organization. The chart represents missing values as follows:
- Opportunities that don't have a relationship health value are gray with a value of zero. They're plotted at the bottom of the chart.
- Opportunities with an estimated close date in the past aren't shown.
- Opportunities without an estimated close date aren't shown.
- Opportunities without an estimated revenue value show a value of zero. They're plotted as small bubbles.
Compare the KPIs of an opportunity with similar opportunities
As a seller, it's important to understand what's working better for a deal and learn about the best engagement practices from similar deals that were won in the past. The enhanced relationship analytics displays a comparison of the KPIs, activity history, and relationship health of the current opportunity with similar won deals, and lists similar won deals at the bottom. By opening the deals, you can learn what worked and what didn't and apply what you learn in the deal you're trying to close. Your administrator must set up enhanced relationship analytics.
In the Sales Hub app, select Opportunities, and then open an opportunity.
In the list, select the Sales Insights form.
Select the Relationship Analytics tab.
If relationship analytics can't detect opportunities that are similar to the current opportunity, it shows KPIs of the top 100 won opportunities. Learn more about enhanced relationship insights.
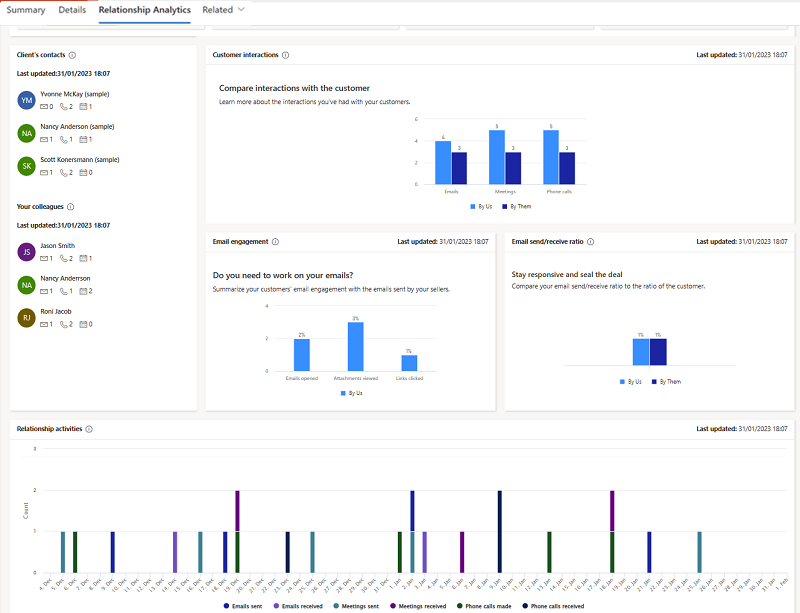
The following screenshot shows enhanced relationship analytics for an opportunity:
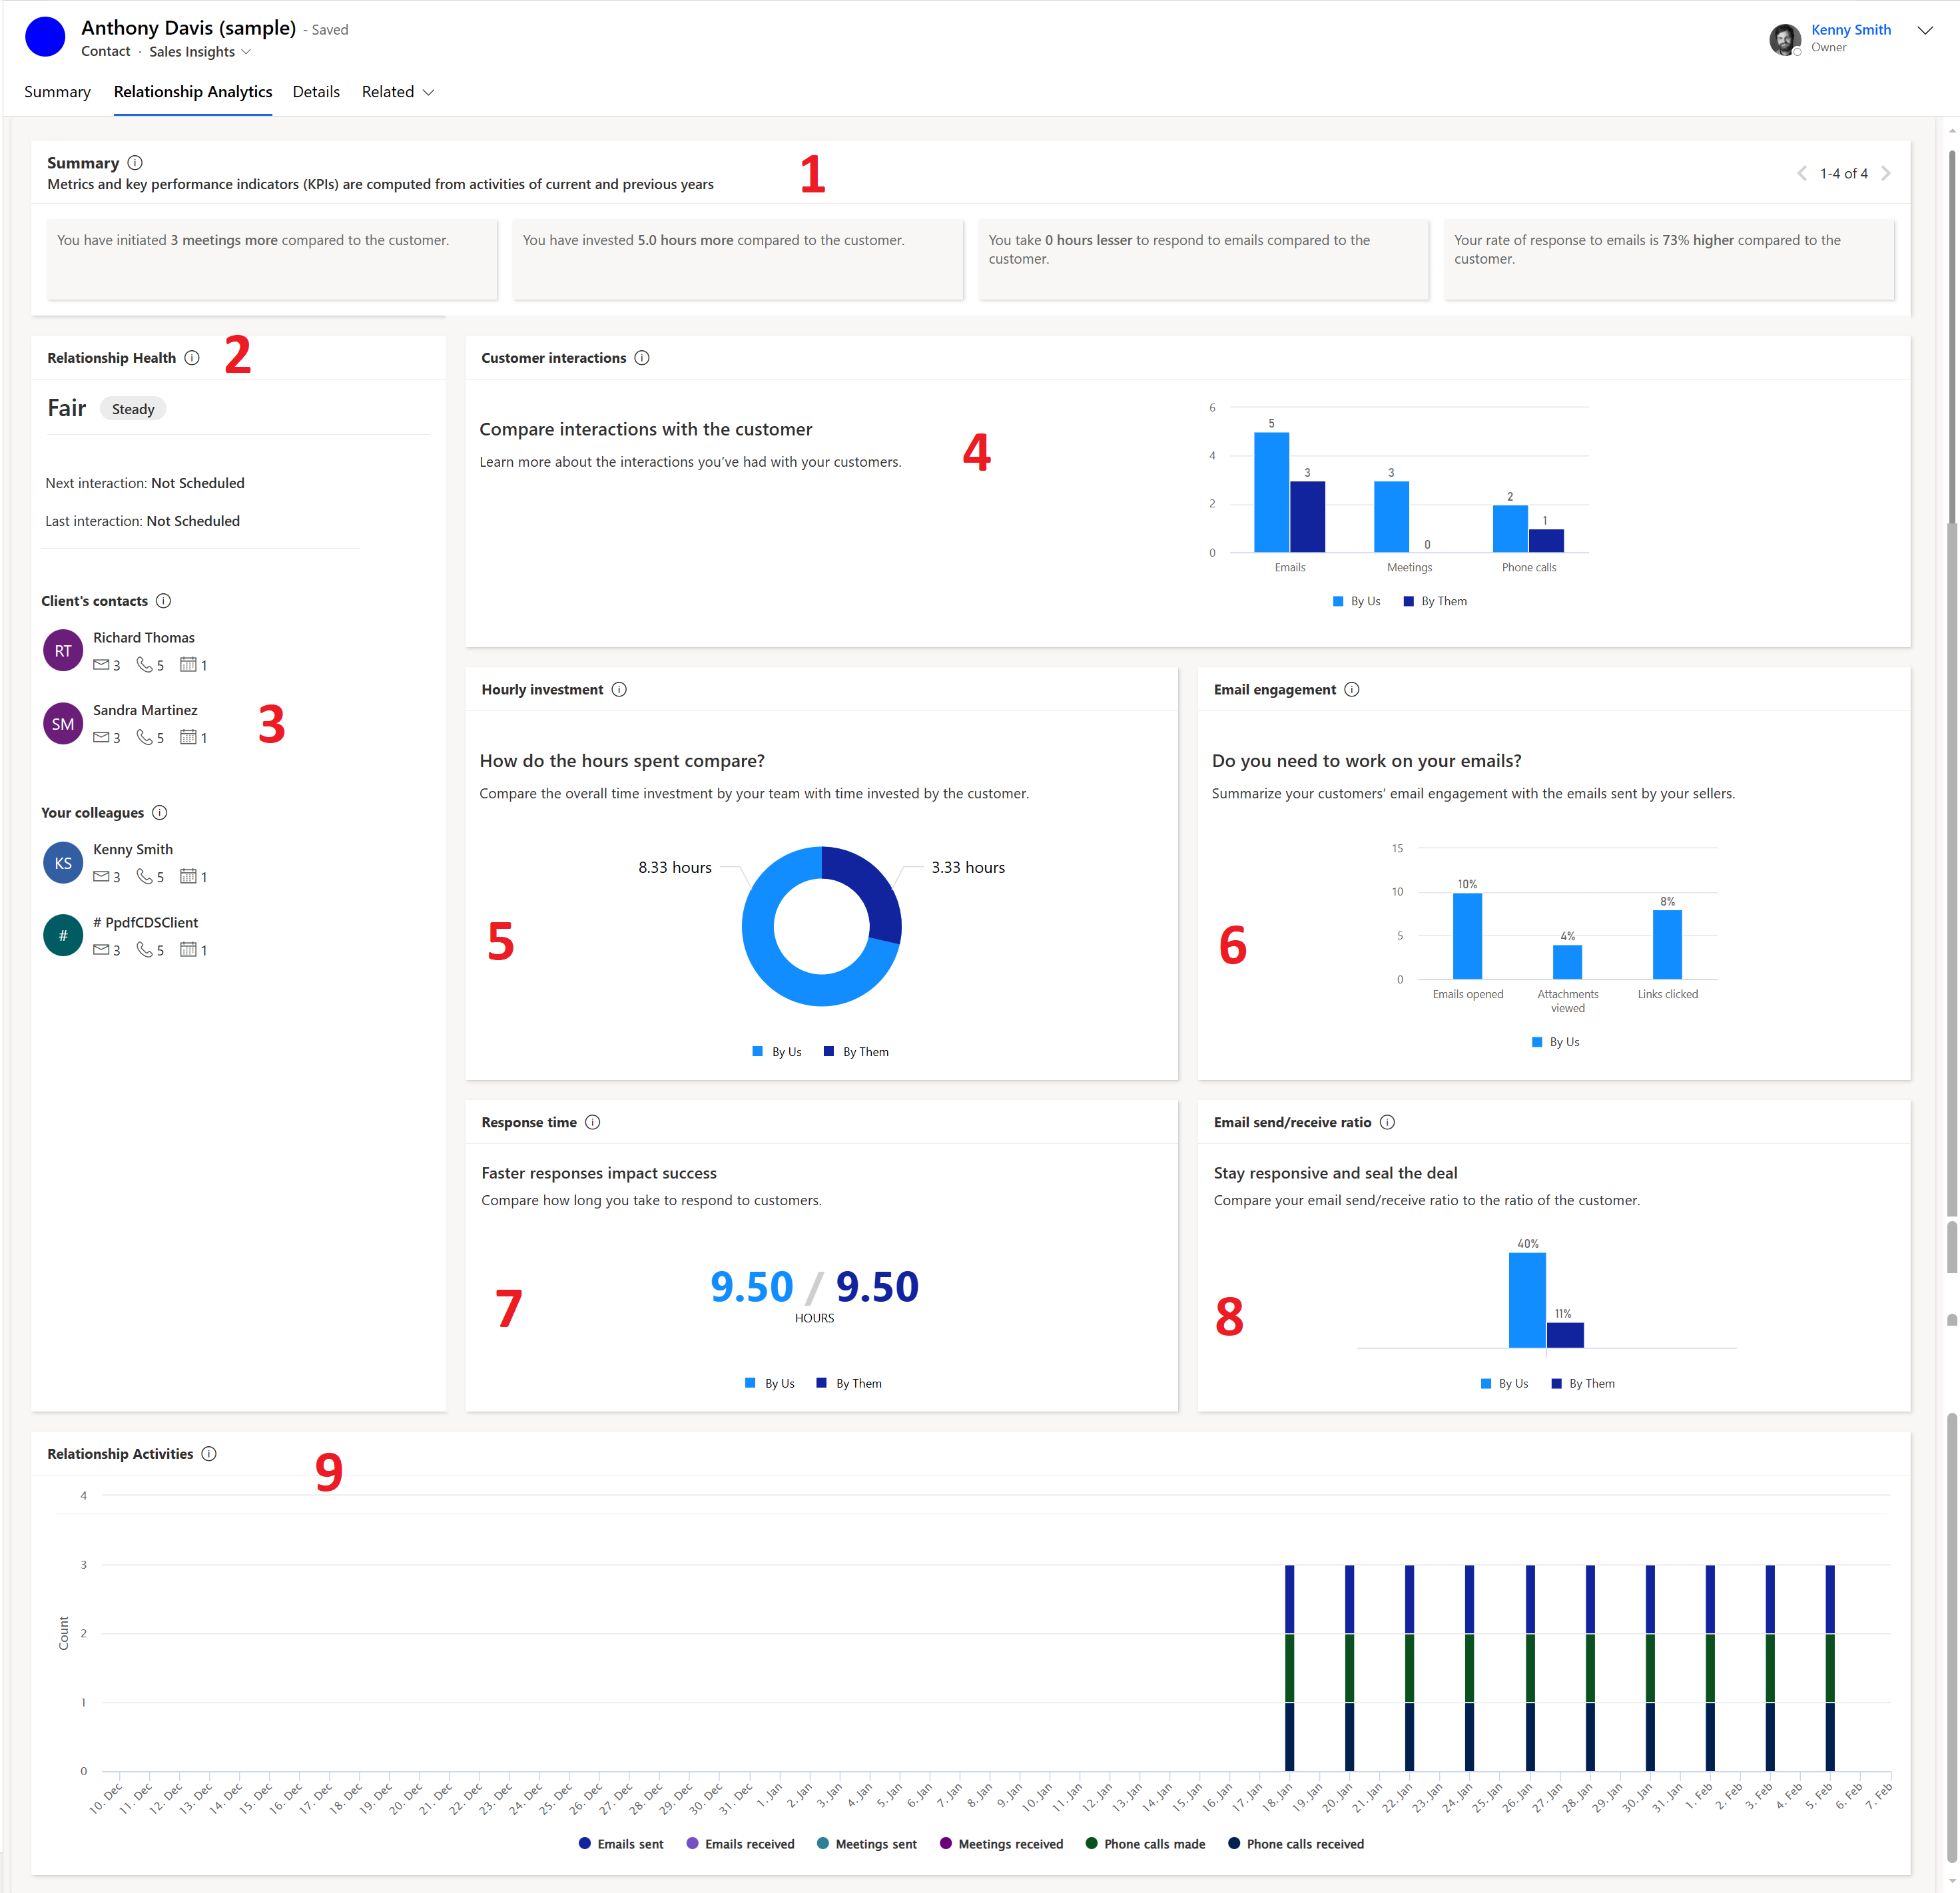
For more information about the legends in the screenshot, see Enhanced relationship insights.
See also
Configure relationship analytics
Sales Insights and privacy
View and export KPI data
Relationship analytics and health FAQ
Athugasemdir
Væntanlegt: Á árinu 2024 munum við hætta með GitHub-mál sem ábendingaleið fyrir efni og skipta því út fyrir nýtt ábendingakerfi. Frekari upplýsingar er að finna hér: https://aka.ms/ContentUserFeedback.
Senda inn og skoða endurgjöf fyrir