Relationship analytics and KPIs overview
Important
This feature is intended to help sellers and sales managers enhance their team's performance. This feature is not intended for use in making, and should not be used to make, decisions that affect the employment of an employee or group of employees, including compensation, rewards, seniority, or other rights or entitlements. Customers are solely responsible for using Dynamics 365, this feature, and any associated feature or service in compliance with all applicable laws, including laws relating to accessing individual employee analytics and monitoring, recording, and storing communications with end users. This also includes adequately notifying end users that their communications with sales persons may be monitored, recorded, or stored and, as required by applicable laws, obtaining consent from end users before using the feature with them. Customers are also encouraged to have a mechanism in place to inform their sales persons that their communications with end users may be monitored, recorded, or stored.
Relationship analytics uses the activity history of a seller with a contact or account and calculates key performance indicators (KPIs) based on their interactions. KPIs are available for contacts, accounts, opportunities, and leads. A graphical display of the KPIs helps you quickly identify relationships that need to be nurtured and KPIs to improve.
Relationship analytics help sales professionals and managers answer questions such as:
- Which opportunities should I spend my time on?
- Do we have a good relationship with the customer?
- How much time have we spent with the customer?
- When was the last time we contacted the customer?
- When is the next time we'll contact the customer?
- How many emails and meetings have we exchanged?
- What's the customer's response rate?
- How many activities were initiated by the customer?
- How long does it take our team to respond?
Depending on your Dynamics 365 Sales license and configuration, you get either basic or enhanced relationship insights.
Tip
Images that include an icon that looks like this:  may be expanded to show more detail. Select the image to expand it. To close it, press the Esc key.
Basic relationship insights
Basic relationship insights are generated by using emails and appointments sent and received from Dynamics 365. These insights are available out-of-the-box and don't require any setup. The seller-customer interaction history is used to calculate KPIs and understand who knows whom. For information on how to view the insights, View analytics and KPIs for a record
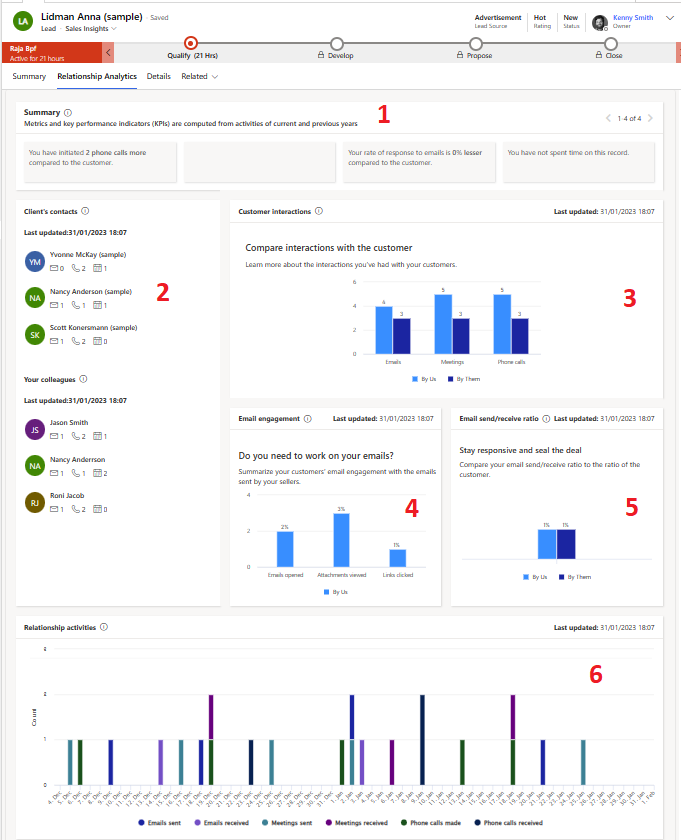
The following screenshot illustrates the relationship analytics widgets that are available out-of-the-box for a lead. Similar widgets are available for the Contact, Account, and Opportunity entities.
| Legend | Widget | Description | Available for |
|---|---|---|---|
| 1 | Summary | Shows the summary of metrics and KPIs obtained for the records from your interactions with customers through emails, meetings, and phone calls. For example, You have initiated 3 meetings more compared to the customer. | Account, Contact, Lead, Opportunity |
| 2 | Most contacted and Most contacted by | Shows the top three active contacts for the deal from your and your customer's organizations, with details about the number of times they've interacted and the modes of interaction. The Last updated date shows the timestamp of the last KPI calculation. | Account, Lead, and Opportunity |
| 3 | Customer interactions | Shows the number of interactions initiated by you versus your customer's contacts. The graph displays the total number of activities initiated by members of your team and by the customer's contacts. The activities are broken down by general type, such as email, meetings, and phone calls. | Account, Contact, Lead, Opportunity |
| 4 | Email engagement | Summarizes how your customer has interacted with the followed emails that your team has sent to them. Unfollowed emails are not included, so you must enable and use the email-engagement feature to see any information here. More information: Use email engagement to view message interactions. | Account, Contact, Lead, Opportunity |
| 5 | Email sent/received ratio | Compares the number of emails sent by the seller and customer, and displays the following ratios: By them: Indicates the ratio of emails sent by customer as compared to the emails sent by seller. A high ratio means the customer is more active and interested in the conversation. A low customer sent/received ratio means the customer is less responsive and may need more attention or follow-up. By us: Indicates the ratio of emails sent by the seller as compared to the emails sent by the customer. A high seller sent/received ratio means the seller is more proactive and helpful in the conversation. A low seller sent/received ratio means the seller is less engaged and may need to improve their communication skills or offer more value. |
Account, Contact, Lead, Opportunity |
| 6 | Relationship activities | Provides a detailed look at activities over 60 days, broken down by date and activity type, such as emails sent, emails received, meetings sent, meetings received, phone calls made, and phone calls received. Use this widget to view the seller-customer interactions over the last 60 days and gain insight into interaction frequency and period of non-interaction. You can use this insight to define healthy interaction frequency. | Account, Contact, Lead, Opportunity |
Enhanced relationship insights
Enhanced relationship insights are available with the Sales Premium license and requires your administrator to enable and configure relationship intelligence. Your administrator can configure relationship intelligence to use the Exchange data as well. In this case, the insights will be generated based on emails and meetings information in Dynamics 365 and emails in Microsoft Exchange. More information: Enable relationship intelligence
Note
If you opt in for April 2025 early access, you can connect to Exchange only using server-side synchronization. If you previously enabled the Exchange integration through relationship intelligence settings, it won't work for early access. Until server-side synchronization is set up, Relationship Analytics only uses emails from Dynamics 365.
For information on how to view the insights, see View analytics and KPIs for a record.
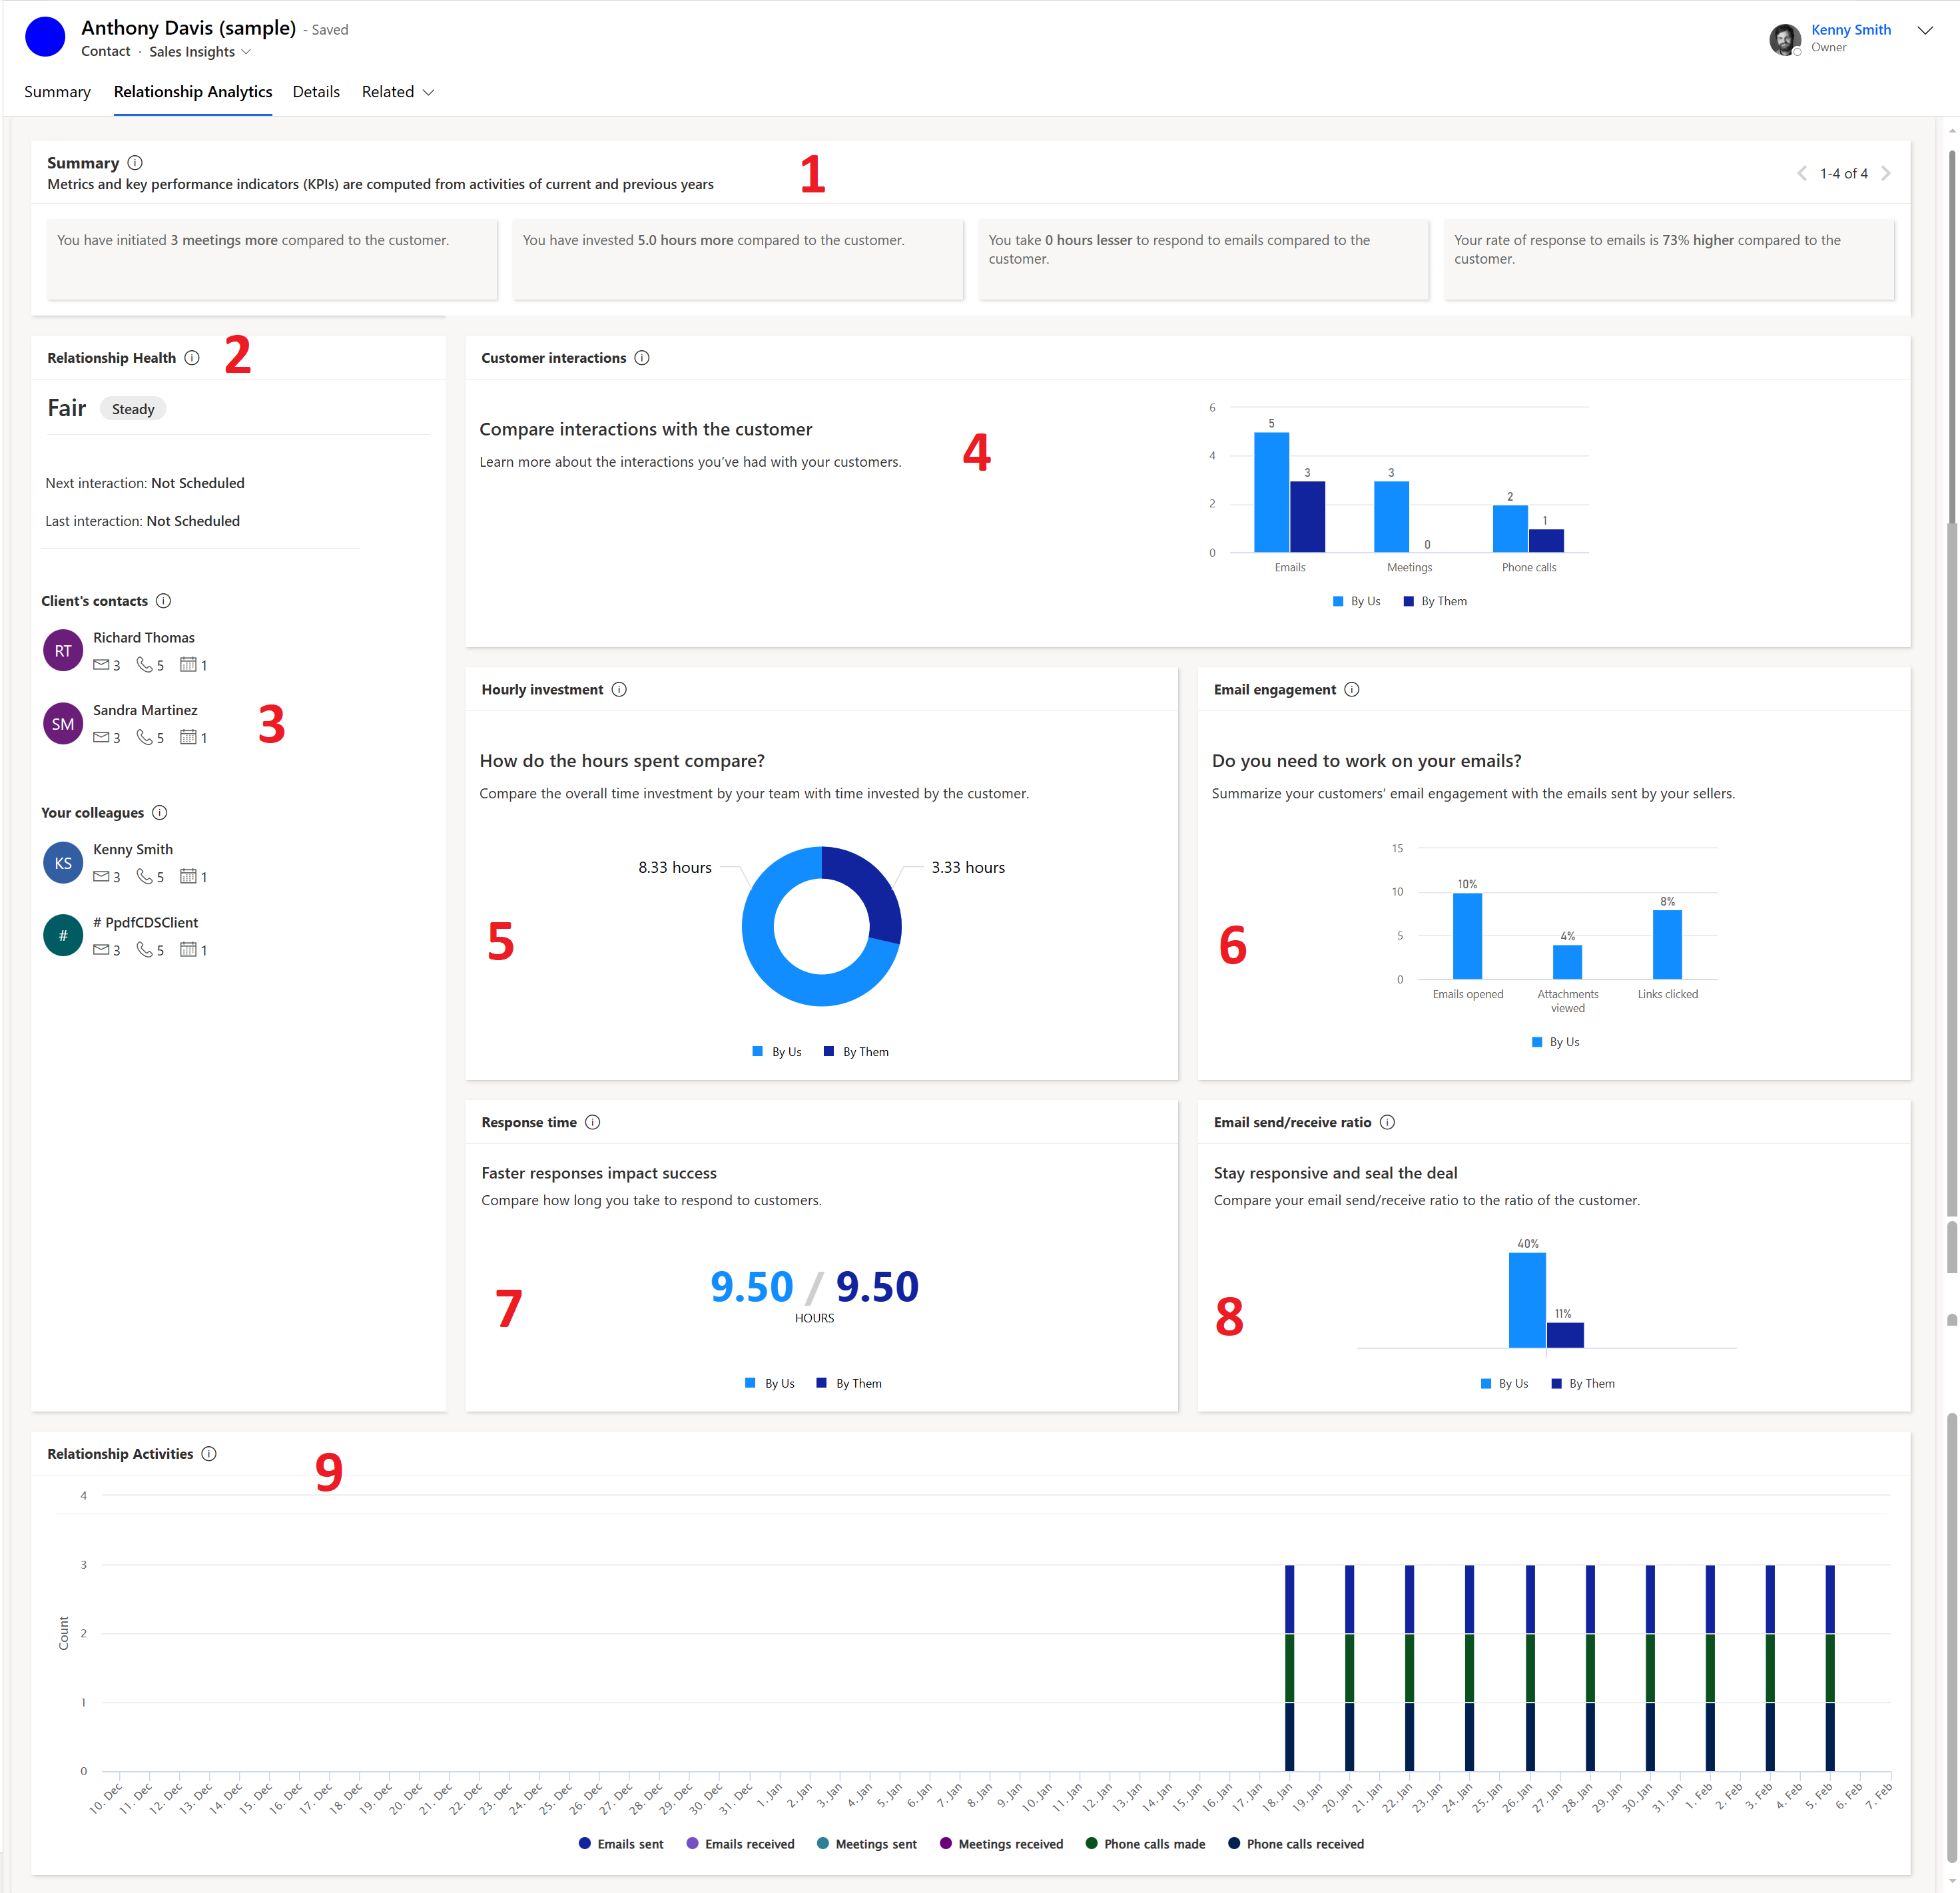
The following screenshot illustrates the enhanced relationship insights that are available for an opportunity. Similar widgets are available for the Contact, Account, and Lead entities. For Opportunity records, the KPIs are compared with similar won deals.
| Legend | Widget | Description | Available for |
|---|---|---|---|
| 1 | Summary | Shows the summary of metrics and KPIs obtained for the records from your interactions with customers through emails, meetings, and phone calls. For example, You have initiated 3 meetings more compared to the customer. | Account, Contact, Lead, Opportunity |
| 2 | Relationship health | Shows your overall relationship health with the customer, and includes the recent trend for the deal. - Next interaction. Shows the date and time for the next activity that's scheduled for the record. If you have access to that activity, you also see its name or subject. The next and last interactions are only shown for opportunity and lead entities. - Last interaction. Shows the date and time for the last activity that you completed for the record. If you have access to that activity, you also see its name or subject. The next and last interactions are only shown for opportunity and lead entities. |
Contact, Lead, Opportunity |
| 3 | Most contacted and Most contacted by | Shows the top three most active contacts for the deal from your and your customer's organizations, with details about the last time these contacts interacted. | Account, Lead, and Opportunity |
| 4 | Customer interactions | Shows the number of interactions initiated by you versus your customer's contacts. The graph displays the total number of activities initiated by members of your team and by the customer's contacts. The activities are broken down by general type, such as email, meetings, and phone calls. | Account, Contact, Lead, Opportunity |
| 5 | Hourly investment | Use this widget to compare the time spent by sellers versus the customer's contacts on a specific record. Learn how this value is calculated. | Account, Lead, and Opportunity |
| 6 | Email engagement | Summarizes how your customer has interacted with the followed emails that your team has sent to them. Unfollowed emails aren't included, so you must enable and use the email engagement feature to see any information here. More information: Use email engagement to view message interactions. | Account, Contact, Lead, Opportunity |
| 7 | Response time | Shows the average amount of time taken by your sellers to respond to customer emails as compared to the time taken by your customers to respond. Connect to Exchange Online to view data in this widget. | Account, Contact |
| 8 | Email sent/received ratio | Compares the number of emails sent by the seller and customer, and displays the following ratios: By them: Indicates the ratio of emails sent by customer as compared to the emails sent by seller. A high ratio means the customer is more active and interested in the conversation. A low customer sent/received ratio means the customer is less responsive and may need more attention or follow-up. By us: Indicates the ratio of emails sent by the seller as compared to the emails sent by the customer. A high seller sent/received ratio means the seller is more proactive and helpful in the conversation. A low seller sent/received ratio means the seller is less engaged and may need to improve their communication skills or offer more value. |
Account, Contact, Lead, Opportunity |
| 9 | Relationship activities | Provides a detailed look at activities over 60 days, broken down by date and activity type, such as emails sent, emails received, meetings sent, meetings received, phone calls made, and phone calls received. Use this widget to view the seller-customer interactions over the last 60 days and gain insight into interaction frequency and period of non-interaction. You can use this insight to define healthy interaction frequency. | Account, Contact, Lead, Opportunity |
| 10 | Similar won deals (not shown in the screenshot) | Shows the list of similar opportunities that have been closed as won. The columns display activities count, time spent, response time, and the response ratio for each opportunity. You can select and open an opportunity to view what has worked better in a deal that was closed as won, and implement these observations in the current deal to help close it as well. The list is refreshed every seven days. To know how the similar won deals are identified, see How are similar won deals identified? | Opportunity |

