Nóta
Aðgangur að þessari síðu krefst heimildar. Þú getur prófað aðskrá þig inn eða breyta skráasöfnum.
Aðgangur að þessari síðu krefst heimildar. Þú getur prófað að breyta skráasöfnum.
Real-Time dashboards help you monitor key metrics, detect anomalies, and make informed decisions. By using Copilot, you can explore the live data behind your dashboard by using natural language, without needing to write KQL queries.
Ask questions about your data, investigate trends, refine results, and generate visualizations. Copilot can explore data across an entire dashboard, a specific data source, or a particular visual. You can then save or share the resulting insights.
Important
This feature is in preview.
Prerequisites
- A workspace with a Microsoft Fabric-enabled capacity.
- A dashboard with visuals. For more information, see Create a Real-Time dashboard.
Explore data with Copilot
Use Copilot to explore live dashboard data by using natural language. For example, you can:
- Change the time range.
- Filter by a column or value.
- Calculate averages, totals, or counts.
- Group results by a column.
- Summarize trends or anomalies across the data.
While Copilot analyzes your request, it provides progress updates so you can follow the exploration process. After the analysis finishes, Copilot summarizes the findings and suggests follow-up questions to help you continue exploring.
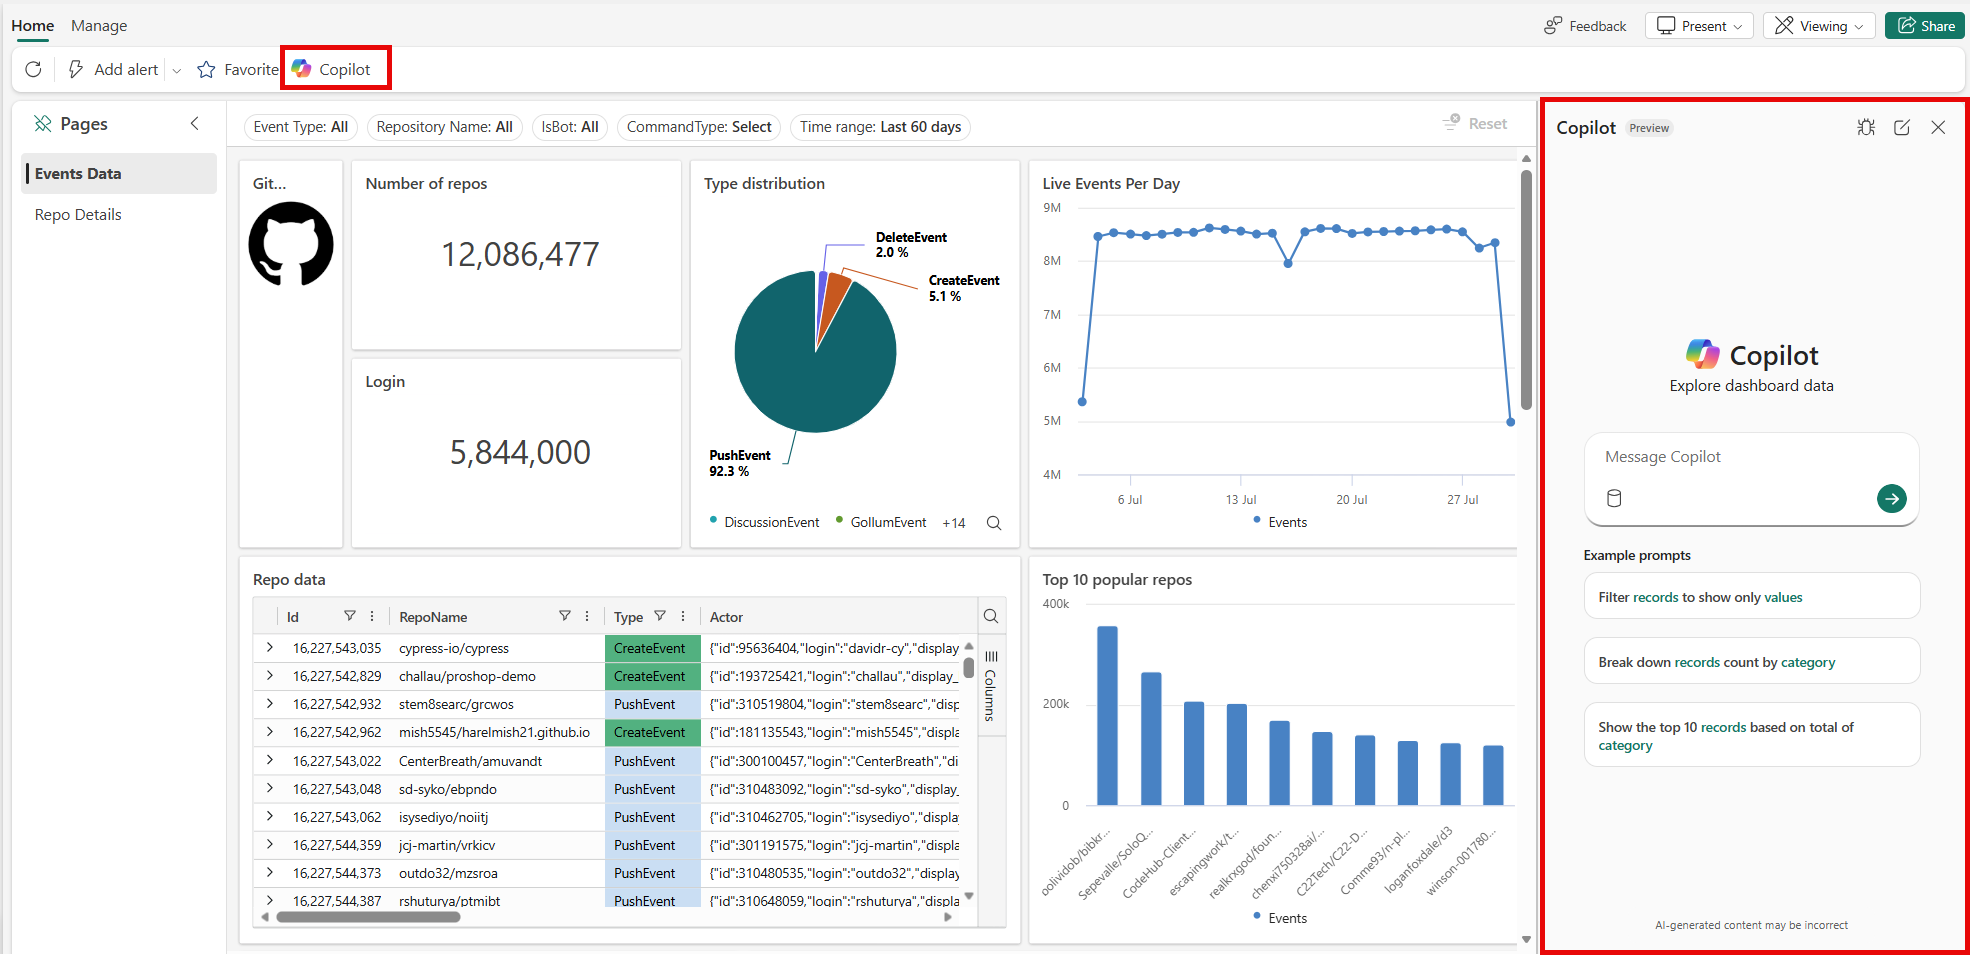
In your Fabric workspace, select a Real-Time dashboard, or create a new dashboard, and ensure you're in Viewing mode. Use the following steps to explore your data with Copilot:
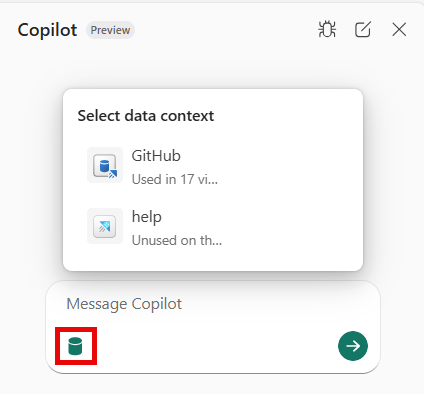
If your dashboard contains multiple data sources, optionally select the data source you want to explore. Copilot uses the selected source as the context for the conversation and provides example prompts tailored to the available data.
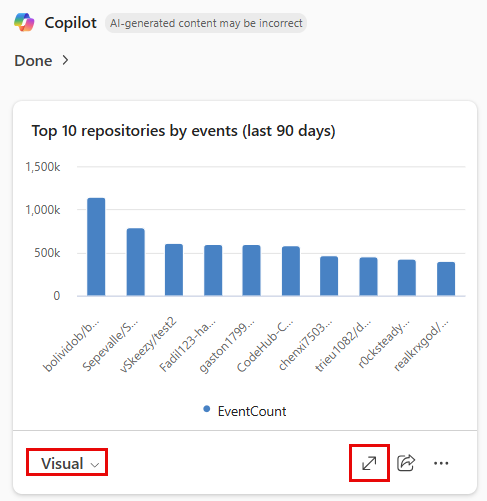
Ask a question about the data. For example, "What are the top 10 popular repos?" or "What is the sign-in success rate?".
Review the progress updates displayed by Copilot while it analyzes the request.
When the analysis is complete, review the generated results, summary, and suggested follow-up prompts. Continue exploring by selecting a suggested prompt or entering your own question.
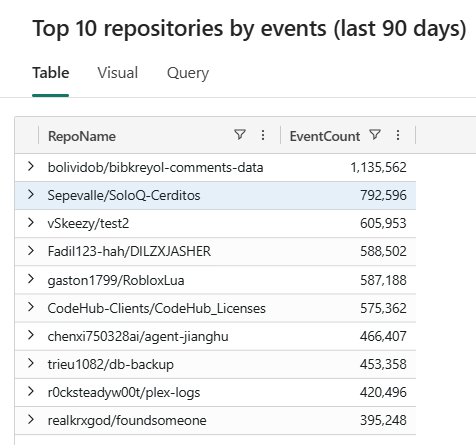
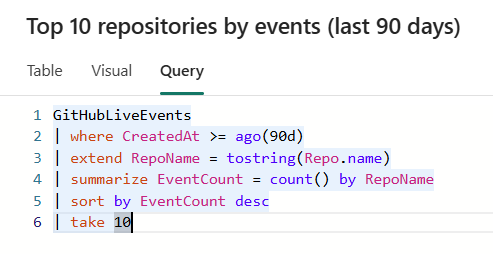
Select the maximize icon to see the results reflected in the Visual, Table, and Query tabs, or use the drop-down menu to choose a specific tab.
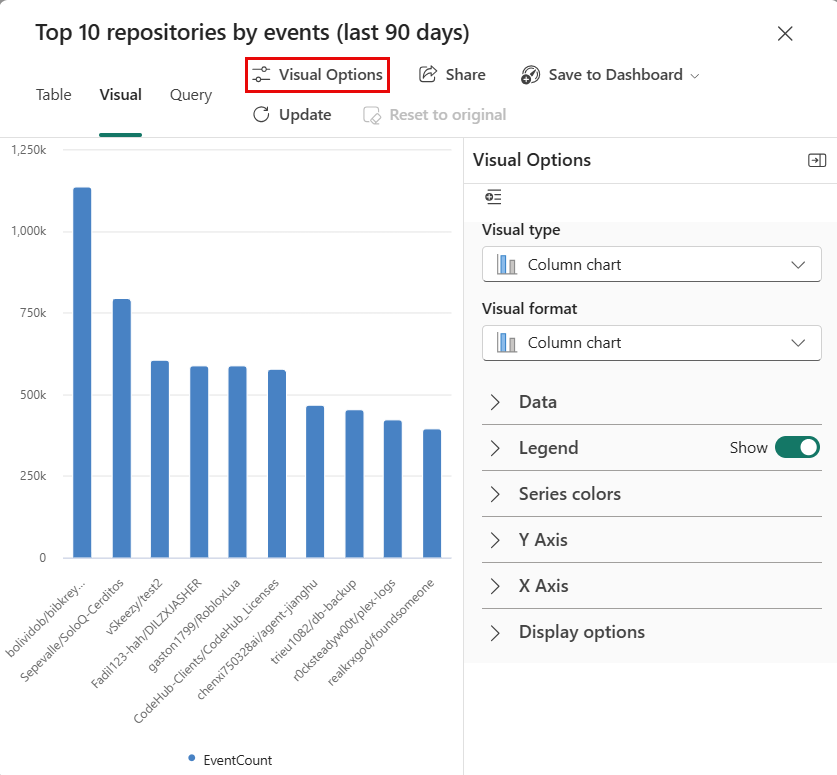
The Visual tab displays a visualization generated from the query results. Select the Visual Options button to customize the visual format and appearance. For more information, see Customize Real-Time Dashboard visuals.
Refine the results by asking more questions or Save and share Copilot exploration insights as needed.
Explore the entire dashboard
By default, Copilot explores data in the context of the entire dashboard. This approach lets you ask questions that span multiple visuals and uncover insights across all dashboard data.
For example, you can ask:
- Which event types are increasing the most across all visuals?
- What unusual patterns appeared in the last 24 hours?
- How did overall performance change compared to the previous week?
Explore a specific data source
In the Copilot side pane, select a specific data source when you want to focus your investigation on a particular dataset rather than the entire dashboard.
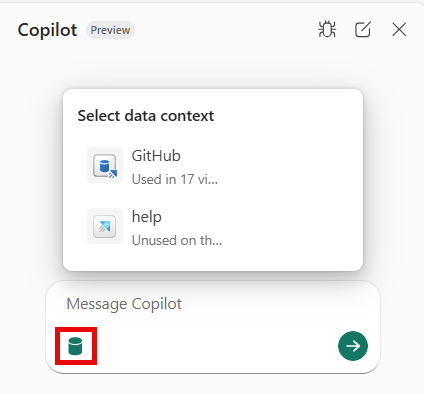
Copilot considers the selected data source as the context for the conversation and generates example prompts tailored to that data source. This approach helps you ask relevant questions and quickly discover insights.
Explore data from a specific visual
You can also begin an exploration from a specific visual. The selected visual provides context for your questions, so you can naturally refer to "this chart" or "these results." Copilot uses that context to understand your intent while analyzing the underlying dataset behind the visual, rather than only the data shown in the visual.
Select the Copilot icon on the visual to explore the data.
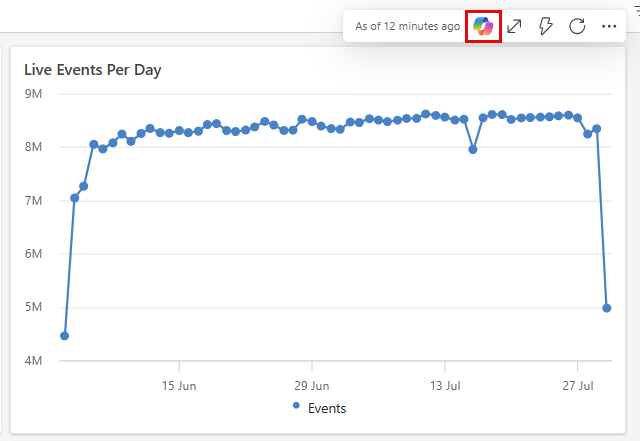
A Copilot pop-up dialog opens with suggested prompts to help you get started exploring the visual's data.
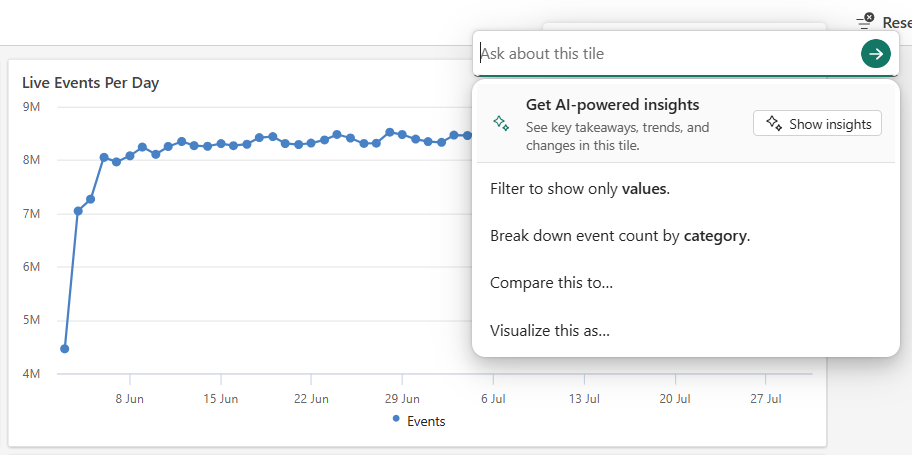
In the side pane, follow Copilot's thought process as it analyzes the data and generates insights.
Review the results and any generated visuals.
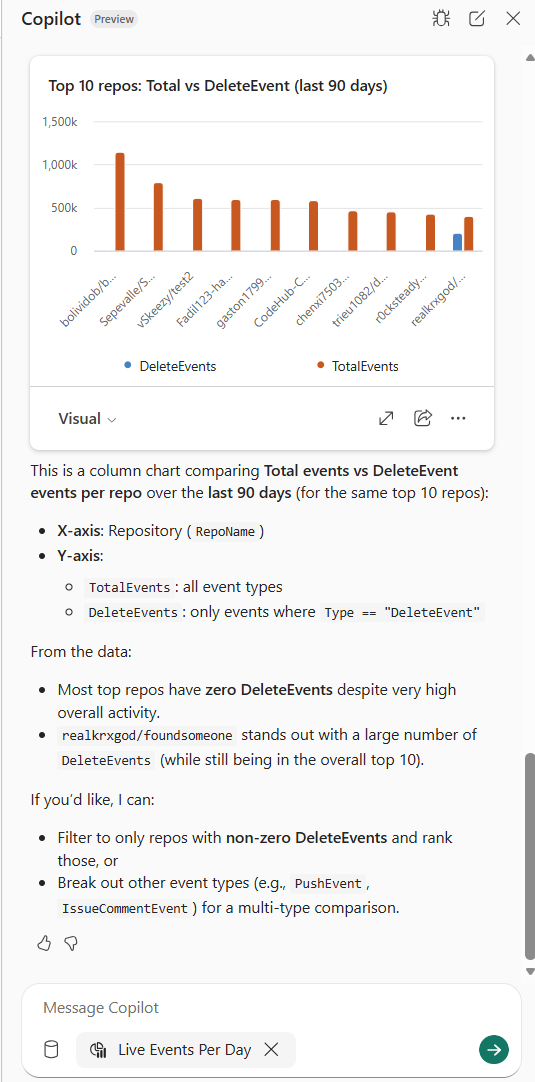
Save or share the generated insights.
Save and share Copilot insights
After discovering an insight with Copilot, you can save it to a dashboard or share it with others.
Save insights to a dashboard
Select Save to dashboard to save the current visualization and query as a dashboard tile. You can save the tile to the current dashboard, an existing dashboard, or a new dashboard.
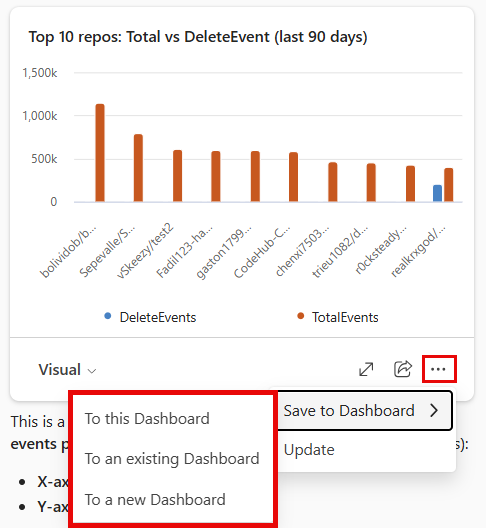
Saved tiles stay connected to the underlying live data and continue updating as new data arrives.
Share insights with others
You can share a link to the Copilot exploration with other users.
Select the share icon in the Copilot pane or in the expanded view.
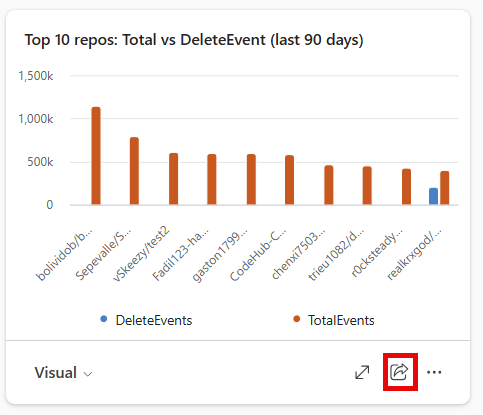
In the share dialog, choose whether to include the visual in the shared insights, and then select Copy link.
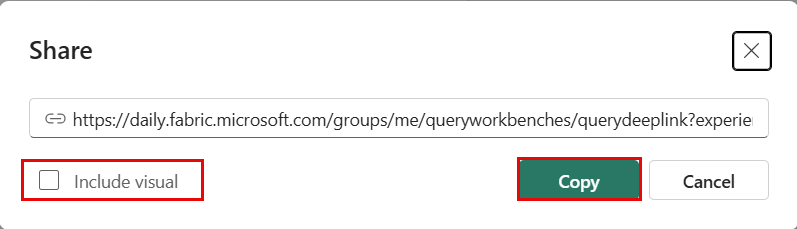
Share the copied link with others. Recipients can view the results, rerun the query, save insights to a dashboard, and customize the visual when one is included.