Nota
L'accesso a questa pagina richiede l'autorizzazione. È possibile provare ad accedere o modificare le directory.
L'accesso a questa pagina richiede l'autorizzazione. È possibile provare a modificare le directory.
Applies to:✅ SQL analytics endpoint and Warehouse in Microsoft Fabric
Questa esercitazione illustra come creare una query con il generatore di query visive.
Nota
This tutorial forms part of an end-to-end scenario. Per completare questa esercitazione, è prima necessario completare queste esercitazioni:
Use the visual query builder
In this task, learn how to create a query with the visual query builder.
Ensure that the workspace you created in the first tutorial is open.
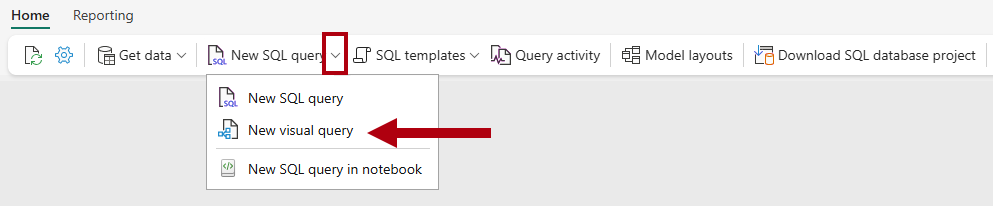
On the Home ribbon, open the New SQL query dropdown, and then select New visual query.
From the Explorer pane, from the
dboschema Tables folder, drag thefact_saletable to the visual query canvas.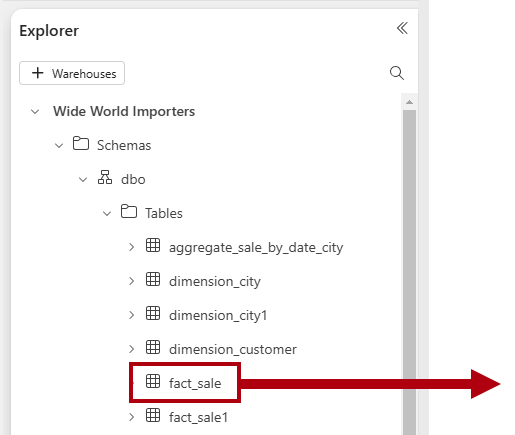
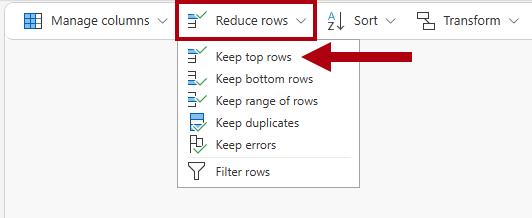
To limit the dataset size, on the query designer ribbon, select Reduce rows>Keep top rows.
In the Keep top rows window, enter
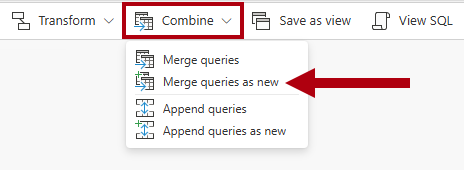
10000, and then select OK.From the Explorer pane, from the
dboschema Tables folder, drag thedimension_citytable to the visual query canvas.To join the tables, on the query designer ribbon, select Combine>Merge queries as new.
Nella finestra di dialogo Merge, completare le impostazioni seguenti:
In the Left table for merge dropdown, select
dimension_city.Nella griglia seguente selezionare la colonna
CityKey.In the Right table for merge dropdown, select
fact_sale.Nella griglia seguente selezionare la colonna
CityKey.In the Join kind section, select Inner.
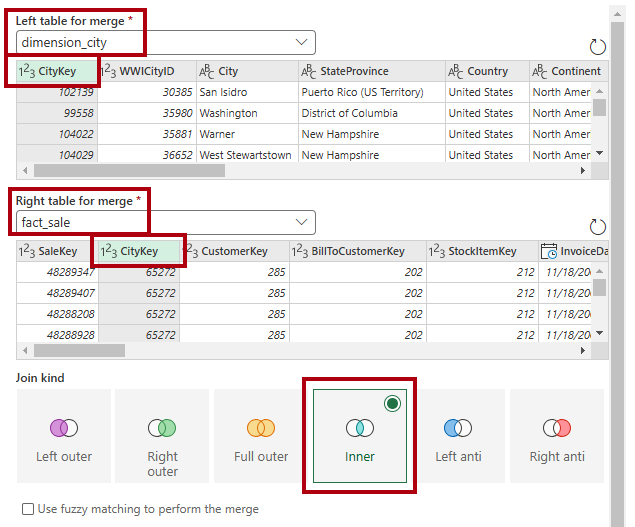
Select OK.
Nel riquadro di anteprima dei dati individuare la colonna
fact_sale(l'ultima colonna).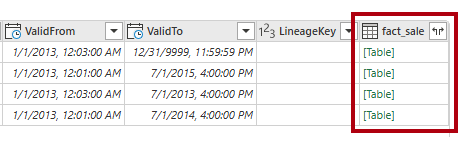
In the
fact_salecolumn header, select the Expand button.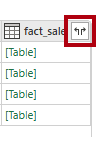
Nella finestra di dialogo selettore di colonna selezionare solo queste tre colonne:
TaxAmount,ProfiteTotalIncludingTax.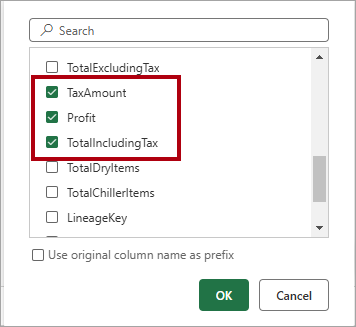
Select OK.
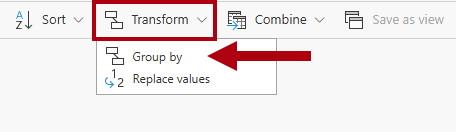
To aggregate the dataset, on the ribbon, select Transform>Group by.
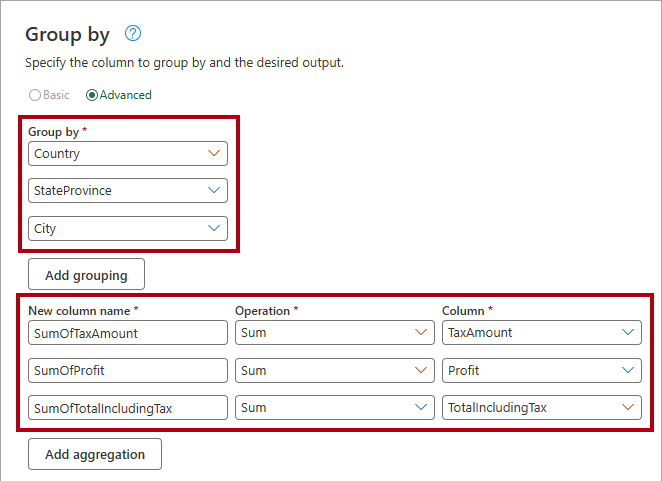
In the Group by dialog, complete the following settings:
In the three Group by dropdowns, set the following options:
CountryStateProvinceCity
In the New column name box, enter the name
SumOfTaxAmount.- In the Operation dropdown, select Sum.
- In the Column dropdown, select
TaxAmount.
Select Add aggregation.
Impostare l'aggregazione come segue:
-
Nuovo nome colonna:
SumOfProfit - Operation: Sum
-
Column:
Profit
-
Nuovo nome colonna:
Aggiungere un'altra aggregazione e impostare l'aggregazione come segue:
-
Nuovo nome colonna:
SumOfTotalIncludingTax - Operation: Sum
-
Column:
TotalIncludingTax
-
Nuovo nome colonna:
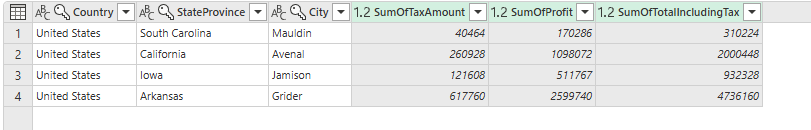
Select OK.
Esaminare il risultato della query nel riquadro di anteprima dei dati.
Rename the query, right-click on the query tab, and then select Rename.
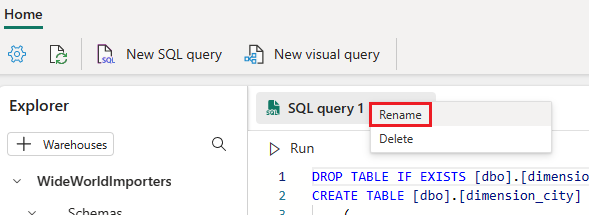
In the Rename window, replace the name with
Sales Summary, and then select Rename.