マップに線レイヤーを追加する (Android SDK)
Note
Azure Maps Android SDK の廃止
Android 用 Azure Maps Native SDK は非推奨となり、2025 年 3 月 31 日に廃止されます。 サービスの中断を回避するには、2025 年 3 月 31 日までに Azure Maps Web SDK に移行します。 詳細については、「Azure Maps Android SDK 移行ガイド」を参照してください。
線レイヤーを使用すると、マップ上にパスまたはルートとして LineString および MultiLineString フィーチャーをレンダリングできます。 また、線レイヤーを使用して、Polygon および MultiPolygon フィーチャーのアウトラインをレンダリングすることもできます。 データ ソースは、レンダリングするデータを提供するために線レイヤーに接続されます。
ヒント
線レイヤーの既定では、データ ソース内の多角形と線の座標がレンダリングされます。 LineString ジオメトリ フィーチャーのみがレンダリングされるようにレイヤーを制限するには、レイヤーの filter オプションを eq(geometryType(), "LineString") に設定します。 MultiLineString フィーチャーも含める場合は、レイヤーの filter オプションを any(eq(geometryType(), "LineString"), eq(geometryType(), "MultiLineString")) に設定します。
[前提条件]
クイックスタート: Android アプリの作成に関する記事の手順を必ず完了してください。 この記事のコード ブロックは、マップ onReady イベント ハンドラーに挿入できます。
線レイヤーを追加する
次のコードは、線の作成方法を示しています。 データ ソースに線を追加した後、LineLayer クラスを使用して、線レイヤーで描画します。
//Create a data source and add it to the map.
DataSource source = new DataSource();
map.sources.add(source);

//Create a list of points.
List<Point> points = Arrays.asList(
    Point.fromLngLat(-73.97234, 40.74327),
    Point.fromLngLat(-74.00442, 40.75680));

//Create a LineString geometry and add it to the data source.
source.add(LineString.fromLngLats(points));

//Create a line layer and add it to the map.
LineLayer layer = new LineLayer(source,
    strokeColor("blue"),
    strokeWidth(5f)
);

map.layers.add(layer);
//Create a data source and add it to the map.
val source = DataSource()
map.sources.add(source)

//Create a list of points.
val points = asList(
    Point.fromLngLat(-73.97234, 40.74327),
    Point.fromLngLat(-74.00442, 40.75680)
)

//Create a LineString geometry and add it to the data source.
source.add(LineString.fromLngLats(points))

//Create a line layer and add it to the map.
val layer = LineLayer(
    source,
    strokeColor("blue"),
    strokeWidth(5f)
)

map.layers.add(layer)
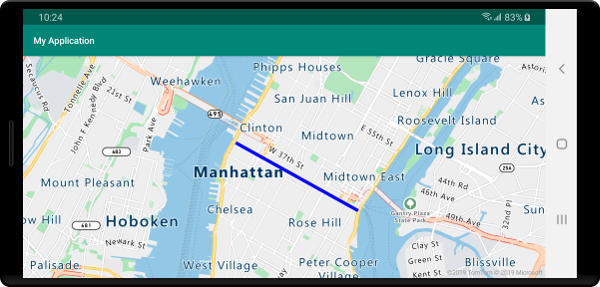
次のスクリーンショットは、上記のコードによって線レイヤーに線が描画されていることを示しています。
データドリブンの線のスタイル
次のコードでは、2 つの線フィーチャーを作成し、各線にプロパティとして速度制限の値を追加します。 線レイヤーでは、速度制限の値に基づいて、データドライブ スタイル式による色が使用されます。 線データは道路に沿ってオーバーレイされるため、次のコードではラベル レイヤーの下に線レイヤーを追加して、道路ラベルを明確に読み取れるようにします。
//Create a data source and add it to the map.
DataSource source = new DataSource();
map.sources.add(source);

//Create a line feature.
Feature feature = Feature.fromGeometry(
    LineString.fromLngLats(Arrays.asList(
        Point.fromLngLat(-122.131821, 47.704033),
        Point.fromLngLat(-122.099919, 47.703678))));

//Add a property to the feature.
feature.addNumberProperty("speedLimitMph", 35);

//Add the feature to the data source.
source.add(feature);

//Create a second line feature.
Feature feature2 = Feature.fromGeometry(
    LineString.fromLngLats(Arrays.asList(
        Point.fromLngLat(-122.126662, 47.708265),
        Point.fromLngLat(-122.126877, 47.703980))));

//Add a property to the second feature.
feature2.addNumberProperty("speedLimitMph", 15);

//Add the second feature to the data source.
source.add(feature2);

//Create a line layer and add it to the map.
LineLayer layer = new LineLayer(source,
    strokeColor(
        interpolate(
            linear(),
            get("speedLimitMph"),
            stop(0, color(Color.GREEN)),
            stop(30, color(Color.YELLOW)),
            stop(60, color(Color.RED))
        )
    ),
    strokeWidth(5f)
);

map.layers.add(layer, "labels");
//Create a data source and add it to the map.
val source = DataSource()
map.sources.add(source)

//Create a line feature.
val feature = Feature.fromGeometry(
    LineString.fromLngLats(
        Arrays.asList(
            Point.fromLngLat(-122.131821, 47.704033),
            Point.fromLngLat(-122.099919, 47.703678)
        )
    )
)

//Add a property to the feature.
feature.addNumberProperty("speedLimitMph", 35)

//Add the feature to the data source.
source.add(feature)

//Create a second line feature.
val feature2 = Feature.fromGeometry(
    LineString.fromLngLats(
        Arrays.asList(
            Point.fromLngLat(-122.126662, 47.708265),
            Point.fromLngLat(-122.126877, 47.703980)
        )
    )
)

//Add a property to the second feature.
feature2.addNumberProperty("speedLimitMph", 15)

//Add the second feature to the data source.
source.add(feature2)

//Create a line layer and add it to the map.
val layer = LineLayer(
    source,
    strokeColor(
        interpolate(
            linear(),
            get("speedLimitMph"),
            stop(0, color(Color.GREEN)),
            stop(30, color(Color.YELLOW)),
            stop(60, color(Color.RED))
        )
    ),
    strokeWidth(5f)
)

map.layers.add(layer, "labels")
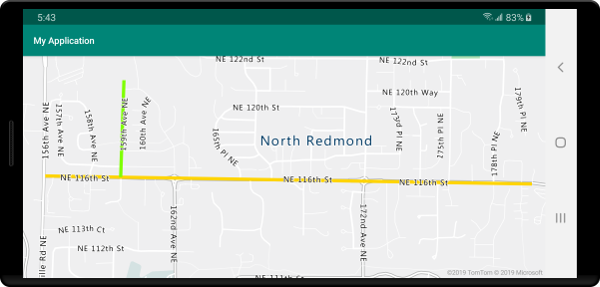
次のスクリーンショットは、上記のコードによって線レイヤーに 2 つの線が描画され、それぞれの色が線フィーチャーのプロパティに基づいてデータドリブン スタイルの式から取得されていることを示しています。
ストロークのグラデーションを線に追加する
線に 1 つのストロークの色を適用できます。 さらに、線を色のグラデーションで塗りつぶして、1 つの線分から次の線分への遷移を示すこともできます。 たとえば、線のグラデーションを使用して、時間と距離の変化やオブジェクトを接続した線のさまざまな温度を表すことができます。 線にこの機能を適用するためには、データ ソースで lineMetrics オプションが true に設定されている必要があります。それにより、色のグラデーション式を線の strokeColor オプションに渡すことができます。 ストロークのグラデーション式は、計算済みのメトリックを式に公開する lineProgress データ式を参照する必要があります。
//Create a data source and add it to the map.
DataSource source = new DataSource(
    //Enable line metrics on the data source. This is needed to enable support for strokeGradient.
    withLineMetrics(true)
);
map.sources.add(source);

//Create a line and add it to the data source.
source.add(LineString.fromLngLats(
    Arrays.asList(
        Point.fromLngLat(-122.18822, 47.63208),
        Point.fromLngLat(-122.18204, 47.63196),
        Point.fromLngLat(-122.17243, 47.62976),
        Point.fromLngLat(-122.16419, 47.63023),
        Point.fromLngLat(-122.15852, 47.62942),
        Point.fromLngLat(-122.15183, 47.62988),
        Point.fromLngLat(-122.14256, 47.63451),
        Point.fromLngLat(-122.13483, 47.64041),
        Point.fromLngLat(-122.13466, 47.64422),
        Point.fromLngLat(-122.13844, 47.65440),
        Point.fromLngLat(-122.13277, 47.66515),
        Point.fromLngLat(-122.12779, 47.66712),
        Point.fromLngLat(-122.11595, 47.66712),
        Point.fromLngLat(-122.11063, 47.66735),
        Point.fromLngLat(-122.10668, 47.67035),
        Point.fromLngLat(-122.10565, 47.67498)
    )
));

//Create a line layer and pass in a gradient expression for the strokeGradient property.
map.layers.add(new LineLayer(source,
    strokeWidth(6f),

    //Pass an interpolate or step expression that represents a gradient.
    strokeGradient(
        interpolate(
            linear(),
            lineProgress(),
            stop(0, color(Color.BLUE)),
            stop(0.1, color(Color.argb(255, 65, 105, 225))), //Royal Blue
            stop(0.3, color(Color.CYAN)),
            stop(0.5, color(Color.argb(255,0, 255, 0))), //Lime
            stop(0.7, color(Color.YELLOW)),
            stop(1, color(Color.RED))
        )
    )
));
//Create a data source and add it to the map.
val source = DataSource(
    //Enable line metrics on the data source. This is needed to enable support for strokeGradient.
    withLineMetrics(true)
)
map.sources.add(source)

//Create a line and add it to the data source.
source.add(
    LineString.fromLngLats(
        Arrays.asList(
            Point.fromLngLat(-122.18822, 47.63208),
            Point.fromLngLat(-122.18204, 47.63196),
            Point.fromLngLat(-122.17243, 47.62976),
            Point.fromLngLat(-122.16419, 47.63023),
            Point.fromLngLat(-122.15852, 47.62942),
            Point.fromLngLat(-122.15183, 47.62988),
            Point.fromLngLat(-122.14256, 47.63451),
            Point.fromLngLat(-122.13483, 47.64041),
            Point.fromLngLat(-122.13466, 47.64422),
            Point.fromLngLat(-122.13844, 47.65440),
            Point.fromLngLat(-122.13277, 47.66515),
            Point.fromLngLat(-122.12779, 47.66712),
            Point.fromLngLat(-122.11595, 47.66712),
            Point.fromLngLat(-122.11063, 47.66735),
            Point.fromLngLat(-122.10668, 47.67035),
            Point.fromLngLat(-122.10565, 47.67498)
        )
    )
)

//Create a line layer and pass in a gradient expression for the strokeGradient property.
map.layers.add(
    LineLayer(
        source,
        strokeWidth(6f),

        //Pass an interpolate or step expression that represents a gradient.
        strokeGradient(
            interpolate(
                linear(),
                lineProgress(),
                stop(0, color(Color.BLUE)),
                stop(0.1, color(Color.argb(255, 65, 105, 225))),  //Royal Blue
                stop(0.3, color(Color.CYAN)),
                stop(0.5, color(Color.argb(255, 0, 255, 0))),  //Lime
                stop(0.7, color(Color.YELLOW)),
                stop(1, color(Color.RED))
            )
        )
    )
)
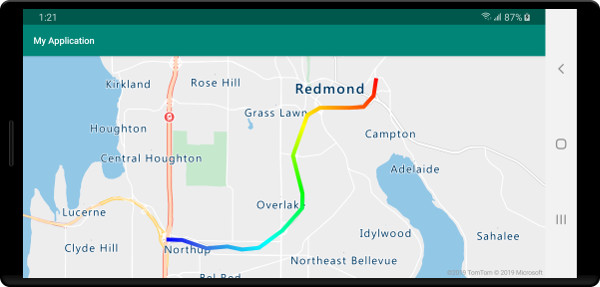
次のスクリーンショットは、上のコードによって、グラデーション ストロークの色を使用してレンダリングされた線を表示しています。
線に沿ってシンボルを追加する
このサンプルでは、マップ上の線に沿って矢印アイコンを追加する方法を示します。 シンボル レイヤーを使用する場合は、symbolPlacement オプションを SymbolPlacement.LINE に設定します。 これによって、線に沿って記号がレンダリングされ、アイコンが回転します (0° = 右)。
//Create a data source and add it to the map.
DataSource source = new DataSource();
map.sources.add(source);

//Load a image of an arrow into the map image sprite and call it "arrow-icon".
map.images.add("arrow-icon", R.drawable.purple_arrow_right);

//Create and add a line to the data source.
source.add(LineString.fromLngLats(Arrays.asList(
    Point.fromLngLat(-122.18822, 47.63208),
    Point.fromLngLat(-122.18204, 47.63196),
    Point.fromLngLat(-122.17243, 47.62976),
    Point.fromLngLat(-122.16419, 47.63023),
    Point.fromLngLat(-122.15852, 47.62942),
    Point.fromLngLat(-122.15183, 47.62988),
    Point.fromLngLat(-122.14256, 47.63451),
    Point.fromLngLat(-122.13483, 47.64041),
    Point.fromLngLat(-122.13466, 47.64422),
    Point.fromLngLat(-122.13844, 47.65440),
    Point.fromLngLat(-122.13277, 47.66515),
    Point.fromLngLat(-122.12779, 47.66712),
    Point.fromLngLat(-122.11595, 47.66712),
    Point.fromLngLat(-122.11063, 47.66735),
    Point.fromLngLat(-122.10668, 47.67035),
    Point.fromLngLat(-122.10565, 47.67498)))
);

//Create a line layer and add it to the map.
map.layers.add(new LineLayer(source,
    strokeColor("DarkOrchid"),
    strokeWidth(5f)
));

//Create a symbol layer and add it to the map.
map.layers.add(new SymbolLayer(source,
    //Space symbols out along line.
    symbolPlacement(SymbolPlacement.LINE),

    //Spread the symbols out 100 pixels apart.
    symbolSpacing(100f),

    //Use the arrow icon as the symbol.
    iconImage("arrow-icon"),

    //Allow icons to overlap so that they aren't hidden if they collide with other map elements.
    iconAllowOverlap(true),

    //Center the symbol icon.
    iconAnchor(AnchorType.CENTER),

    //Scale the icon size.
    iconSize(0.8f)
));
//Create a data source and add it to the map.
val source = DataSource()
map.sources.add(source)

//Load a image of an arrow into the map image sprite and call it "arrow-icon".
map.images.add("arrow-icon", R.drawable.purple_arrow_right)

//Create and add a line to the data source.
//Create and add a line to the data source.
source.add(
    LineString.fromLngLats(
        Arrays.asList(
            Point.fromLngLat(-122.18822, 47.63208),
            Point.fromLngLat(-122.18204, 47.63196),
            Point.fromLngLat(-122.17243, 47.62976),
            Point.fromLngLat(-122.16419, 47.63023),
            Point.fromLngLat(-122.15852, 47.62942),
            Point.fromLngLat(-122.15183, 47.62988),
            Point.fromLngLat(-122.14256, 47.63451),
            Point.fromLngLat(-122.13483, 47.64041),
            Point.fromLngLat(-122.13466, 47.64422),
            Point.fromLngLat(-122.13844, 47.65440),
            Point.fromLngLat(-122.13277, 47.66515),
            Point.fromLngLat(-122.12779, 47.66712),
            Point.fromLngLat(-122.11595, 47.66712),
            Point.fromLngLat(-122.11063, 47.66735),
            Point.fromLngLat(-122.10668, 47.67035),
            Point.fromLngLat(-122.10565, 47.67498)
        )
    )
)

//Create a line layer and add it to the map.
map.layers.add(
    LineLayer(
        source,
        strokeColor("DarkOrchid"),
        strokeWidth(5f)
    )
)

//Create a symbol layer and add it to the map.
map.layers.add(
    SymbolLayer(
        source,  //Space symbols out along line.
        symbolPlacement(SymbolPlacement.LINE),  //Spread the symbols out 100 pixels apart.
        symbolSpacing(100f),  //Use the arrow icon as the symbol.
        iconImage("arrow-icon"),  //Allow icons to overlap so that they aren't hidden if they collide with other map elements.
        iconAllowOverlap(true),  //Center the symbol icon.
        iconAnchor(AnchorType.CENTER),  //Scale the icon size.
        iconSize(0.8f)
    )
)
このサンプルでは、次の画像がアプリのドローアブル フォルダーに読み込まれています。
purple-arrow-right.png |
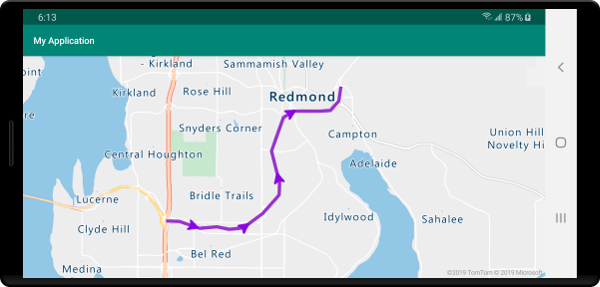
次のスクリーンショットは、上記のコードによって、線とともに矢印アイコンが表示されていることを示しています。
次のステップ
マップに追加できる他のコード サンプルについては、次の記事をご覧ください。