series_mv_if_anomalies_fl()
関数series_mv_if_anomalies_fl()は、scikit-learn から分離フォレスト モデルを適用することで、一連の多変量異常を検出するユーザー定義関数 (UDF) です。 関数は、系列のセットを数値動的配列、特徴列の名前、および系列全体の異常の予想される割合として受け入れます。 関数は、各系列の分離ツリーのアンサンブルを構築し、異常として迅速に分離されたポイントをマークします。
前提条件
- クラスターで Python プラグインを有効にする必要があります。 これは、 関数で使用されるインライン Python に必要です。
- データベースで Python プラグイン を有効にする必要があります。 これは、 関数で使用されるインライン Python に必要です。
構文
T | invoke series_mv_if_anomalies_fl(, features_colsanomaly_col [,score_col [,anomalies_pct [,num_trees [,samples_pct]]])
構文規則について詳しく知る。
パラメーター
| 名前 | 型 | 必須 | 説明 |
|---|---|---|---|
| features_cols | dynamic |
✔️ | 多変量異常検出モデルに使用される列の名前を含む配列。 |
| anomaly_col | string |
✔️ | 検出された異常を格納する列の名前。 |
| score_col | string |
異常のスコアを格納する列の名前。 | |
| anomalies_pct | real |
データ内の異常の予想される割合を指定する [0 から 50] の範囲内の実数。 既定値: 4% | |
| num_trees | int |
時系列ごとに構築する分離ツリーの数。 既定値は 100 です。 | |
| samples_pct | real |
各ツリーの構築に使用されるサンプルの割合を指定する [0 から 100] の範囲内の実数。 既定値は 100% です。つまり、完全な系列を使用します。 |
関数の定義
関数を定義するには、次のように、コードをクエリ定義関数として埋め込むか、データベースに格納されている関数として作成します。
次の let ステートメントを使用して関数を定義します。 権限は必要ありません。
重要
let ステートメントは単独では実行できません。 その後に 表形式の式ステートメントを記述する必要があります。 の動作例を実行するには、「例series_mv_if_anomalies_fl()」を参照してください。
// Define function
let series_mv_if_anomalies_fl=(tbl:(*), features_cols:dynamic, anomaly_col:string, score_col:string='', anomalies_pct:real=4.0, num_trees:int=100, samples_pct:real=100.0)
{
    let kwargs = bag_pack('features_cols', features_cols, 'anomaly_col', anomaly_col, 'score_col', score_col, 'anomalies_pct', anomalies_pct, 'num_trees', num_trees, 'samples_pct', samples_pct);
    let code = ```if 1:
        from sklearn.ensemble import IsolationForest
        features_cols = kargs['features_cols']
        anomaly_col = kargs['anomaly_col']
        score_col = kargs['score_col']
        anomalies_pct = kargs['anomalies_pct']
        num_trees = kargs['num_trees']
        samples_pct = kargs['samples_pct']
        dff = df[features_cols]
        iforest = IsolationForest(contamination=anomalies_pct/100.0, random_state=0, n_estimators=num_trees, max_samples=samples_pct/100.0)
        for i in range(len(dff)):
            dffi = dff.iloc[[i], :]
            dffe = dffi.explode(features_cols)
            iforest.fit(dffe)
            df.loc[i, anomaly_col] = (iforest.predict(dffe) < 0).astype(int).tolist()
            if score_col != '':
                df.loc[i, score_col] = iforest.decision_function(dffe).tolist()
        result = df
    ```;
    tbl
    | evaluate hint.distribution=per_node python(typeof(*), code, kwargs)
};
// Write your query to use the function here.
例
次の例では、 invoke 演算子 を使用して関数を実行します。
クエリ定義関数を使用するには、埋め込み関数定義の後にそれを呼び出します。
// Define function
let series_mv_if_anomalies_fl=(tbl:(*), features_cols:dynamic, anomaly_col:string, score_col:string='', anomalies_pct:real=4.0, num_trees:int=100, samples_pct:real=100.0)
{
let kwargs = bag_pack('features_cols', features_cols, 'anomaly_col', anomaly_col, 'score_col', score_col, 'anomalies_pct', anomalies_pct, 'num_trees', num_trees, 'samples_pct', samples_pct);
let code = ```if 1:
from sklearn.ensemble import IsolationForest
features_cols = kargs['features_cols']
anomaly_col = kargs['anomaly_col']
score_col = kargs['score_col']
anomalies_pct = kargs['anomalies_pct']
num_trees = kargs['num_trees']
samples_pct = kargs['samples_pct']
dff = df[features_cols]
iforest = IsolationForest(contamination=anomalies_pct/100.0, random_state=0, n_estimators=num_trees, max_samples=samples_pct/100.0)
for i in range(len(dff)):
dffi = dff.iloc[[i], :]
dffe = dffi.explode(features_cols)
iforest.fit(dffe)
df.loc[i, anomaly_col] = (iforest.predict(dffe) < 0).astype(int).tolist()
if score_col != '':
df.loc[i, score_col] = iforest.decision_function(dffe).tolist()
result = df
```;
tbl
| evaluate hint.distribution=per_node python(typeof(*), code, kwargs)
};
// Usage
normal_2d_with_anomalies
| extend anomalies=dynamic(null), scores=dynamic(null)
| invoke series_mv_if_anomalies_fl(pack_array('x', 'y'), 'anomalies', 'scores', anomalies_pct=8, num_trees=1000)
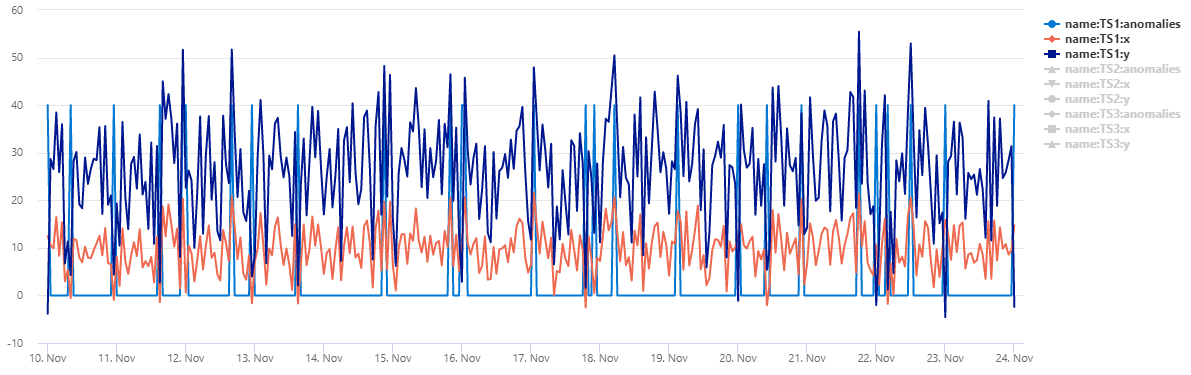
| extend anomalies=series_multiply(40, anomalies)
| render timechart
出力
テーブル normal_2d_with_anomaliesには、3 つの時系列のセットが含まれています。 各時系列には 2 次元正規分布があり、毎日の異常が午前 0 時、午前 8 時、午後 4 時に追加されます。 このサンプル データセットは、 クエリの例を使用して作成できます。
散布図としてデータを表示するには、使用コードを次のように置き換えます。
normal_2d_with_anomalies
| extend anomalies=dynamic(null)
| invoke series_mv_if_anomalies_fl(pack_array('x', 'y'), 'anomalies')
| where name == 'TS1'
| project x, y, anomalies
| mv-expand x to typeof(real), y to typeof(real), anomalies to typeof(string)
| render scatterchart with(series=anomalies)
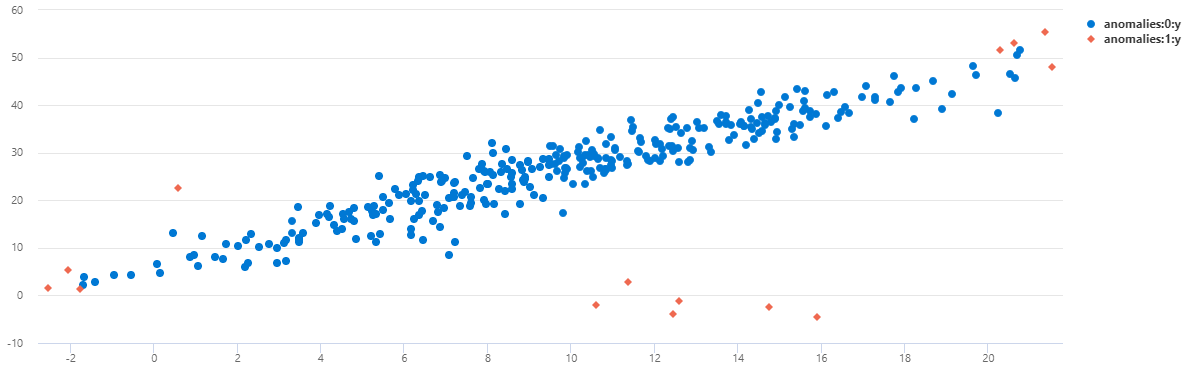
TS2 では、午前 8 時に発生した異常のほとんどは、この多変量モデルを使用して検出されたことがわかります。
この機能はサポートされていません。
フィードバック
以下は間もなく提供いたします。2024 年を通じて、コンテンツのフィードバック メカニズムとして GitHub の issue を段階的に廃止し、新しいフィードバック システムに置き換えます。 詳細については、「https://aka.ms/ContentUserFeedback」を参照してください。
フィードバックの送信と表示