チュートリアル: マネージド プライベート エンドポイントを使用して AKS クラスター上のセルフホステッド Prometheus サービスに接続する
このガイドでは、オープンソースの監視およびアラート ツールキットである Prometheus を Azure Kubernetes Service (AKS) クラスターにインストールする手順について説明します。 次に、Azure Managed Grafana のマネージド プライベート エンドポイントを使用して、この Prometheus サーバーに接続し、Grafana ダッシュボードに Prometheus データを表示します。
このチュートリアルでは、次の作業を行う方法について説明します。
- Azure Kubernetes Service クラスターを作成する
- Prometheus をインストールする
- Prometheus サーバーにプライベート リンク サービスを追加する
- マネージド プライベート エンドポイントを使用して接続する
- Grafana ダッシュボードに Prometheus データを表示する
前提条件
作業を開始する前に、次の準備ができていることを確認します。
Azure Kubernetes Service クラスターを作成する
az loginコマンドを実行して、Azure CLI にサインインします。az login複数の Azure サブスクリプションがある場合は、コマンド
az account set -s <your-azure-subscription-id>を使用して Azure サブスクリプションを選択します。kubectl をインストールまたは更新します。
az aks install-cli2 つの bash/zsh 変数を作成します。これは後続のコマンドで使用します。 別のシェルを使用している場合は、次の構文を変更します。
RESOURCE_GROUP=myResourceGroup
AKS_NAME=myaks
リソース グループを作成する。 この例では、米国中西部の Azure リージョンにリソース グループを作成します。
az group create --name $RESOURCE_GROUP --location westcentralusaz aks create コマンドを使用して、新しい AKS クラスターを作成します。 ここでは、B シリーズのバースト可能な仮想マシンの種類を使用して 3 ノード クラスターを作成します。これはコスト効率が高く、このような小規模なテスト/開発ワークロードに適しています。
az aks create --resource-group $RESOURCE_GROUP \
  --name $AKS_NAME \
  --node-count 3 \
  --node-vm-size Standard_B2s \
  --generate-ssh-keys
この操作は、完了するまで数分かかる場合があります。
作成したクラスターに対して認証します。
az aks get-credentials \
  --resource-group $RESOURCE_GROUP \
  --name $AKS_NAME
kubectl を使用して Kubernetes クラスターにアクセスできるようになりました。
kubectl を使用して、作成したノードを確認します。
kubectl get nodes
Prometheus をインストールする
Prometheus をインストールする一般的な方法は、prometheus-operator を使用することです。これにより、Prometheus および関連する監視コンポーネントの Kubernetes ネイティブ デプロイと管理が提供されます。 このチュートリアルでは、kube-prometheus-stack Helm チャート 使用して、prometheus-operator をデプロイします。
helm-charts リポジトリを追加し、リポジトリの一覧を更新します。
helm repo add prometheus-community https://prometheus-community.github.io/helm-charts
helm repo update
Helm チャートを監視と呼ばれる名前空間にインストールします。 この名前空間は自動的に作成されます。
helm install prometheus \
  prometheus-community/kube-prometheus-stack \
  --namespace monitoring \
  --create-namespace
helm コマンドは、デプロイされたポッドの状態を確認するように求めます。 次のコマンドを実行します。
kubectl --namespace monitoring get pods続行する前に、ポッドがすべて "実行中" であることを確認します。 万一、実行状態に達しない場合は、トラブルシューティングを行う必要があります。
Prometheus サーバーにプライベート リンク サービスを追加する
Azure Private Link サービスを使用すると、異なる Azure 仮想ネットワーク間のプライベート リンクを介して Kubernetes サービスを使用できます。 AKS は、Azure Private Link Service と ネイティブ統合されており、Kubernetes サービス オブジェクトに注釈を付けて、Azure 内に対応するプライベート リンク サービスを作成するのに役立ちます。
以下の pls-prometheus-svc.yaml ファイルの内容を参照してください。
apiVersion: v1
kind: Service
metadata:
  name: prom-pls-svc
  annotations:
    service.beta.kubernetes.io/azure-load-balancer-internal: "true" # Use an internal LB with PLS
    service.beta.kubernetes.io/azure-pls-create: "true"
    service.beta.kubernetes.io/azure-pls-name: promManagedPls
    service.beta.kubernetes.io/azure-pls-proxy-protocol: "false"
    service.beta.kubernetes.io/azure-pls-visibility: "*"
spec:
  type: LoadBalancer
  selector:
    # app: myApp
    app.kubernetes.io/name: prometheus
    prometheus: prometheus-kube-prometheus-prometheus # note that this is related to the release name
  ports:
    - name: http-web
      protocol: TCP
      port: 9090
      targetPort: 9090
次のコマンドを実行して、プライベート リンク サービスを Prometheus サーバーに追加します。
kubectl --namespace monitoring apply -f pls-prometheus-svc.yaml名前が
promManagedPlsのプライベート リンク サービスは、AKS マネージド リソース グループに作成されます。 このプロセスには数分かかります。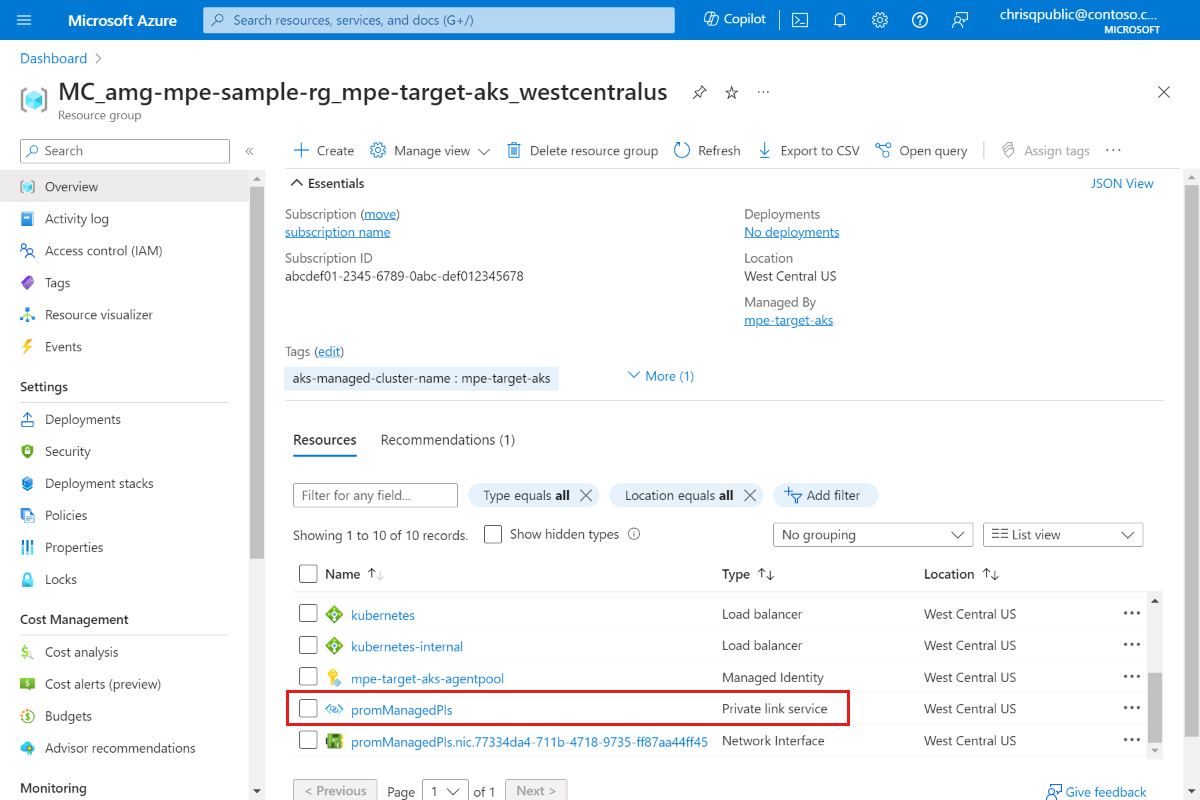
マネージド プライベート エンドポイントを使用して接続する
Azure Managed Grafana ワークスペースをまだお持ちでない場合は、「Azure Managed Grafana クイック スタート」に従って作成します。
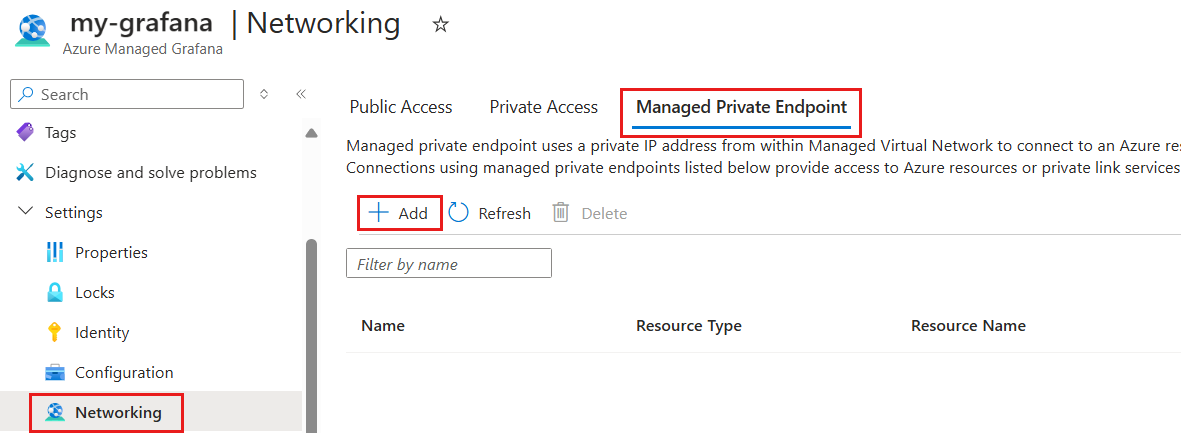
Azure Managed Grafana ワークスペースを開き、[ネットワーク]>[マネージド プライベート エンドポイント]>[作成] に移動します。
マネージド プライベート エンドポイントの名前を入力し、Azure サブスクリプションを選択します。
[リソースの種類] で Microsoft.Network/privateLinkServices (プライベート リンク サービス) を選択し、[ターゲット リソース] で上記の手順で作成した
promManagedPlsプライベート リンク サービスを選択します。 各マネージド プライベート エンドポイントは、プライベート IP アドレスを取得します。 このマネージド プライベート エンドポイントのドメイン名を指定することもできます。 Azure Managed Grafana サービスでは、このドメインが Azure Managed Grafana 環境内のマネージド プライベート エンドポイントのプライベート IP に確実に解決されます。 たとえば、ドメインを*.prom.my-own-domain.comに設定します。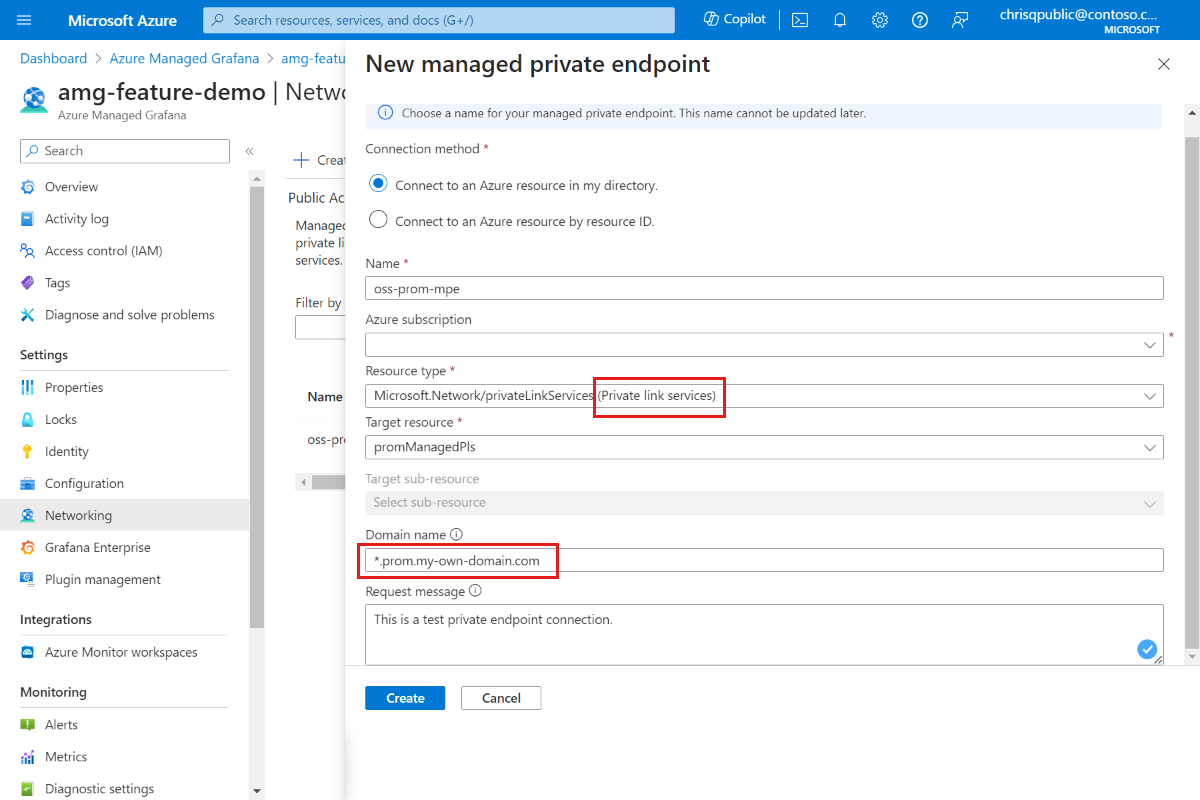
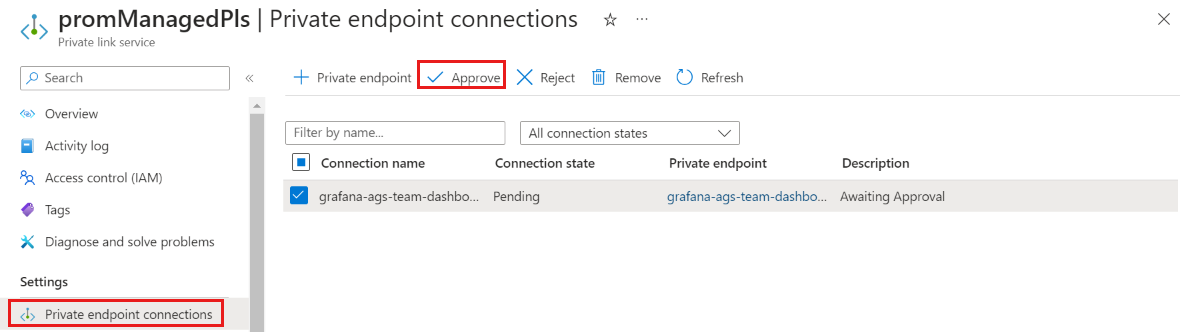
promManagedPls リソースに移動して、プライベート エンドポイント接続を承認します。 [設定] で、 [プライベート エンドポイント接続] に移動し、チェックボックスを使用して接続を選択し、承認します。
プライベート エンドポイント接続が承認されたら、Azure Managed Grafana リソースに戻り、[マネージド プライベート エンドポイント] タブの [更新] ボタンを選択して、
Connection stateを同期します。 これで、承認済みと表示されます。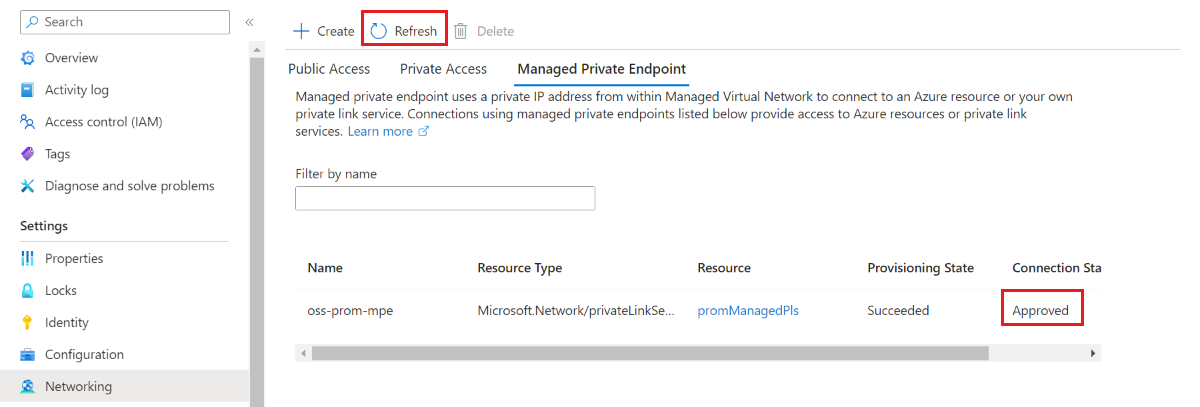
Grafana ダッシュボードに Prometheus データを表示する
Prometheus データ ソースを Grafana ポータルから Grafana に追加します。 詳細については、「データ ソースを追加する」を参照してください。 Prometheus URL は
http://prom-service.prom.my-own-domain.com:9090です。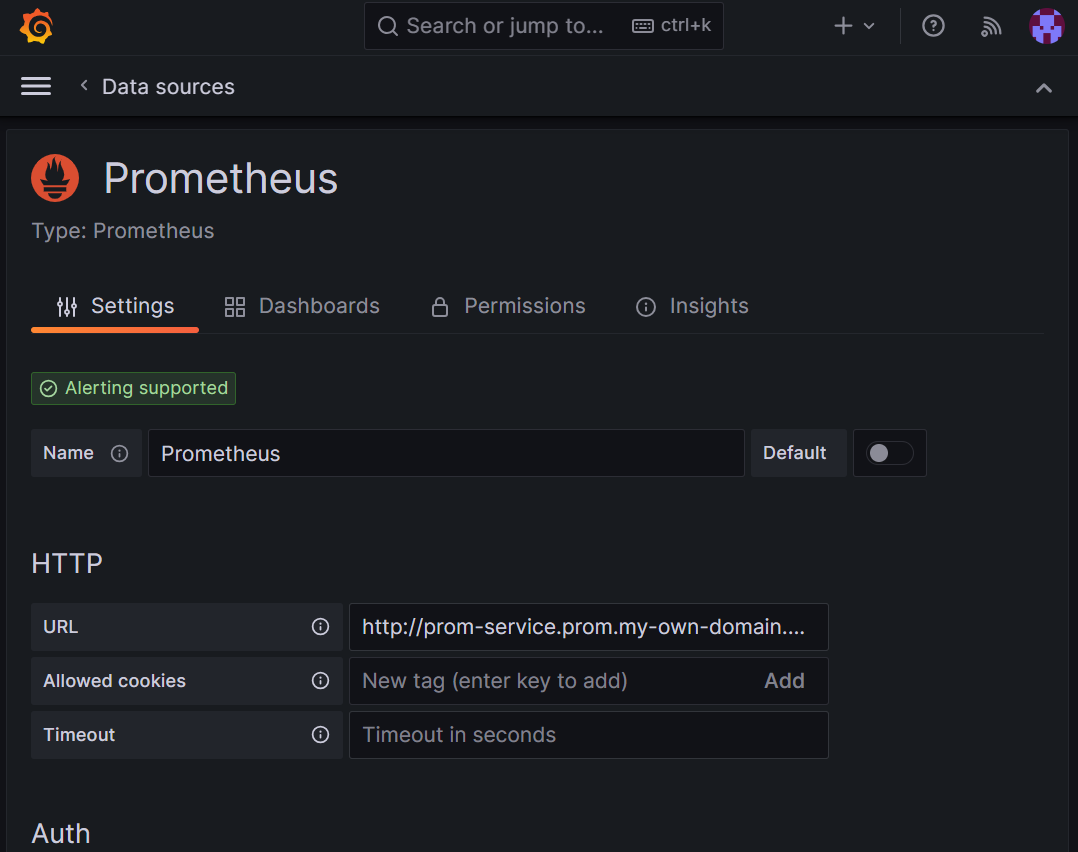
セルフホステッド Prometheus データ ソースを活用するには、Node Exporter Full ダッシュボードの ID
1860を使用してみてください。 その他のガイドラインについては、「Grafana Labs からダッシュボードをインポートする」を参照してください。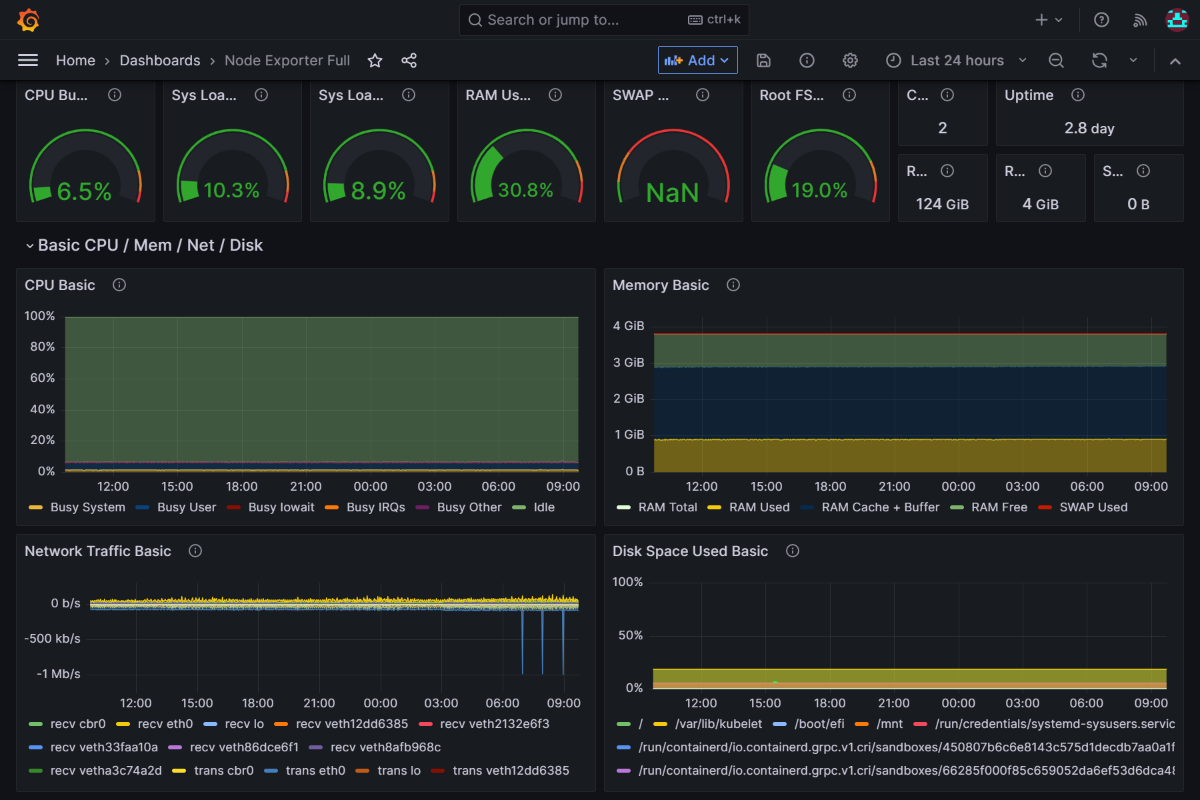
次のステップ
サービス アカウントを使用する方法について説明します。
フィードバック
以下は間もなく提供いたします。2024 年を通じて、コンテンツのフィードバック メカニズムとして GitHub の issue を段階的に廃止し、新しいフィードバック システムに置き換えます。 詳細については、「https://aka.ms/ContentUserFeedback」を参照してください。
フィードバックの送信と表示