このモジュールの完了には約 25 分かかります。 データフローを作成し、変換を適用し、 ブロンズ データ レイヤー テーブルから ゴールド データ レイヤー テーブルに生データを移動します。
最後のモジュールでブロンズの Lakehouse テーブルに読み込まれた生データを活用し、それを充実させることができます。 特定の日に各ベンダーとその旅行の割引を含む別のテーブルと組み合わせます。 次に、この最後の「ゴールド」Lakehouse テーブルがロードされ、利用可能になります。
データフローの手順の概要は次のとおりです。
- 「モジュール 1: コピー ジョブを使用してデータを取り込む」で作成されたLakehouseテーブルから生データを取得します。
- Lakehouse テーブルからインポートされたデータを変換します。
- 割引データを含む CSV ファイルに接続します。
- 割引データを変換します。
- 乗車と割引データを組み合わせます。
- Gold Lakehouse テーブルに出力クエリを読み込みます。
[前提条件]
このチュートリアル シリーズのモジュール 1: コピー ジョブを使用してデータを取り込む
Lakehouse テーブルからデータを取得する
サイドバーからワークスペースを選択し、[ 新しい項目] を選択し、[ Dataflow Gen2 ] を選択して新しい Dataflow Gen2 を作成します。
![データフロー Gen2 ボタンが強調表示された [Fabric作成] ページを示すスクリーンショット。](media/tutorial-end-to-end-dataflow/create-new-dataflow-inline.png)
新しいデータフロー メニューから、[ データの取得] を選択し、[ その他...] を選択します。
![[データの取得] ボタンが強調表示され、[その他]が強調表示されている [データフロー] メニューを示すスクリーンショット。..オプションがメニューから強調表示されています。](media/tutorial-end-to-end-dataflow/get-data-button.png)
Lakehouse コネクタを検索して選択します。
![[データ ソースの選択] メニューからの Lakehouse データ ソースの選択を示すスクリーンショット。](media/tutorial-end-to-end-dataflow/choose-lakehouse-data-source.png)
[ データ ソースへの接続 ] ダイアログが表示され、現在サインインしているユーザーに基づいて新しい接続が自動的に作成されます。 [次へ] を選択します。
![現在サインインしているユーザーが選択され、[次へ] ボタンが選択されている新しい Lakehouse のデータ ソース設定の構成を示すスクリーンショット。](media/tutorial-end-to-end-dataflow/lakehouse-settings-inline.png)
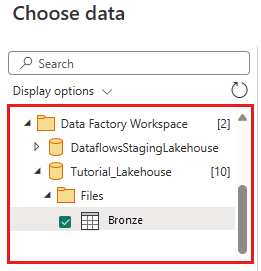
[ データの選択 ] ダイアログが表示されます。 ナビゲーション ウィンドウを使用して、前のモジュールで宛先用に作成した Lakehouse を見つけます。 [ マイ ワークスペース ] フォルダーの下にある場合があります。 Bronze データ テーブルを選択します。 次に、[ 作成] を選択します。
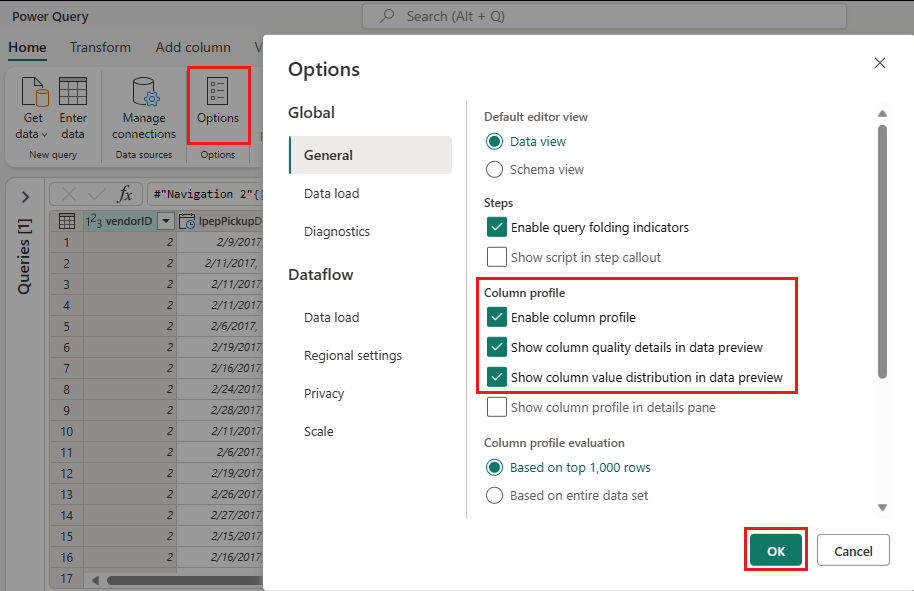
(省略可能) キャンバスにデータが入力されたら、 列プロファイル 情報を設定できます。これはデータ プロファイルに役立ちます。 適切な変換を適用し、それに基づいて適切なデータ値をターゲットにすることができます。
これを行うには、リボン ウィンドウから [オプション] を選択し、[ 列プロファイル] で最初の 3 つのオプションを選択し、[ OK] を選択します。
![データフロー Gen2 ボタンが強調表示された [Fabric作成] ページを示すスクリーンショット。](media/tutorial-end-to-end-dataflow/create-new-dataflow-inline.png#lightbox)
![現在サインインしているユーザーが選択され、[次へ] ボタンが選択されている新しい Lakehouse のデータ ソース設定の構成を示すスクリーンショット。](media/tutorial-end-to-end-dataflow/lakehouse-settings.png#lightbox)

Lakehouse からインポートされたデータを変換する
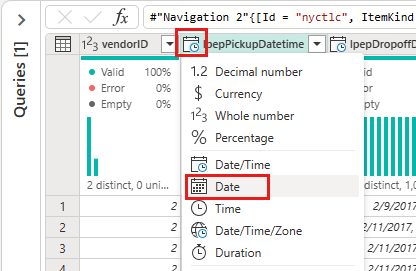
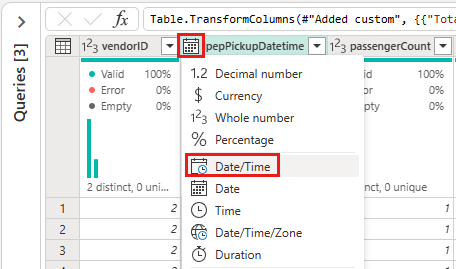
2 番目の列 IpepPickupDatetime の列ヘッダーにあるデータ型アイコンを選択してドロップダウン リスト メニューを表示し、メニューからデータ型を選択して、列を 日付/時刻 から 日付 型に変換します。
(省略可能)リボンの [ホーム] タブで、[列の管理] グループから [列の選択] オプションを選択します。
![データフロー エディターの [ホーム] タブにある [列の選択] ボタンを示すスクリーンショット。](media/tutorial-end-to-end-dataflow/choose-columns-button.png)
(省略可能) [ 列の選択 ] ダイアログで、ここに表示されている一部の列の選択を解除し、[ OK] を選択します。
- ベンダーID
- lpepPickupDatetime
- 乗客数
- 旅行距離
- picukupLongitude
- dropoffLatitude
- storeAndFwdFlag
- 合計金額
![識別された列の選択が解除された [列の選択] ダイアログを示すスクリーンショット。](media/tutorial-end-to-end-dataflow/choose-columns-dialog.png)
storeAndFwdFlag 列のフィルターと並べ替え用ドロップダウンリストメニューを選択します。 (警告 リストが不完全である可能性がある場合は、[ 詳細を読み込む ] を選択してすべてのデータを表示します)。
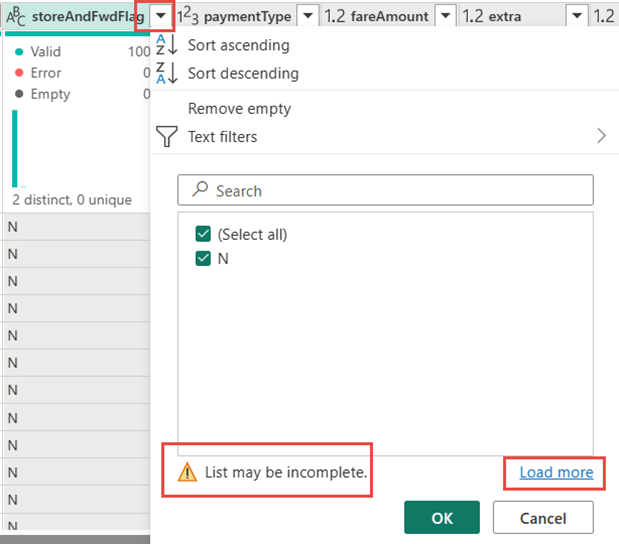
[Y] を選択すると、割引が適用された行のみが表示され、[ OK] を選択します。
![[Y] のみが選択されている値フィルターを示すスクリーンショット。](media/tutorial-end-to-end-dataflow/filter-values.png)
データがフィルター処理されるまで待ちます。
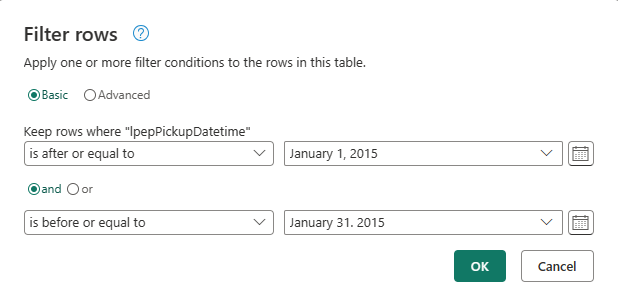
[IpepPickupDatetime] 列の並べ替えとフィルターのドロップダウン リスト メニューを選択し、[日付フィルター] を選択し、[日付] と [日付/時刻] の種類に対して指定された [間] フィルターを選択します。
![列の並べ替えと書式ドロップダウンの [日付フィルター] オプションの選択を示すスクリーンショット。](media/tutorial-end-to-end-dataflow/date-filters-inline.png)
[ 行のフィルター] ダイアログで、2015 年 1 月 1 日から 2015 年 1 月 31 日までの日付を選択し、[ OK] を選択します。
データがフィルター処理されるまで待ちます。
![列の並べ替えと書式ドロップダウンの [日付フィルター] オプションの選択を示すスクリーンショット。](media/tutorial-end-to-end-dataflow/date-filters.png#lightbox)
割引データを含む CSV ファイルに接続する
乗車データを既に用意してあるうえで、各日およびVendorIDに対応した割引を含むデータをロードし、乗車データと組み合わせる前に、そのデータを準備しておきます。
データフロー エディター メニューの [ ホーム ] タブで、[データの 取得 ] オプションを選択し、[ テキスト/CSV] を選択します。
![[ホーム] タブの [データの取得] メニューの選択を示すスクリーンショット。テキスト/CSV が強調表示されています。](media/tutorial-end-to-end-dataflow/get-text-csv-data.png)
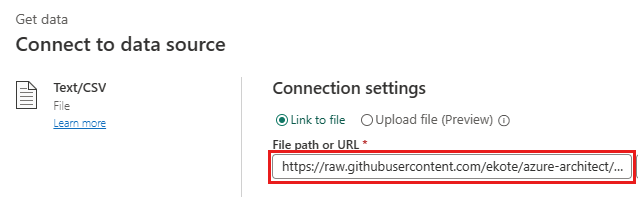
[ データ ソースへの接続 ] ダイアログで、次の詳細を指定します。
-
ファイル パスまたは URL -
https://raw.githubusercontent.com/ekote/azure-architect/master/Generated-NYC-Taxi-Green-Discounts.csv - 認証の種類 - 匿名
次に、[次へ] を選択します。
-
ファイル パスまたは URL -
[ ファイル データのプレビュー ] ダイアログで、[ 作成] を選択します。
![[作成] ボタンが強調表示されている [ファイル データのプレビュー] ダイアログを示すスクリーンショット。](media/tutorial-end-to-end-dataflow/preview-file-data-inline.png)

![[作成] ボタンが強調表示されている [ファイル データのプレビュー] ダイアログを示すスクリーンショット。](media/tutorial-end-to-end-dataflow/preview-file-data.png#lightbox)
割引データを変換する
データを確認すると、ヘッダーが最初の行に表示されます。 プレビュー グリッド領域の左上にあるテーブルのコンテキスト メニューを選択し、[ 先頭行をヘッダーとして使用] を選択して、ヘッダーに昇格します。
![テーブルのコンテキスト メニューの [先頭行をヘッダーとして使用] オプションの選択を示すスクリーンショット。](media/tutorial-end-to-end-dataflow/use-first-row-as-headers.png)
注
ヘッダーを昇格すると、列のデータ型に関する新しいステップがデータフロー エディター上部の<0>[適用ステップ]ペインに追加されます。
VendorID 列を右クリックし、表示されたコンテキスト メニューから [他の列のピボット解除] オプションを選択します。 これにより、列を属性値のペアに変換できます。列は行になります。
![[他の列のピボット解除] が強調表示されている VendorID 列のコンテキスト メニューを示すスクリーンショット。](media/tutorial-end-to-end-dataflow/unpivot-other-columns.png)
テーブルのピボットを解除し、[ 属性 ] 列と [値] 列の名前をダブルクリックし、[ 属性 ] を [日付] に、[ 値] を [割引] に変更します。
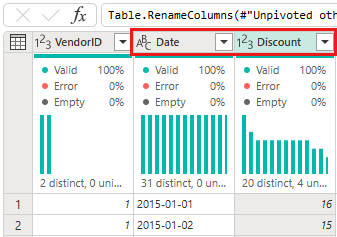
[日付] 列のデータ型を変更するには、列名の左側にあるデータ型メニューを選択し、[ 日付] を選択します。
![[日付] 列の [日付] データ型の選択を示すスクリーンショット。](media/tutorial-end-to-end-dataflow/set-date-data-type.png)
[ 割引 ] 列を選択し、メニューの [ 変換 ] タブを選択します。 [ 数値列 ] セクションで、サブメニューから 標準 の数値変換を選択し、[ 除算] を選択します。
![[割引] 列のデータを変換するための [除算] オプションの選択を示すスクリーンショット。](media/tutorial-end-to-end-dataflow/divide-column-values-inline.png)
[ 除算 ] ダイアログで、値 100 を入力します。
![値 100 が入力され、[OK] ボタンが強調表示されている [除算] ダイアログを示すスクリーンショット。](media/tutorial-end-to-end-dataflow/divide-dialog.png)
![[割引] 列のデータを変換するための [除算] オプションの選択を示すスクリーンショット。](media/tutorial-end-to-end-dataflow/divide-column-values.png#lightbox)
乗車と割引データを結合する
次の手順では、両方のテーブルを、乗車に適用する割引と調整された合計を含む 1 つのテーブルに結合します。
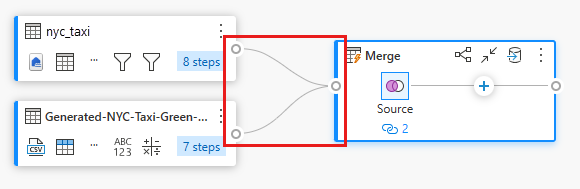
まず、ウィンドウの右下にある [ダイアグラム ビュー ] ボタンを切り替えて、両方のクエリを表示できるようにします。
![このチュートリアルで作成した両方のクエリが表示された [ダイアグラム ビュー] トグル ボタンを示すスクリーンショット。](media/tutorial-end-to-end-dataflow/toggle-diagram-view-inline.png)
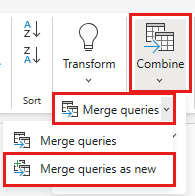
元のデータ クエリ (この例では Bronze と呼ばれます) を選択し、[ ホーム ] タブの [ 結合 ] メニューで [ クエリのマージ] を選択し、[ クエリを新しいクエリとしてマージ] を選択します。
マージ ダイアログで、左外部マージを選択し、マージ用の右テーブルドロップダウンリストからGenerated-NYC-Taxi-Green-Discountsを選択し、ダイアログの右上にある「電球」アイコンを選択して、2つのテーブル間の列のマッピング候補を表示します。
![推奨される列マッピングが表示された [マージ] ダイアログの構成を示すスクリーンショット。](media/tutorial-end-to-end-dataflow/merge-dialog-inline.png)
推奨されるマッピングを選択して、両方のテーブルの VendorID 列と日付列をマップします。 両方のマッピングが追加されると、一致する列ヘッダーが各テーブルで強調表示されます。
複数のデータ ソースからのデータを組み合わせて結果を表示することを許可するように求めるメッセージが表示されます。 [マージ] ダイアログで [OK] を選択します。
![[OK] ボタンが強調表示されている複数のデータ ソースからのデータの結合を承認する要求を示すスクリーンショット。](media/tutorial-end-to-end-dataflow/allow-combining-data.png)
テーブル領域には、最初に "データのプライバシーに関する情報が必要です" という警告が表示されます。[ 続行] を選択して警告に対処します。
![[続行] ボタンが強調表示されている複数のデータ ソースからのデータを結合することに関する警告を示すスクリーンショット。](media/tutorial-end-to-end-dataflow/combine-data-from-multiple-data-sources-warning.png)
このチュートリアルでは、機密情報のないサンプル データであるため、 このドキュメントの [プライバシー レベルのチェックを無視する] を選択します。 独自のデータ ソースの場合は、機密データを保護するために適切なプライバシー レベルを設定します。
![[プライバシー レベルを無視する] オプションが選択されているプライバシー レベルダイアログを示すスクリーンショット。](media/tutorial-end-to-end-dataflow/ignore-privacy-levels.png)
保存 を選択します。
新しいマージ クエリと前に作成した 2 つのクエリの関係を示すダイアグラム ビューで新しいクエリがどのように作成されたかに注目してください。 エディターのテーブル ペインを見て、[クエリ列のマージ] リストの右側までスクロールすると、テーブル値を含む新しい列が表示されます。 これは「Generated NYC Taxi-Green-Discounts」という列で、その種類は[Table]です。 列ヘッダーには、2 つの矢印が反対方向に向かうアイコンがあり、テーブルから列を選択できます。 [割引] を除くすべての列の選択を解除し、[OK] を選択します。
割引の値が行レベルになったので、割引後の合計金額を計算する新しい列を作成できます。 これを行うには、エディターの上部にある [列の追加] タブを選択し、[全般] グループから [カスタム列] を選択します。
![[列の追加] タブの [全般] セクションで強調表示されている [カスタム列の追加] ボタンを示すスクリーンショット。](media/tutorial-end-to-end-dataflow/add-custom-column.png)
Custom 列 ダイアログで、Power Query 数式言語 (M) を使用して、新しい列の計算方法を定義できます。 [新しい列名] に TotalAfterDiscount を入力し、[データ型] に [通貨] を選択し、カスタム列の数式として次の M 式を指定します。
[totalAmount] > 0 の場合は [totalAmount] * ( 1 - [Discount] ) となり、そうでない場合は [totalAmount]
その後、OK を選択します。
![[新しい列名]、[データ型]、[カスタム列の数式] が強調表示されている [カスタム列の構成] 画面を示すスクリーンショット。](media/tutorial-end-to-end-dataflow/custom-column-configuration.png)
新しく作成した TotalAfterDiscount 列を選択し、エディター ウィンドウの上部にある [ 変換 ] タブを選択します。 [ 数値] 列 グループで、[ 丸め ] ドロップダウン リストを選択し、[ 丸め...] を選択します。
![エディターウィンドウの [変換] タブにある [ラウンド...] オプションを示すスクリーンショット。](media/tutorial-end-to-end-dataflow/round-column-inline.png)
[ 丸め] ダイアログで、小数点以下の桁数として「2」と入力し、[ OK] を選択します。
![小数点以下の桁数が 2 で、[OK] ボタンが強調表示されている [ラウンド] ダイアログを示すスクリーンショット。](media/tutorial-end-to-end-dataflow/round-dialog.png)
IpepPickupDatetime のデータ型を日付から日付/時刻に変更します。
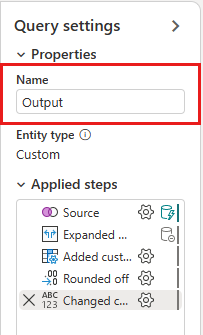
最後に、エディターの右側にある [クエリ設定 ] ウィンドウがまだ展開されていない場合は展開し、クエリの名前を [マージ ] から [出力] に変更します。
![このチュートリアルで作成した両方のクエリが表示された [ダイアグラム ビュー] トグル ボタンを示すスクリーンショット。](media/tutorial-end-to-end-dataflow/toggle-diagram-view.png#lightbox)

![推奨される列マッピングが表示された [マージ] ダイアログの構成を示すスクリーンショット。](media/tutorial-end-to-end-dataflow/merge-dialog.png#lightbox)

![エディターウィンドウの [変換] タブにある [ラウンド...] オプションを示すスクリーンショット。](media/tutorial-end-to-end-dataflow/round-column.png#lightbox)

Lakehouse のテーブルに出力クエリを読み込む
出力クエリが完全に準備され、データを出力する準備ができたので、クエリの出力先を定義できます。
前に作成した 出力 マージ クエリを選択します。 次に、エディターで [ホーム] タブを選択し、[クエリ] グループから [データ変換先を追加] を選択して、Lakehouse 変換先を選択します。
![Lakehouse が強調表示されている [データ変換先の追加] ボタンを示すスクリーンショット。](media/tutorial-end-to-end-dataflow/add-data-destination.png)
[ データ変換先に接続 ] ダイアログで、既に接続が選択されているはずです。 [次へ] を選択して続行します。
[ ターゲットの選択 ] ダイアログで、データを読み込む Lakehouse に移動し、新しいテーブル にnyc_taxi_with_discounts名前を付けてから、[ 次へ ] をもう一度選択します。
![[テーブル名] nyc_taxi_with_discountsの [ターゲットの選択] ダイアログを示すスクリーンショット。](media/tutorial-end-to-end-dataflow/choose-destination-target-dialog.png)
[ 変換先の設定の選択 ] ダイアログで、自動設定を使用するか、自動設定の選択を解除して既定の更新方法を 置き換え 、列が正しくマップされていることを再確認し、[ 設定の保存] を選択します。
![[設定の保存] ボタンが強調表示されている [宛先設定の選択] ダイアログを示すスクリーンショット。](media/tutorial-end-to-end-dataflow/choose-destination-settings-dialog.png)
メイン エディター ウィンドウで、データ変換先 の クエリ設定 ペインに表示されている 出力テーブル を確認し、[保存して実行] を選択します。
Von Bedeutung
ワークスペースに最初の Dataflow Gen2 が作成されると、レイクハウス項目とウェアハウス項目が、関連する SQL 分析エンドポイントおよびセマンティック モデルと共にプロビジョニングされます。 これらの項目はワークスペース内のすべてのデータフローによって共有され、Dataflow Gen2 が動作するために必要であるため、削除しないでください。また、ユーザーが直接使用することを意図したものではありません。 これらの項目は、Dataflow Gen2 の実装の詳細です。 項目はワークスペースには表示されませんが、ノートブック、SQL エンドポイント、レイクハウス、ウェアハウスなどの他のエクスペリエンスでアクセスできる場合があります。 名前のプレフィックスで項目を認識できます。 これらの項目のプレフィックスは "DataflowsStaging" です。
(省略可能) ワークスペース ページでデータフローの名前を変更するには、行を選択した後に表示されるデータフロー名の右側にある省略記号を選択し、[ 設定] を選択します。 この例では、名前を nyc_taxi_with_discounts に変更します。
![名前を変更できるデータフローのメニューで選択されている [プロパティ] オプションを示すスクリーンショット。](media/tutorial-end-to-end-dataflow/rename-dataflow.png)
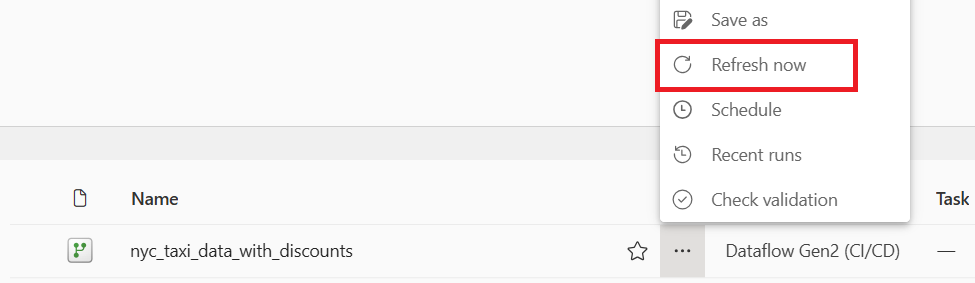
その他のオプション の省略記号の下にあるデータフローの更新アイコンを選択すると、処理が完了したら、データの保存先の設定で構成されたとおりに新しい Lakehouse テーブルが作成されていることが確認できます。
Lakehouseを確認して、そこに読み込まれた新しいテーブルを見てください。
