適用対象: .NET Framework  .NET .NET Standard

Windows イベント トレーシング (ETW) は、効率的なカーネル レベルのトレース機能で、デバッグとテストの目的でドライバー定義イベントをログに記録することができます。 SqlClient では、さまざまな情報レベルでの ETW イベントのキャプチャがサポートされています。 イベント トレースのキャプチャを開始するには、クライアント アプリケーションで SqlClient の EventSource 実装からのイベントをリッスンする必要があります。
Microsoft.Data.SqlClient.EventSource
現在の実装では、次のイベント キーワードがサポートされています。
| キーワード名 | 値 | [説明] |
|---|---|---|
| ExecutionTrace | 1 | コマンドの実行前と実行後の Start/Stop イベントのキャプチャをオンにします。 |
| トレース | 2 | 基本的なアプリケーション フロー トレース イベントのキャプチャをオンにします。 |
| Scope | 4 | Enter イベントと Exit イベントのキャプチャを有効にします |
| NotificationTrace | 8 |
SqlNotification トレース イベントのキャプチャをオンにします |
| 通知範囲 | 16 |
SqlNotification スコープの開始イベントと終了イベントのキャプチャを有効にします |
| PoolerTrace | 32 | 接続プール フロー トレース イベントのキャプチャをオンにします。 |
| PoolerScope | 64 | 接続プール スコープ トレース イベントのキャプチャをオンにします。 |
| AdvancedTrace | 128 | 高度なフロー トレース イベントのキャプチャをオンにします。 |
| AdvancedTraceBin | 256 | 追加情報を含む高度なフロー トレース イベントのキャプチャをオンにします。 |
| CorrelationTrace | 512 | 相関関係フロー トレース イベントのキャプチャをオンにします。 |
| StateDump | 1024 |
SqlConnection の完全な状態ダンプの取得を有効にします |
| SNITrace | 2048 | マネージド ネットワーク実装からのフロー トレース イベントのキャプチャをオンにします (.NET Core でのみ適用可能) |
| SNIScope | 4096 | マネージド ネットワーク実装からのスコープ イベントのキャプチャをオンにします (.NET Core でのみ適用可能) |
例
次の例では、AdventureWorks サンプル データベースでデータ操作のイベント トレースを有効にし、コンソール ウィンドウにそのイベントを表示します。
using System;
using System.Diagnostics.Tracing;
using Microsoft.Data.SqlClient;

// This listener class will listen for events from the SqlClientEventSource class.
// SqlClientEventSource is an implementation of the EventSource class which gives
// it the ability to create events.
public class SqlClientListener : EventListener
{
    protected override void OnEventSourceCreated(EventSource eventSource)
    {
        // Only enable events from SqlClientEventSource.
        if (eventSource.Name.Equals("Microsoft.Data.SqlClient.EventSource"))
        {
            // Use EventKeyWord 2 to capture basic application flow events.
            // See the above table for all available keywords.
            EnableEvents(eventSource, EventLevel.Informational, (EventKeywords)2);
        }
    }

    // This callback runs whenever an event is written by SqlClientEventSource.
    // Event data is accessed through the EventWrittenEventArgs parameter.
    protected override void OnEventWritten(EventWrittenEventArgs eventData)
    {
        // Print event data.
        Console.WriteLine(eventData.Payload[0]);
    }
}

class Program
{
    public static void Main()
    {
        // Create a new event listener.
        using (SqlClientListener listener = new SqlClientListener())
        {
            string connectionString = "Data Source=localhost; " +
                "Initial Catalog=AdventureWorks; Integrated Security=true";

            // Open a connection to the AdventureWorks database.
            using (SqlConnection connection = new SqlConnection(connectionString))
            {
                connection.Open();

                string sql = "SELECT * FROM Sales.Currency";
                SqlCommand command = new SqlCommand(sql, connection);

                // Perform a data operation on the server.
                SqlDataReader reader = command.ExecuteReader();
                while (reader.Read())
                {
                    // Read the data.
                }
                reader.Close();
            }
        }
    }
}
ネイティブ SNI でのイベント トレースのサポート
Microsoft.Data.SqlClient では、v2.1 以降、Microsoft.Data.SqlClient.SNI と Microsoft.Data.SqlClient.SNI.runtime でイベント トレースがサポートされます。 イベントは、Xperf および PerfView ツールを使用し、ネイティブ DLL から収集できます。
Microsoft.Data.SqlClient v3.0 以降、イベント収集ツールでクライアント アプリケーションを変更しなくてもイベント トレースを有効にできます。
Microsoft.Data.SqlClient v2.1 では、イベント ソース リスナーで EventCommand を構成し、イベント トレースを有効にする必要があります。 ネイティブ SNI に適用できる有効な EventCommand 値を次に示します。
// Enables trace events:
EventSource.SendCommand(eventSource, (EventCommand)8192, null);

// Enables flow events:
EventSource.SendCommand(eventSource, (EventCommand)16384, null);

// Enables both trace and flow events:
EventSource.SendCommand(eventSource, (EventCommand)(8192 | 16384), null);
次の例では、ネイティブ SNI DLL でイベント トレースが有効になります。
// Native SNI tracing example
using System;
using System.Diagnostics.Tracing;
using Microsoft.Data.SqlClient;

public class SqlClientListener : EventListener
{
    protected override void OnEventSourceCreated(EventSource eventSource)
    {
        if (eventSource.Name.Equals("Microsoft.Data.SqlClient.EventSource"))
        {
            // Enables both trace and flow events
            EventSource.SendCommand(eventSource, (EventCommand)(8192 | 16384), null);
        }
    }
}

class Program
{
    static string connectionString = @"Data Source = localhost; Initial Catalog = AdventureWorks;Integrated Security=true;";

    static void Main(string[] args)
    {
        // Event source listener configuration is not required in v3.0 onwards.
        using (SqlClientListener listener = new SqlClientListener())
        using (SqlConnection connection = new SqlConnection(connectionString))
        {
            connection.Open();
        }
    }
}
Xperf を使用してトレースを収集する
次のコマンドを使ってトレースを開始します。
xperf -start trace -f myTrace.etl -on *Microsoft.Data.SqlClient.EventSourceネイティブ SNI のトレースの例を実行して、SQL Server に接続します。
次のコマンド ラインを使用してトレースを停止します。
xperf -stop tracePerfView を使用して、ステップ 1 で指定した myTrace.etl ファイルを開きます。 SNI トレース ログは、
Microsoft.Data.SqlClient.EventSource/SNIScopeおよびMicrosoft.Data.SqlClient.EventSource/SNITraceのイベント名で見つけることができます。
PerfView を使用してトレースを収集する
PerfView を開始し、メニュー バーから
Collect > Collectを実行します。トレース ファイル名、出力パス、プロバイダー名を構成します。
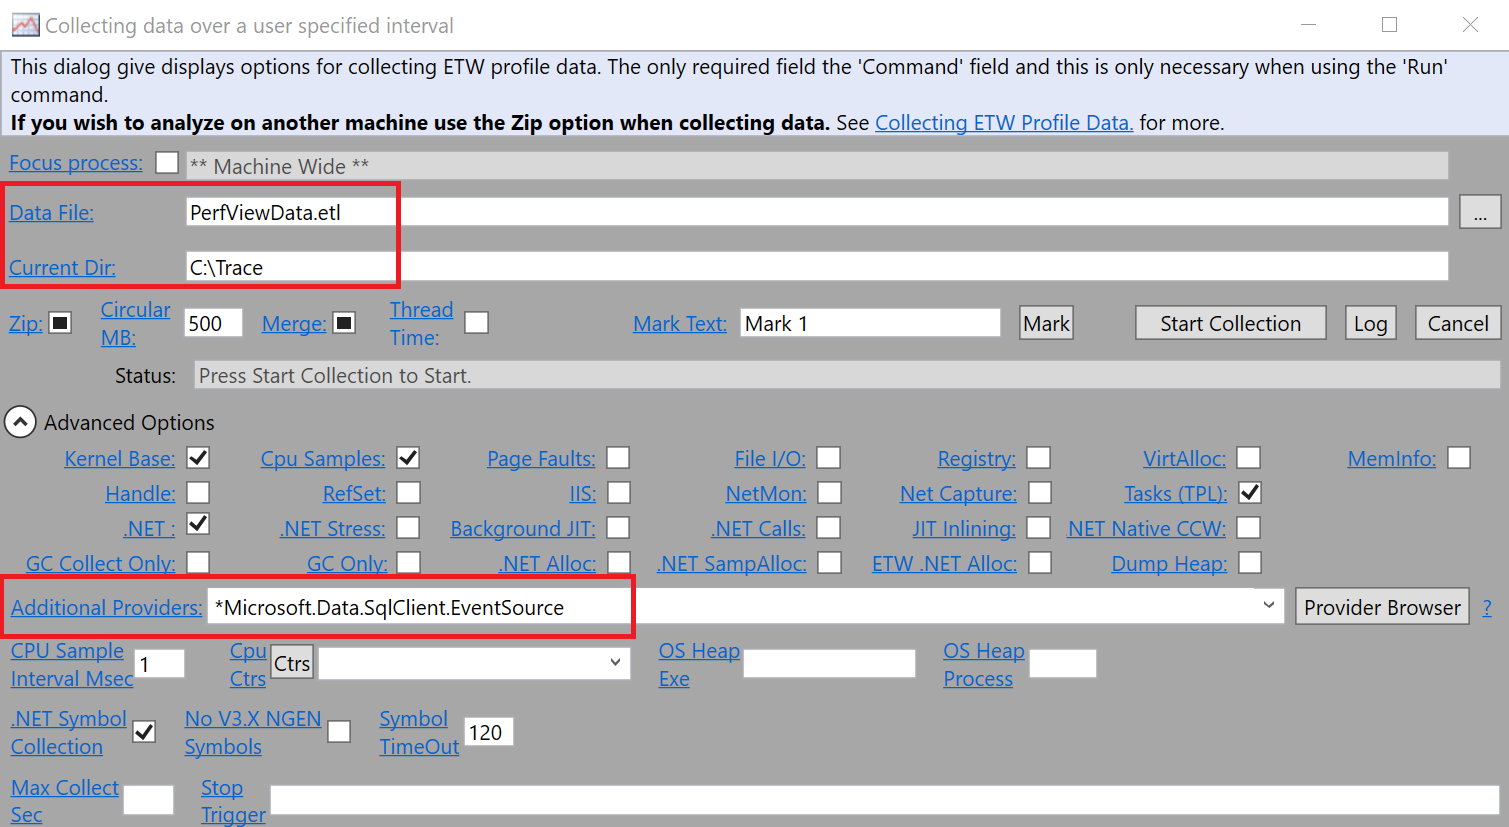
収集を開始します。
ネイティブ SNI のトレースの例を実行して、SQL Server に接続します。
PerfView から収集を停止します。 手順 2 の構成に従って PerfViewData.etl ファイルを生成するには、しばらく時間がかかります。
PerfView で
etlファイルを開きます。 SNI トレース ログは、Microsoft.Data.SqlClient.EventSource/SNIScopeおよびMicrosoft.Data.SqlClient.EventSource/SNITraceのイベント名で見つけることができます。
dotnet-trace を使用してトレースを収集する
Linux、macOS、または Windows では、dotnet-trace を使用してトレースをキャプチャできます。 dotnet-trace ツールは、.NET アプリケーションのトレースを収集するために使用されます。 dotnet-trace の詳細については、「dotnet-trace パフォーマンス分析ユーティリティ」を参照してください。dotnet-trace によって作成されたトレースは、PerfView で表示できます。
まだインストールされていない場合は、クライアント マシンに .NET SDK をインストールします。
dotnet-trace を実行します。
--providersパラメーターでは、Microsoft.Data.SqlClient からのトレースにプロバイダー名とキーワードを指定する必要があります。 キーワード オプションは、16 進数に変換されたイベント キーワード テーブル内のキーワード値の合計です。 アプリケーションの開始時点からMyApplicationの Verbose レベルですべてのイベントを収集するには、キーワードの合計値は 8191 で、16 進数では1FFFです。 詳細レベルは、このコマンドで5によって指定されます。dotnet-trace collect --providers Microsoft.Data.SqlClient.EventSource:1FFF:5 -- dotnet MyApplication.dll出力は次のようになります。
Provider Name                           Keywords            Level               Enabled By
Microsoft.Data.SqlClient.EventSource    0x0000000000001FFF  Verbose(5)          --providers

Launching: dotnet MyApplication.dll
Process        : /usr/lib/dotnet/dotnet
Output File    : /home/appuser/dotnet_20240927_102506.nettrace

[00:00:00:00]   Recording trace 0.00     (B)
Press <Enter> or <Ctrl+C> to exit...

Trace completed.
Process exited with code '1'.
実行中のアプリケーションの情報レベルで、すべてのイベントを収集するには、まずアプリケーションのプロセス ID を見つけます。 次に、プロセスで dotnet-trace を実行します。 情報レベルは、
4によって指定されます。dotnet-trace ps 8734 MyApplication /home/appuser/MyApplication/MyApplication dotnet-trace collect --process-id 8734 --providers Microsoft.Data.SqlClient.EventSource:1FFF:4アプリケーションを単独で実行し、問題を再現できるまで必要な時間だけ実行したままにします。 CPU の問題が高い場合は、通常、5 秒から 10 秒で十分です。
Provider Name                           Keywords            Level               Enabled By
Microsoft.Data.SqlClient.EventSource    0x0000000000001FFF  LogAlways(0)        --providers

Process        : /usr/lib/dotnet/dotnet
Output File    : /home/appuser/dotnet_20240927_104154.nettrace

[00:00:00:10]   Recording trace 4.096    (KB)
Press <Enter> or <Ctrl+C> to exit...
Stopping the trace. This may take several minutes depending on the application being traced.

Trace completed.
トレース ファイル名は
.nettraceで終わります。 Windows でトレースしない場合は、ファイルを Windows システムにコピーします。 トレース ファイルを PerfView で表示します。