개발자는 Power BI 시각적 개체를 직접 만들 수 있습니다. 이러한 시각적 개체는 개발자 본인, 본인이 속한 조직 또는 제3자가 사용할 수 있습니다.
이 자습서에서는 React를 사용하여 Power BI 시각적 개체를 개발합니다. 시각적 개체는 원 내부에 서식이 지정된 측정값을 표시합니다. 시각적 개체에는 적응형 크기가 있으며 사용자가 설정을 사용자 지정할 수 있습니다.
이 자습서에서는 다음을 하는 방법을 알아볼 수 있습니다.
- 시각적 개체에 대한 개발 프로젝트 만들기
- React를 사용하여 시각적 개체를 개발합니다.
- 데이터를 처리하도록 시각적 개체 구성
- 크기 변경에 맞게 시각적 개체를 구성합니다.
- 시각적 개체에 대한 적응형 색과 테두리 설정을 구성합니다.
참고 항목
이 시각적 개체의 전체 소스 코드는 React 원 카드 Power BI 시각적 개체를 참조하세요.
필수 조건
Power BI 시각적 개체 개발을 시작하기 전에, 이 섹션에 나열된 모든 것이 준비되어 있는지 확인합니다.
Power BI Pro 또는 PPU(사용자 단위 Premium) 계정. 활성 Microsoft Azure 구독이 없는 경우 평가판에 등록하세요.
VS Code(Visual Studio Code) VS Code는 JavaScript 및 TypeScript 애플리케이션 개발에 적합한 IDE(통합 개발 환경)입니다.
Windows PowerShell 버전 4 이상(Windows인 경우). 또는 터미널(Mac용).
Power BI 시각적 개체를 개발할 준비가 완료된 환경. Power BI 시각적 개체 개발을 위한 환경을 설정하세요.
이 자습서에서는 미국 영업 분석 보고서를 사용합니다. 이 보고서를 다운로드하여 Power BI 서비스에 업로드하거나 자신만의 보고서를 사용할 수 있습니다. Power BI 서비스 및 파일 업로드에 대한 자세한 내용은 Power BI 서비스에서 만들기 시작 자습서를 참조하세요.
개발 프로젝트 만들기
이 섹션에서는 React 원 카드 시각적 개체에 대한 프로젝트를 만듭니다.
PowerShell을 열고 프로젝트를 만들려는 폴더로 이동합니다.
다음 명령을 입력합니다.
pbiviz new ReactCircleCard프로젝트의 폴더로 이동합니다.
cd ReactCircleCardReact 원 카드 시각적 개체를 시작합니다. 시각적 개체는 컴퓨터에서 호스트되는 동안 실행됩니다.
pbiviz startImportant
시각적 개체의 실행을 중지하려면 PowerShell에서 Ctrl+C를 입력하고, 일괄 처리 작업을 종료하라는 메시지가 표시되면 Y를 입력하고 Enter 키를 누릅니다.
Power BI 서비스에서 React 원 카드 보기
Power BI 서비스에서 시각적 개체를 테스트하기 위해 미국 영업 분석 보고서를 사용하겠습니다. 이 보고서를 다운로드하여 Power BI 서비스에 업로드할 수 있습니다.
자체 보고서를 사용하여 시각적 개체를 테스트할 수도 있습니다.
참고 항목
계속하기 전에 시각적 개체 개발자 모드를 사용하도록 설정했는지 확인합니다.
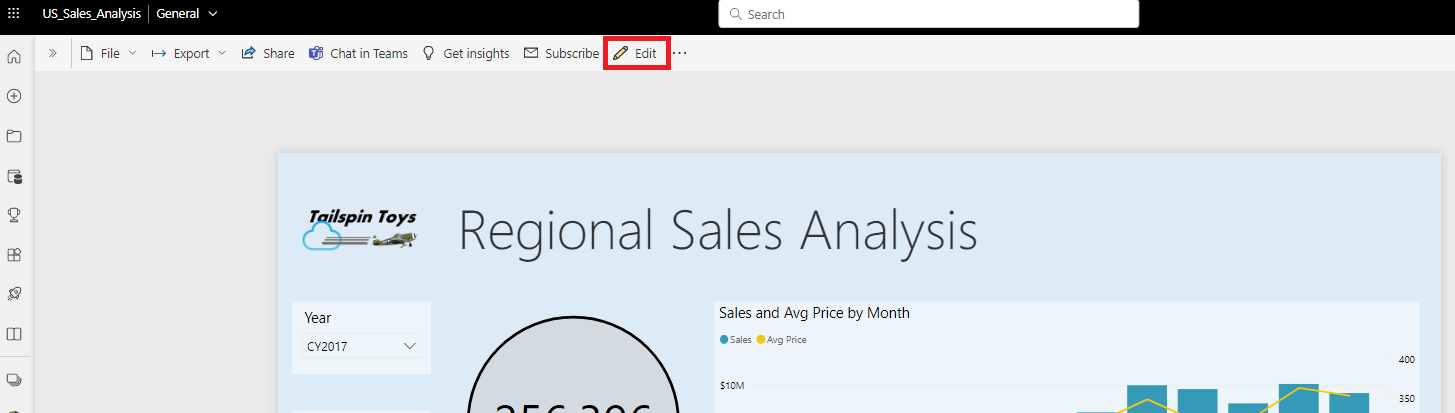
PowerBI.com에 로그인하여 미국 영업 분석 보고서를 엽니다.
편집을 선택합니다.
Power BI 서비스 인터페이스 아래쪽에서 새 페이지 단추를 클릭하여 테스트할 새 페이지를 만듭니다.

시각화 창에서 개발자 시각적 개체를 선택합니다.
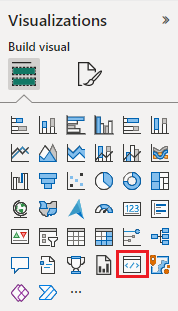
이 시각적 개체는 컴퓨터에서 실행하는 사용자 지정 시각적 개체를 나타냅니다. 사용자 지정 시각적 개체 디버깅 설정이 활성화된 경우에만 사용할 수 있습니다.
시각적 개체가 보고서 캔버스에 추가되었는지 확인합니다.
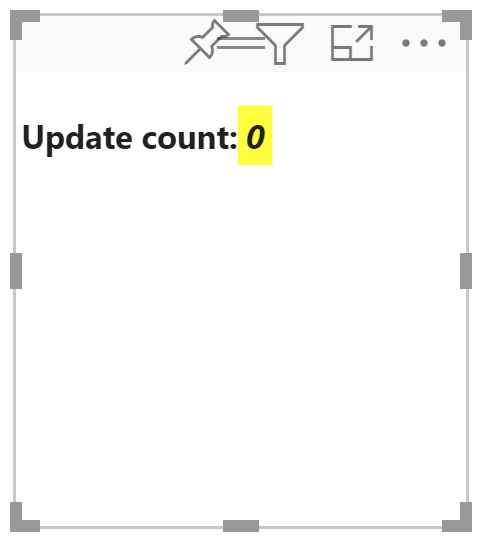
update 메서드가 호출된 횟수를 표시하는 간단한 시각적 개체입니다. 이 단계에서는 시각적 개체가 아직 데이터를 검색하지 않습니다.
참고 항목
시각적 개체가 연결 오류 메시지를 표시하면 브라우저에서 새 탭을 열고
https://localhost:8080/assets로 이동한 다음, 이 주소를 사용하도록 브라우저에 권한을 부여합니다.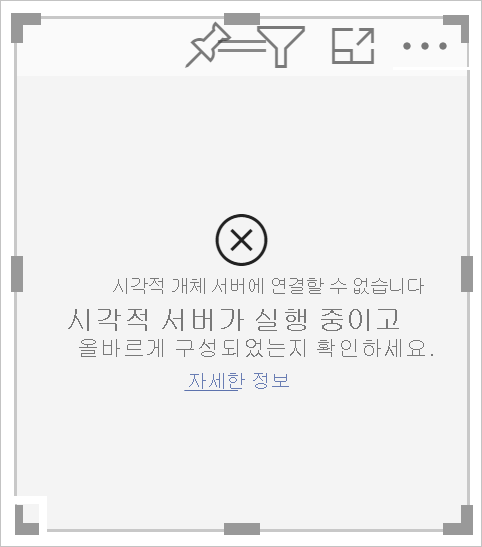
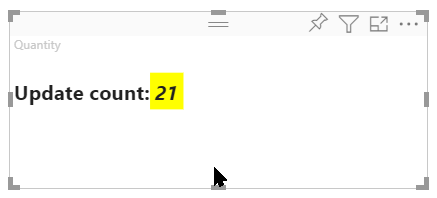
새 시각적 개체가 선택된 상태에서 데이터 창으로 이동하여 영업을 확장하고 수량을 선택합니다.
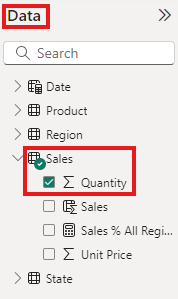
시각적 개체가 어떻게 응답하는지 테스트하려면 시각적 개체의 크기를 조정합니다. 시각적 개체의 크기를 조정할 때마다 업데이트 횟수 값이 증가합니다.
프로젝트에서 React 설정
이 섹션에서는 Power BI 시각적 개체를 위해 React를 설정하는 방법을 알아봅니다.
PowerShell을 열고 Ctrl+C를 입력하여 시각적 개체 실행을 중지합니다. 일괄 작업을 종료하라는 메시지가 표시되면 Y를 입력한 다음 Enter 키를 누릅니다.
React 설치
필요한 React 종속성을 설치하려면 ReactCircleCard 폴더에서 PowerShell을 열고 다음 명령을 실행합니다.
npm i react react-dom
React 형식 정의 설치
React의 형식 정의를 설치하려면 reactCircleCard 폴더에서 PowerShell을 열고 다음 명령을 실행합니다.
npm i @types/react @types/react-dom
React 구성 요소 클래스 만들기
다음 단계를 수행하여 React 구성 요소 클래스를 만듭니다.
VS Code를 열고 reactCircleCard 폴더로 이동합니다.
파일>새 파일을 선택하여 새 파일을 만듭니다.
다음 코드를 새 파일에 복사합니다.
import * as React from "react";

export class ReactCircleCard extends React.Component<{}>{
    render(){
        return (
            <div className="circleCard">
                Hello, React!
            </div>
        )
    }
}

export default ReactCircleCard;
다른 이름으로 저장을 선택하고 src 폴더로 이동합니다.
파일을 다음과 같이 저장합니다.
- 파일 이름 필드에 구성 요소를 입력합니다.
- 형식으로 저장 드롭다운 메뉴에서 TypeScript React를 선택합니다.
시각적 개체 파일에 React 추가
visual.ts 파일에 있는 코드를 React를 이용해 사용 설정하는 코드로 바꿉니다.
src 폴더에서 visual.ts를 열고 파일에 있는 코드를 다음 코드로 바꿉니다.
"use strict";
import powerbi from "powerbi-visuals-api";

import DataView = powerbi.DataView;
import VisualConstructorOptions = powerbi.extensibility.visual.VisualConstructorOptions;
import VisualUpdateOptions = powerbi.extensibility.visual.VisualUpdateOptions;
import IVisual = powerbi.extensibility.visual.IVisual;

// Import React dependencies and the added component
import * as React from "react";
import * as ReactDOM from "react-dom";
import ReactCircleCard from "./component";

import "./../style/visual.less";

export class Visual implements IVisual {

    constructor(options: VisualConstructorOptions) {

    }

    public update(options: VisualUpdateOptions) {

    }
}
참고 항목
기본 Power BI TypeScript 설정에서 React tsx 파일을 인식하지 못하기 때문에 VS Code에서
component를 오류로 강조 표시합니다.구성 요소를 렌더링하려면 대상 HTML 요소를 visual.ts에 추가합니다. 이 요소는
HTMLElement의VisualConstructorOptions로, 생성자에 전달됩니다.src 폴더에서 visual.ts를 엽니다.
다음 코드를
Visual클래스에 추가합니다.
private target: HTMLElement; private reactRoot: React.ComponentElement<any, any>;- 다음 줄을
VisualConstructorOptions생성자에 추가합니다.
this.reactRoot = React.createElement(ReactCircleCard, {});
this.target = options.element;

ReactDOM.render(this.reactRoot, this.target);
이제 Program.cs 파일이 다음과 같이 표시될 것입니다.
"use strict"; import powerbi from "powerbi-visuals-api"; import DataView = powerbi.DataView; import VisualConstructorOptions = powerbi.extensibility.visual.VisualConstructorOptions; import VisualUpdateOptions = powerbi.extensibility.visual.VisualUpdateOptions; import IVisual = powerbi.extensibility.visual.IVisual; import * as React from "react"; import * as ReactDOM from "react-dom"; import ReactCircleCard from "./component"; import "./../style/visual.less"; export class Visual implements IVisual { private target: HTMLElement; private reactRoot: React.ComponentElement<any, any>; constructor(options: VisualConstructorOptions) { this.reactRoot = React.createElement(ReactCircleCard, {}); this.target = options.element; ReactDOM.render(this.reactRoot, this.target); } public update(options: VisualUpdateOptions) { } }visual.ts를 저장합니다.
tsconfig 파일 편집
React와 함께 작동하도록 tsconfig.json을 편집합니다.
reactCircleCard 폴더에서 tsconfig.json을 열고 두 줄을
compilerOptions항목 시작 부분에 추가합니다."jsx": "react", "types": ["react", "react-dom"],tsconfig.json 파일이 다음과 같이 표시되고,
component의 오류가 사라집니다.{ "compilerOptions": { "jsx": "react", "types": ["react", "react-dom"], "allowJs": false, "emitDecoratorMetadata": true, "experimentalDecorators": true, "target": "es6", "sourceMap": true, "outDir": "./.tmp/build/", "moduleResolution": "node", "declaration": true, "lib": [ "es2015", "dom" ] }, "files": [ "./src/visual.ts" ] }tsconfig.json을 저장합니다.
시각적 개체 테스트
CircleCardVisual 폴더에서 PowerShell을 열고 프로젝트를 실행합니다.
pbiviz start
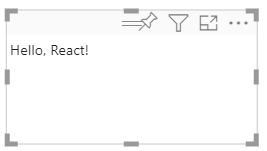
새 개발자 시각적 개체를 Power BI 서비스의 보고서에 추가하면 다음과 같은 모습이 됩니다.
시각적 개체의 데이터 필드 구성
시각적 개체의 기능 파일을 구성하여 시각적 개체의 측정값 데이터 필드에 데이터 필드 하나만 제출될 수 있게 합니다.
VS Code의 reactCircleCard 폴더에서 capabilities.json을 엽니다.
ReactCircleCard에서 단일 값인Measure Data가 표시됩니다.Category Data에서dataRoles개체를 제거합니다.Category Data개체를 제거하면dataRoles키는 다음과 같이 보입니다."dataRoles": [ { "displayName": "Measure Data", "name": "measure", "kind": "Measure" } ],objects키의 내용을 모두 제거합니다(나중에 입력하게 됩니다).콘텐츠를 제거하면
objects키는 다음과 같이 보입니다."objects": {},dataViewMappings속성을 다음 코드로 바꿉니다.max: 1의measure에서는 시각적 개체의 측정값 데이터 필드에 제출할 수 있는 데이터 필드를 하나만 지정합니다."dataViewMappings": [ { "conditions": [ { "measure": { "max": 1 } } ], "single": { "role": "measure" } } ]capabilities.js에 적용한 변경 내용을 저장합니다.
pbiviz start가 실행 중인지 확인하고 Power BI 서비스에서 React Circle Card 시각적 개체를 새로 고칩니다. 측정값 데이터 필드는max: 1에 지정된 것처럼 데이터 필드를 하나만 허용할 수 있습니다.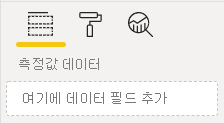
시각적 개체의 스타일 업데이트
이 섹션에서는 시각적 개체의 모양을 원으로 바꿉니다. 시각적 개체의 스타일을 제어하려면 visual.less 파일을 사용해야 합니다.
style 폴더에서 visual.less를 엽니다.
visual.less의 콘텐츠를 다음 코드로 바꿉니다.
.circleCard { position: relative; box-sizing: border-box; border: 1px solid #000; border-radius: 50%; width: 200px; height: 200px; } p { text-align: center; line-height: 30px; font-size: 20px; font-weight: bold; position: relative; top: -30px; margin: 50% 0 0 0; }visual.less를 저장합니다.
Power BI에서 속성을 수신하도록 시각적 개체를 설정
이 섹션에서는 Power BI에서 데이터를 수신하도록 시각적 개체를 구성하고, 업데이트를 component.tsx 파일의 인스턴스로 보냅니다.
React를 사용하여 데이터 렌더링
React를 사용하여 데이터를 렌더링할 수 있습니다. 구성 요소는 자체 상태의 데이터를 표시할 수 있습니다.
VS Code의 reactCircleCard 폴더에서 component.tsx를 엽니다.
component.tsx의 내용을 다음 코드로 바꿉니다.
import * as React from "react"; export interface State { textLabel: string, textValue: string } export const initialState: State = { textLabel: "", textValue: "" } export class ReactCircleCard extends React.Component<{}, State>{ constructor(props: any){ super(props); this.state = initialState; } render(){ const { textLabel, textValue } = this.state; return ( <div className="circleCard"> <p> {textLabel} <br/> <em>{textValue}</em> </p> </div> ) } }component.tsx를 저장합니다.
데이터를 수신하도록 시각적 개체 설정
시각적 개체는 update 메서드의 인수를 데이터로 수신합니다. 이 섹션에서는 데이터를 수신하도록 이 메서드를 업데이트합니다.
다음 코드는 textLabel에서 textValue 및 DataView를 선택하고, 데이터가 존재하면 구성 요소 상태를 업데이트합니다.
VS Code의 src 폴더에서 visual.ts를 엽니다.
import ReactCircleCard from "./component";줄을 다음 코드로 바꿉니다.import { ReactCircleCard, initialState } from "./component";update메서드에 다음 코드를 추가합니다.if(options.dataViews && options.dataViews[0]){ const dataView: DataView = options.dataViews[0]; ReactCircleCard.update({ textLabel: dataView.metadata.columns[0].displayName, textValue: dataView.single.value.toString() }); } else { this.clear(); }clear메서드 아래에 다음 코드를 추가하여update메서드를 만듭니다.private clear() { ReactCircleCard.update(initialState); }visual.ts를 저장합니다.
데이터를 내보내도록 시각적 개체 설정
이 섹션에서는 component 파일의 인스턴스에 보내도록 시각적 개체를 업데이트합니다.
VS Code의 src 폴더에서 component.tsx를 엽니다.
다음 코드를
ReactCircleCard클래스에 추가합니다.private static updateCallback: (data: object) => void = null; public static update(newState: State) { if(typeof ReactCircleCard.updateCallback === 'function'){ ReactCircleCard.updateCallback(newState); } } public state: State = initialState; public componentWillMount() { ReactCircleCard.updateCallback = (newState: State): void => { this.setState(newState); }; } public componentWillUnmount() { ReactCircleCard.updateCallback = null; }component.tsx를 저장합니다.
시각적 개체에 대한 변경 내용 보기
React Circle Card 시각적 개체를 테스트하여 변경 내용을 확인합니다.
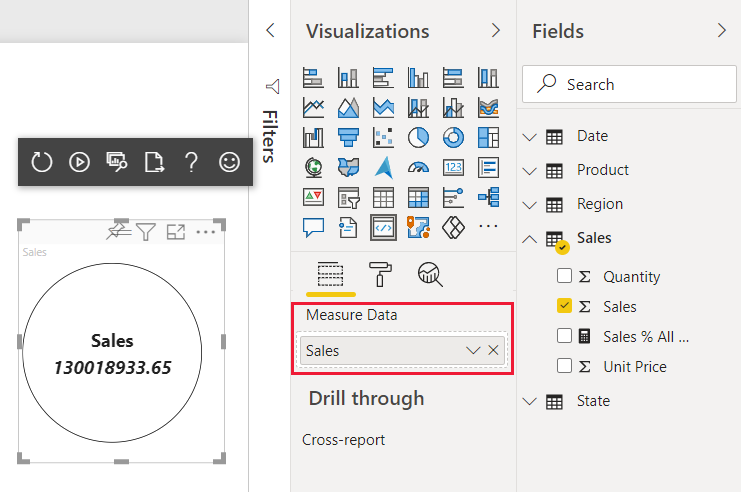
pbiviz start가 실행 중인지 확인하고 Power BI 서비스에서 React Circle Card 시각적 개체를 새로 고칩니다.시각적 개체의 측정값 데이터 필드에 판매를 추가합니다.
시각적 개체의 크기를 조정할 수 있게 하기
현재 시각적 개체는 너비와 높이가 고정되어 있습니다. 시각적 개체의 크기를 조정할 수 있도록 하려면 size 및 component.tsx 파일 모두에서 변수를 정의해야 합니다. 이 섹션에서는 시각적 개체의 크기를 조정할 수 있게 합니다.
이 섹션에서 설명하는 단계를 완수하면 시각적 개체의 원 지름이 너비 또는 높이 크기와 일치하게 되며, Power BI 서비스에서 크기를 조정할 수 있게 됩니다.
visual.ts 파일 구성
options 개체에서 시각적 개체 뷰포트의 현재 크기를 가져옵니다.
VS Code의 src 폴더에서 visual.ts를 엽니다.
이 코드를 삽입하여
IViewport인터페이스를 가져옵니다.import IViewport = powerbi.IViewport;viewport속성을visual클래스에 추가합니다.private viewport: IViewport;update메서드의ReactCircleCard.update앞에 다음 코드를 추가합니다.this.viewport = options.viewport; const { width, height } = this.viewport; const size = Math.min(width, height);update메서드의ReactCircleCard.update에size를 추가합니다.size,visual.ts를 저장합니다.
component.tsx 파일 구성
VS Code의 src 폴더에서 component.tsx를 엽니다.
다음 코드를
export interface State에 추가합니다.size: number다음 코드를
export const initialState: State에 추가합니다.size: 200render메서드에서 코드를 다음과 같이 변경합니다.size를const { textLabel, textValue, size } = this.state;에 추가합니다. 이 선언은 이제 다음과 같이 표시됩니다.const { textLabel, textValue, size } = this.state;return위에 다음 코드를 추가합니다.const style: React.CSSProperties = { width: size, height: size };첫 번째 반환 줄 를 다음으로 교체합니다.
<div className="circleCard" style={style}>
component.tsx를 저장합니다.
visual 파일 구성
VS Code의 style 폴더에서 visual.less를 엽니다.
.circleCard에서width와height를min-width와min-height로 교체합니다.min-width: 200px; min-height: 200px;visual.less를 저장합니다.
Power BI 시각적 개체를 사용자 지정할 수 있도록 설정
이 섹션에서는 시각적 개체를 사용자 지정하는 기능을 추가하여 사용자가 색상과 테두리 두께를 변경할 수 있게 합니다.
기능 파일에 색상과 두께 추가
object의 속성에 색상과 테두리 두께를 추가합니다.
VS Code의 reactCircleCard 폴더에서 capabilities.json을 엽니다.
objects속성에 다음 설정을 추가합니다."circle": { "properties": { "circleColor": { "type": { "fill": { "solid": { "color": true } } } }, "circleThickness": { "type": { "numeric": true } } } }capabilities.json을 저장합니다.
설정 파일에 원 서식 지정 설정 클래스 추가
Circle에 서식 지정 설정을 추가합니다. 서식 모델 설정을 빌드하는 방법에 대한 자세한 내용은 서식 지정 유틸리티를 참조하세요.
VS Code의 src 폴더에서 settings.ts를 엽니다.
settings.ts의 코드를 다음 코드로 바꿉니다.
"use strict"; import { formattingSettings } from "powerbi-visuals-utils-formattingmodel"; import FormattingSettingsCard = formattingSettings.SimpleCard; import FormattingSettingsSlice = formattingSettings.Slice; import FormattingSettingsModel = formattingSettings.Model; /** * Circle Formatting Card */ class CircleCardSettings extends FormattingSettingsCard { circleColor = new formattingSettings.ColorPicker({ name: "circleColor", // circle color name should match circle color property name in capabilities.json displayName: "Color", description: "The fill color of the circle.", show: true, value: { value: "white" } }); circleThickness = new formattingSettings.NumUpDown({ name: "circleThickness", // circle thickness name should match circle color property name in capabilities.json displayName: "Thickness", description: "The circle thickness.", show: true, value: 2 }); name: string = "circle"; // circle card name should match circle object name in capabilities.json displayName: string = "Circle"; show: boolean = true; slices: Array<FormattingSettingsSlice> = [this.circleColor, this.circleThickness]; } /** * visual settings model class * */ export class VisualFormattingSettingsModel extends FormattingSettingsModel { // Create formatting settings model circle formatting card circleCard = new CircleCardSettings(); cards = [this.circleCard]; }settings.ts를 저장합니다.
메서드를 추가하여 시각적 개체 설정 적용
시각적 개체 설정과 getFormattingModel 파일에 필요한 가져오기를 적용하는 데 사용하는 메서드를 추가합니다.
VS Code의 src 폴더에서 visual.ts를 엽니다.
import의 맨 위에 다음 문을 추가합니다.import { FormattingSettingsService } from "powerbi-visuals-utils-formattingmodel"; import { VisualFormattingSettingsModel } from "./settings";시각적 개체에 다음 선언을 추가합니다.
private formattingSettings: VisualFormattingSettingsModel; private formattingSettingsService: FormattingSettingsService;getFormattingModel에 메서드를 추가합니다.public getFormattingModel(): powerbi.visuals.FormattingModel { return this.formattingSettingsService.buildFormattingModel(this.formattingSettings); }Visual클래스에서 다음 코드 줄을constructor에 추가하여formattingSettingsService를 초기화합니다.this.formattingSettingsService = new FormattingSettingsService();Visual클래스에서 다음 코드를update에 추가하여 시각적 서식 설정을 최신 서식 지정 속성 값으로 업데이트합니다.이 코드를 뒤에 있는
const size = Math.min(width, height);문에 추가합니다.this.formattingSettings = this.formattingSettingsService.populateFormattingSettingsModel(VisualFormattingSettingsModel, options.dataViews[0]); const circleSettings = this.formattingSettings.circleCard;이 코드를
ReactCircleCard.update뒤에 있는size에 추가합니다.borderWidth: circleSettings.circleThickness.value, background: circleSettings.circleColor.value.value, }
visual.ts를 저장합니다.
구성 요소 파일 편집
구성 요소 파일을 편집하여 시각적 개체의 색상과 테두리 두께에 대한 변경 내용을 렌더링할 수 있게 합니다.
VS Code의 src 폴더에서 component.tsx를 엽니다.
다음 값을
State에 추가합니다.background?: string, borderWidth?: numberrender메서드에서 다음 코드 줄을 바꿉니다.const { textLabel, textValue, size } = this.state;를 다음으로 바꿉니다.const { textLabel, textValue, size, background, borderWidth } = this.state;const style: React.CSSProperties = { width: size, height: size };를 다음으로 바꿉니다.const style: React.CSSProperties = { width: size, height: size, background, borderWidth };
component.tsx를 저장합니다.
변경 내용 검토
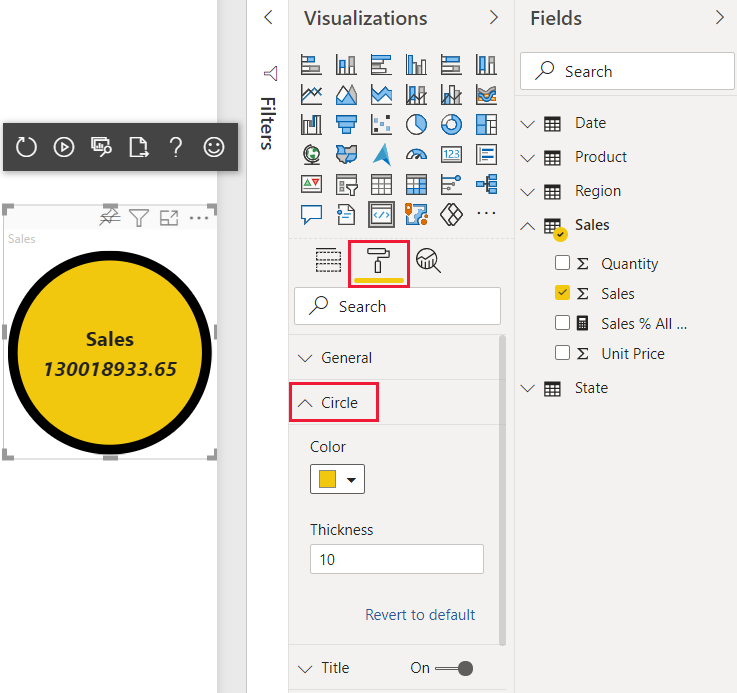
이제 제어할 수 있게 된 시각적 개체의 색상과 테두리 두께를 조작해 보세요.
pbiviz start가 실행 중인지 확인하고 Power BI 서비스에서 React Circle Card 시각적 개체를 새로 고칩니다.서식 탭을 선택하고 원을 확장합니다.
시각적 개체의 색상과 두께 설정을 조절하고 시각적 개체에 미치는 영향을 검토합니다.