Container insights log schema
Container insights stores log data it collects in a table called ContainerLogV2 in a Log Analytics workspace. This article describes the schema of this table and configuration options for it. It also compares this table to the legacy ContainerLog table and provides detail for migrating from it.
Table comparison
ContainerLogV2 is the default schema for CLI version 2.54.0 and greater. This is the default table for customers who onboard Container insights with managed identity authentication. ContainerLogV2 can be explicitly enabled through CLI version 2.51.0 or higher using data collection settings.
Important
Support for the ContainerLog table will be retired on 30th September 2026.
The following table highlights the key differences between using ContainerLogV2 and ContainerLog schema.
| Feature differences | ContainerLog | ContainerLogV2 |
|---|---|---|
| Schema | Details at ContainerLog. | Details at ContainerLogV2. Additional columns are: - ContainerName- PodName- PodNamespace- LogLevel1- KubernetesMetadata2 |
| Onboarding | Only configurable through ConfigMap. | Configurable through both ConfigMap and DCR. 3 |
| Pricing | Only compatible with full-priced analytics logs. | Supports the low cost basic logs tier in addition to analytics logs. |
| Querying | Requires multiple join operations with inventory tables for standard queries. | Includes additional pod and container metadata to reduce query complexity and join operations. |
| Multiline | Not supported, multiline entries are split into multiple rows. | Support for multiline logging to allow consolidated, single entries for multiline output. |
1 If LogMessage is valid JSON and has a key named level, its value will be used. Otherwise, regex based keyword matching is used to infer LogLevel from LogMessage. This inference may result in some misclassifications. LogLevel is a string field with a health value such as CRITICAL, ERROR, WARNING, INFO, DEBUG, TRACE, or UNKNOWN.
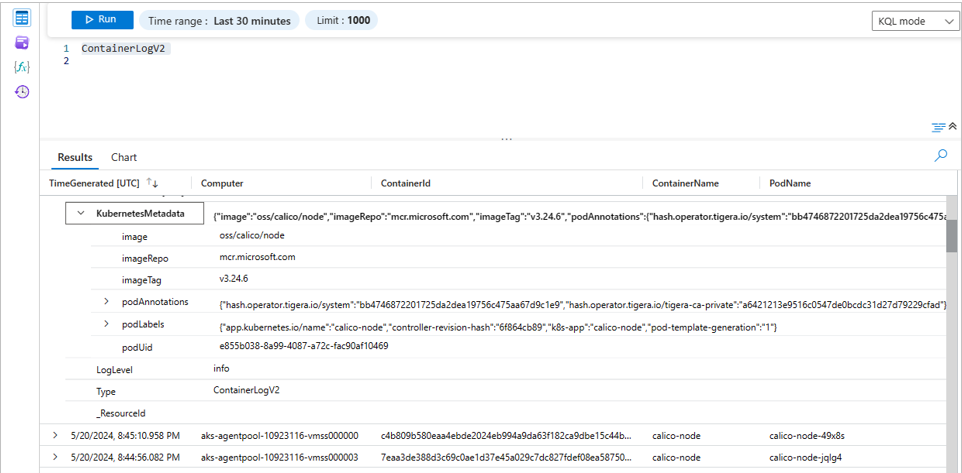
2 KubernetesMetadata is an optional column that is enabled with Kubernetes metadata. The value of this field is JSON with the fields podLabels, podAnnotations, podUid, Image, ImageTag, and Image repo.
3 DCR configuration requires managed identity authentication.
Note
Export to Event Hub and Storage Account is not supported if the incoming LogMessage is not valid JSON. For best performance, emit container logs in JSON format.
Enable the ContainerLogV2 schema
Enable the ContainerLogV2 schema for a cluster either using the cluster's Data Collection Rule (DCR) or ConfigMap. If both settings are enabled, the ConfigMap takes precedence. The ContainerLog table is used only when both the DCR and ConfigMap are explicitly set to off.
Before you enable the ContainerLogsV2 schema, you should assess whether you have any alert rules that rely on the ContainerLog table. Any such alerts need to be updated to use the new table. Run the following Azure Resource Graph query to scan for alert rules that reference the ContainerLog table.
resources
| where type in~ ('microsoft.insights/scheduledqueryrules') and ['kind'] !in~ ('LogToMetric')
| extend severity = strcat("Sev", properties["severity"])
| extend enabled = tobool(properties["enabled"])
| where enabled in~ ('true')
| where tolower(properties["targetResourceTypes"]) matches regex 'microsoft.operationalinsights/workspaces($|/.*)?' or tolower(properties["targetResourceType"]) matches regex 'microsoft.operationalinsights/workspaces($|/.*)?' or tolower(properties["scopes"]) matches regex 'providers/microsoft.operationalinsights/workspaces($|/.*)?'
| where properties contains "ContainerLog"
| project id,name,type,properties,enabled,severity,subscriptionId
| order by tolower(name) asc
Kubernetes metadata and logs filtering
Kubernetes metadata and logs filtering extends the ContainerLogsV2 schema with additional Kubernetes metadata. The logs filtering feature provides filtering capabilities for both workload and platform containers. These features give you richer context and improved visibility into your workloads.
Features
Enhanced ContainerLogV2 schema When Kubernetes Logs Metadata is enabled, it adds a column to
ContainerLogV2calledKubernetesMetadatathat enhances troubleshooting with simple log queries and removes the need for joining with other tables. The fields in this column include:PodLabels,PodAnnotations,PodUid,Image,ImageID,ImageRepo,ImageTag. These fields enhance the troubleshooting experience using log queries without having to join with other tables. See below for details on enabling the Kubernetes metadata feature.Log level This feature adds a
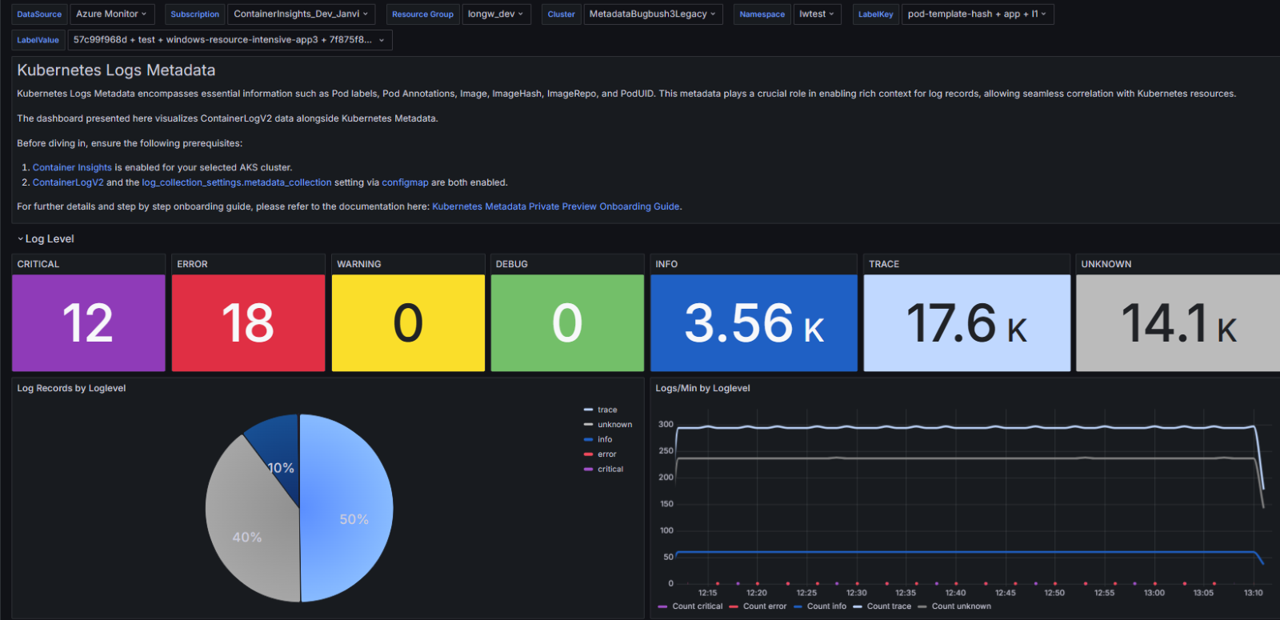
LogLevelcolumn to ContainerLogV2 with the possible values critical, error, warning, info, debug, trace, or unknown. This helps you assess application health based on severity level. Adding the Grafana dashboard, you can visualize the log level trends over time and quickly pinpoint affected resources.Grafana dashboard for visualization The Grafana dashboard provides a color-coded visualization of the log level and also provides insights into Log Volume, Log Rate, Log Records, Logs. You can get time-sensitive analysis, dynamic insights into log level trends over time, and crucial real-time monitoring. The dashboard also provides a detailed breakdown by computer, pod, and container, which empowers in-depth analysis and pinpointed troubleshooting. See below for details on installing the Grafana dashboard.
Annotation based log filtering for workloads Efficient log filtering through pod annotations. This allows you to focus on relevant information without sifting through noise. Annotation-based filtering enables you to exclude log collection for certain pods and containers by annotating the pod, which would help reduce the log analytics cost significantly. See Annotation-based log filtering for details on configuring annotation based filtering.
ConfigMap based log filtering for platform logs (System Kubernetes Namespaces) Platform logs are emitted by containers in the system (or similar restricted) namespaces. By default, all the container logs from the system namespace are excluded to minimize the cost of data in your Log Analytics workspace. In specific troubleshooting scenarios though, container logs of system container play a crucial role. One example is the
corednscontainer in thekube-systemnamespace.
Enable Kubernetes metadata
Important
Collection of Kubernetes metadata requires managed identity authentication and ContainerLogsV2
Enable Kubernetes metadata using ConfigMap with the following settings. All metadata fields are collected by default when the metadata_collection is enabled. Uncomment include_fields to specify individual fields to be collected.
[log_collection_settings.metadata_collection]
    enabled = true
    include_fields = ["podLabels","podAnnotations","podUid","image","imageID","imageRepo","imageTag"]
After a few minutes, the KubernetesMetadata column should be included with any log queries for ContainerLogV2 table as shown below.
Install Grafana dashboard
Important
If you enabled Grafana using the guidance at Enable monitoring for Kubernetes clusters then your Grafana instance should already have access to your Azure Monitor workspace for Prometheus metrics. The Kubernetes Logs Metadata dashboard also requires access to your Log Analytics workspace which contains log data. See How to modify access permissions to Azure Monitor for guidance on granting your Grafana instance the Monitoring Reader role for your Log Analytics workspace.
Import the dashboard from the Grafana gallery at ContainerLogV2 Dashboard. You can then open the dashboard and select values for DataSource, Subscription, ResourceGroup, Cluster, Namespace, and Labels.
Note
When you initially load the Grafana Dashboard, you may see errors due to variables not yet being selected. To prevent this from recurring, save the dashboard after selecting a set of variables so that it becomes default on the first open.
Multi-line logging
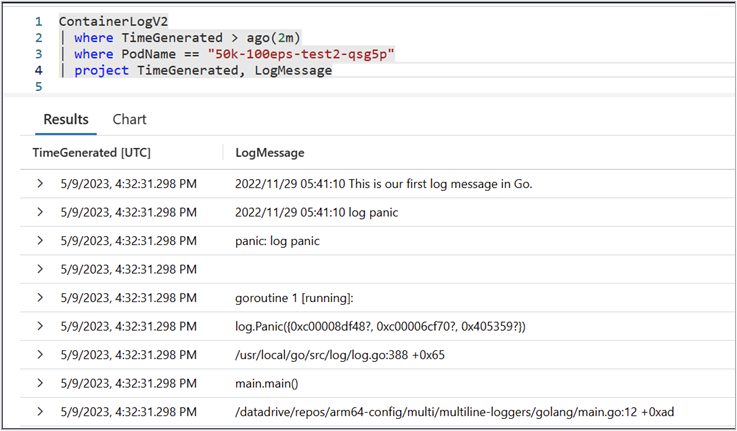
With multiline logging enabled, previously split container logs are stitched together and sent as single entries to the ContainerLogV2 table. If the stitched log line is larger than 64 KB, it will be truncated due to Log Analytics workspace limits. This feature also has support for .NET, Go, Python and Java stack traces, which appear as single entries in the ContainerLogV2 table. Enable multiline logging with ConfigMap as described in Configure data collection in Container insights using ConfigMap.
Note
The configmap now features a language specification option, wherein the customers can select only the languages that they are interested in. This feature can be enabled by editing the languages in the stacktrace_languages option in the configmap.
The following screenshots show multi-line logging for Go exception stack trace:
Multi-line logging disabled
Multi-line logging enabled
Java stack trace
Python stack trace
Next steps
- Configure Basic Logs for ContainerLogv2.
- Learn how query data from ContainerLogV2


