Perform common query tasks in Power BI Desktop
In the Power Query Editor window of Power BI Desktop, there are a handful of commonly used tasks. This article demonstrates those common tasks and provides links for additional information.
The common query tasks demonstrated here are:
- Connect to data
- Shape and combine data
- Group rows
- Pivot columns
- Create custom columns
- Query formulas
You can use multiple data connections to complete these tasks. The data from the sample Excel workbook is available for you to download or connect to, in case you want to step through these tasks yourself.
The first data connection is an Excel workbook, which you can download and save locally.
You can also find a web data source on your own, if you'd like to follow along with your own data.
Connect to data
To connect to data in Power BI Desktop, select Home and then choose Get data. Power BI Desktop presents a menu with the most common data sources. For a complete list of data sources to which Power BI Desktop can connect, select More at the end of the menu. For more information, see Data sources in Power BI Desktop.
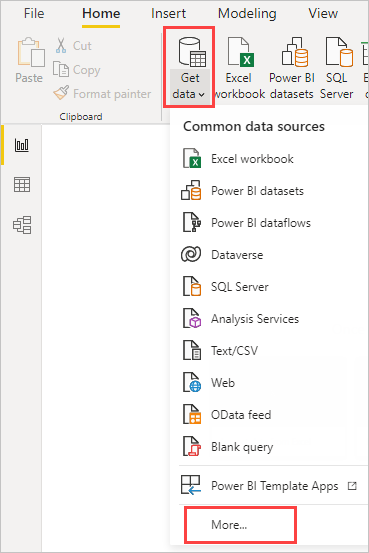
To start, select Excel Workbook, specify the Excel workbook mentioned earlier, and then choose Open. Power Query Editor inspects the workbook, then presents the data it found in the Navigator dialog box after you select a table.
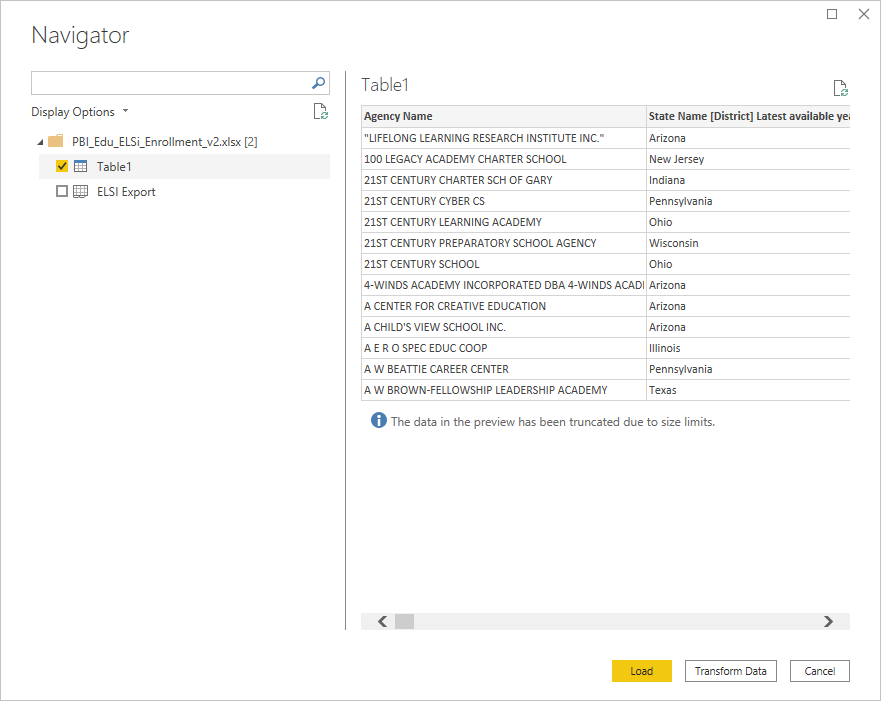
Select Transform Data to edit, adjust, or shape, the data before you load it into Power BI Desktop. Editing is especially useful when you work with large semantic models that you want to pare down before loading.
Connecting to different types of data is a similar process. To connect to a Web data source, select Get data > More, and then choose Other > Web > Connect.
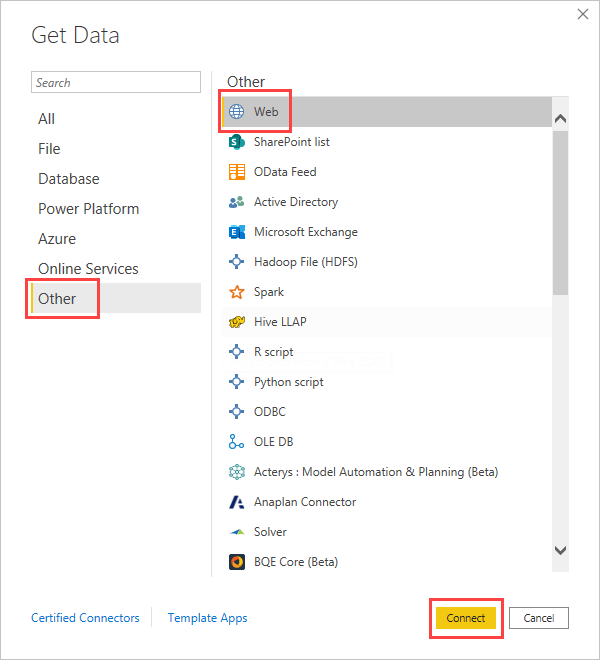
The From Web dialog box appears, where you can type in the URL of the webpage.

Select OK. Like before, Power BI Desktop inspects the webpage data and shows preview options in the Navigator dialog box. When you select a table, it displays a preview of the data.
Other data connections are similar. Power BI Desktop prompts you for the appropriate credentials if it needs you to authenticate your connection.
For a step-by-step demonstration of connecting to data in Power BI Desktop, see Connect to data in Power BI Desktop.
Shape and combine data
You can easily shape and combine data with Power Query Editor. This section includes a few examples of how you can shape data. For a more complete demonstration of shaping and combining data, see Shape and combine Data with Power BI Desktop.
This section and the following sections use the exampleExcel workbook mentioned previously, which you can download and save locally. Load the data in Power Query Editor by using the Transform data button in the Home tab. After you load the data, select Table 1 from the available queries in the Queries pane, as shown here:
When you shape data, you transform a data source into the form and format that meets your needs.
In Power Query Editor, you can find many commands in the ribbon, and in context menus. For example, when you right-click a column, the context menu lets you remove the column. Or select a column and then choose the Remove Columns button from the Home tab in the ribbon.
You can shape the data in many other ways in this query. You can remove any number of rows from the top or bottom. Or add columns, split columns, replace values, and do other shaping tasks. With these features, you can direct Power Query Editor to get the data how you want it.
Group rows
In Power Query Editor, you can group the values from many rows into a single value. This feature can be useful when summarizing the number of products offered, the total sales, or the count of students.
In this example, you group rows in an education enrollment semantic model. The data is from the Excel workbook.
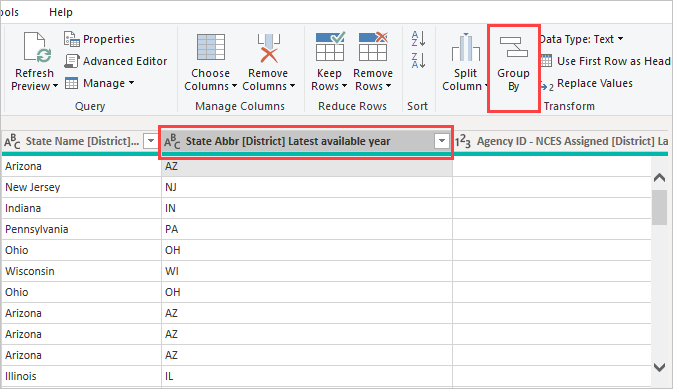
This example shows how many Agencies each state has. (Agencies can include school districts, other education agencies such as regional service districts, and more.) Select the State Abbr column, then select the Group By button in the Transform tab or the Home tab of the ribbon. (Group By is available in both tabs.)
The Group By dialog box appears. When Power Query Editor groups rows, it creates a new column into which it places the Group By results. You can adjust the Group By operation in the following ways:
- The unlabeled dropdown list specifies the column to be grouped. Power Query Editor defaults this value to the selected column, but you can change it to be any column in the table.
- New column name: Power Query Editor suggests a name for the new column, based on the operation it applies to the grouped column. You can name the new column anything you want, though.
- Operation: Choose the operation that Power Query Editor applies, such as Sum, Median, or Count Distinct Rows. The default value is Count Rows.
- Add grouping and Add aggregation: These buttons are available only if you select the Advanced option. In a single operation, you can make grouping operations (Group By actions) on many columns and create several aggregations by using these buttons. Based on your selections in this dialog box, Power Query Editor creates a new column that operates on multiple columns.
Select Add grouping or Add aggregation to add more groupings or aggregations to a Group By operation. To remove a grouping or aggregation, select the ellipsis icon (...) to the right of the row, and then Delete. Go ahead and try the Group By operation by using the default values to see what occurs.
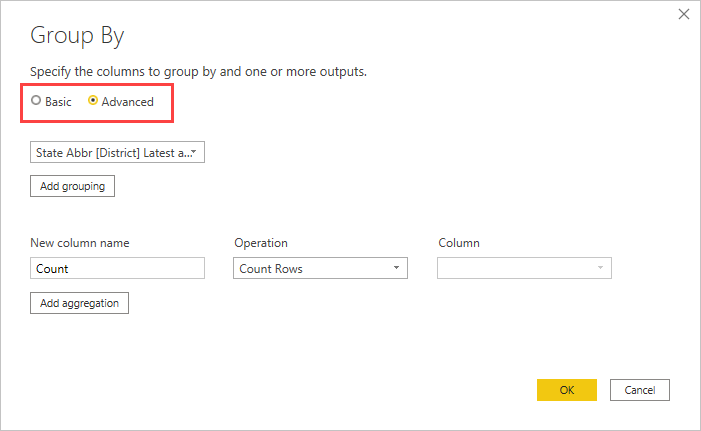
When you select OK, Power Query Editor does the Group By operation and returns the results.
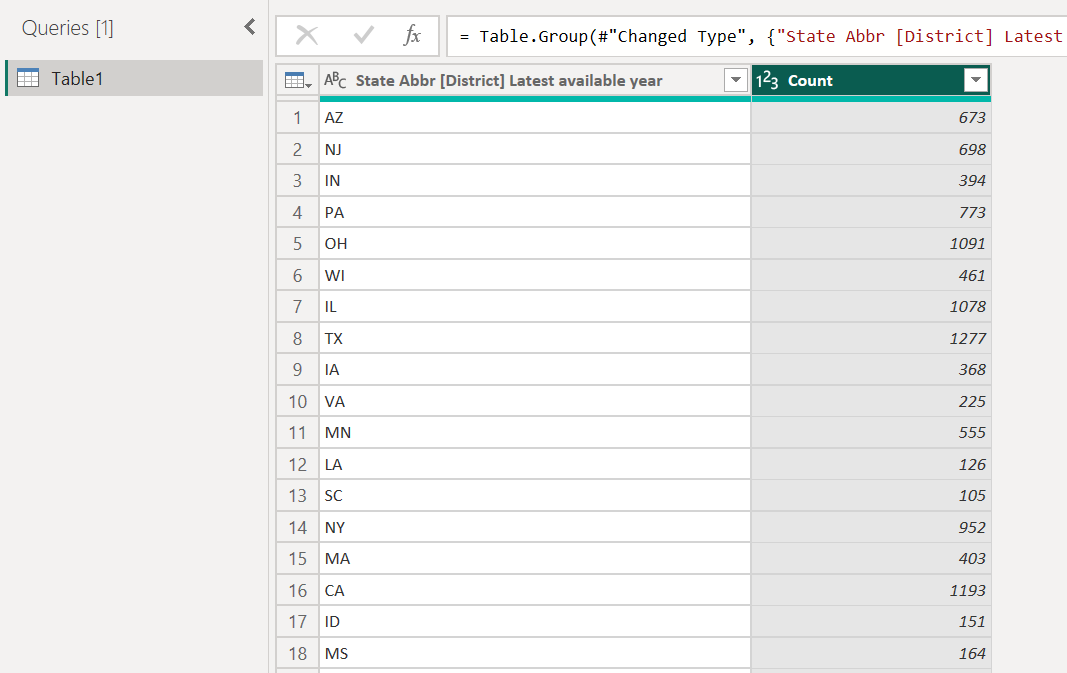
And with Power Query Editor, you can always remove the last shaping operation. In the Query Settings pane, under Applied Steps, just select the X next to the step recently completed. So go ahead and experiment. If you don’t like the results, redo the step until Power Query Editor shapes your data the way you want.
Pivot columns
You can pivot columns and create a table that contains aggregated values for each unique value in a column. For example, to find out how many different products are in each product category, you can quickly create a table to do that.
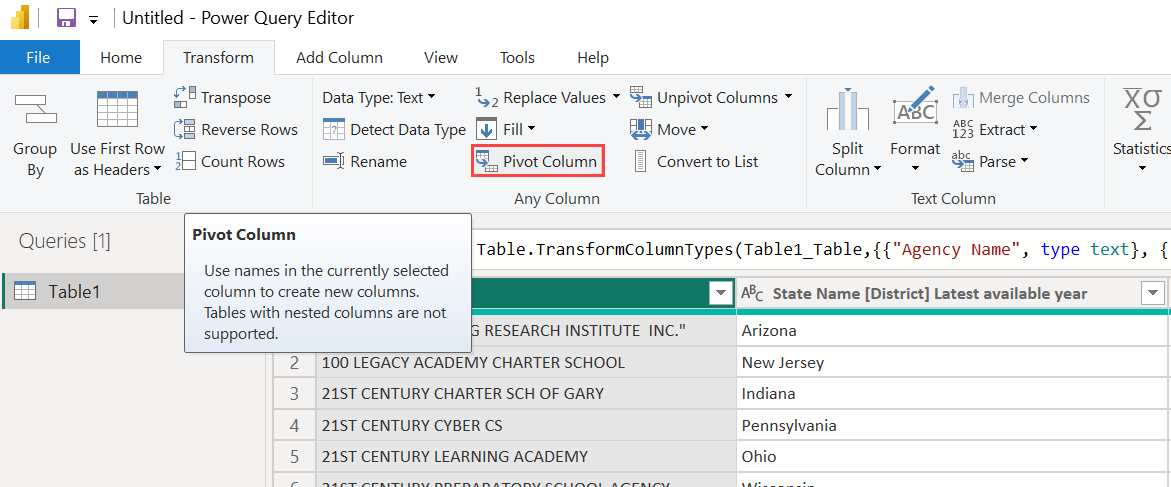
To create a new table that shows a count of products for each category (based on the CategoryName column), select the column, then select Transform > Pivot Column.
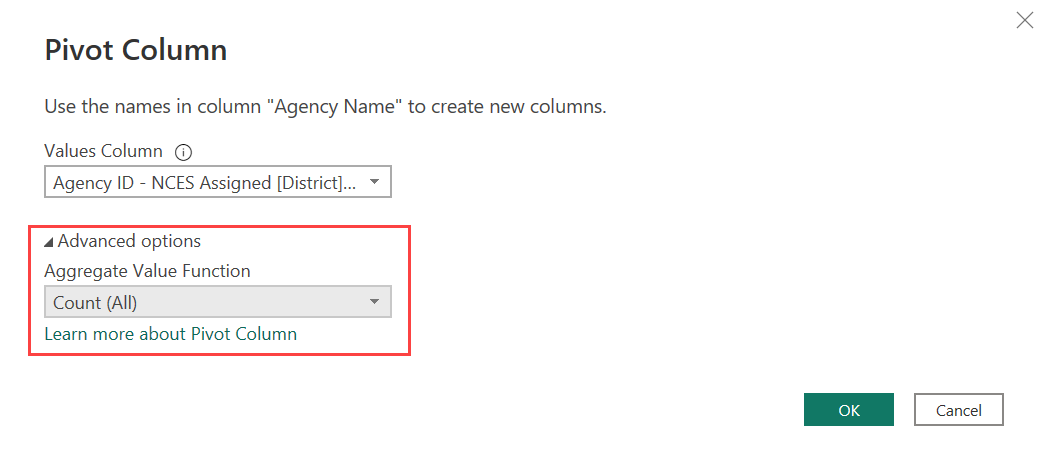
The Pivot Column dialog box appears, letting you know which column’s values the operation uses to create new columns. (If the wanted column name of CategoryName isn't shown, select it from the dropdown list.) When you expand Advanced options, you can select which function to apply to the aggregated values.
When you select OK, Power Query Editor displays the table according to the transform instructions provided in the Pivot Column dialog box.

Create custom columns
In Power Query Editor, you can create custom formulas that operate on multiple columns in your table. Then you can place the results of such formulas into a new (custom) column. Power Query Editor makes it easy to create custom columns.
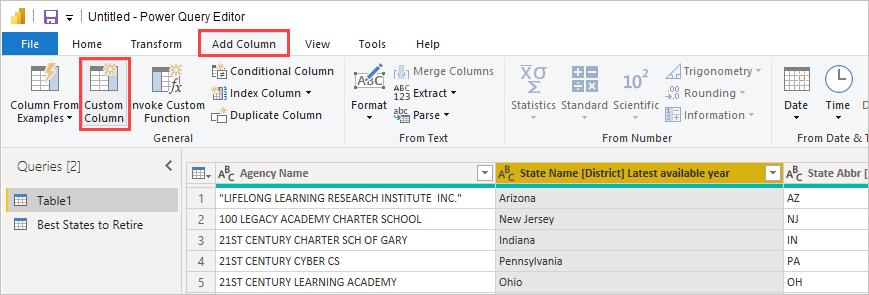
With the Excel workbook data in Power Query Editor, go to the Add Column tab on the ribbon, and then select Custom Column.
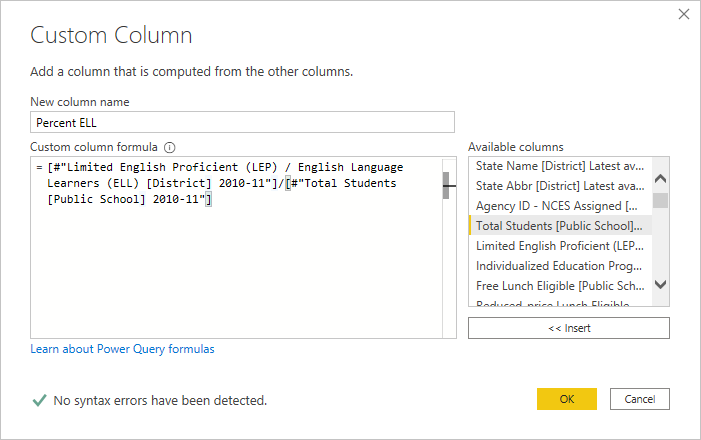
The following dialog box appears. This example creates a custom column called Percent ELL that calculates the percentage of total students that are English Language Learners (ELL).
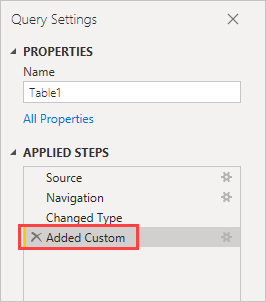
As with any other applied step in Power Query Editor, if the new custom column doesn’t provide the data you’re looking for, you can delete the step. In the Query Settings pane, under APPLIED STEPS, just select the X next to the Added Custom step.
Query formulas
You can edit the steps that Power Query Editor generates. You can also create custom formulas, which let you connect to and shape your data more precisely. Whenever Power Query Editor does an action on data, the formula associated with the action is displayed in the formula bar. To view the formula bar, go to the View tab of the ribbon, and then select Formula Bar.

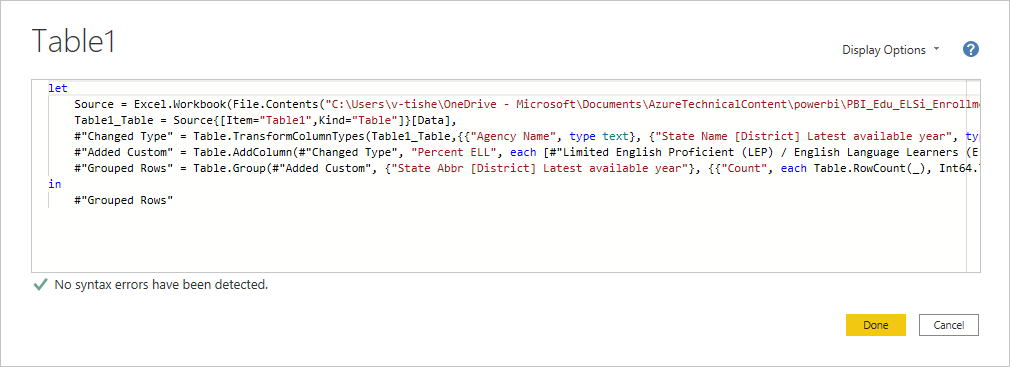
Power Query Editor keeps all applied steps for each query as text that you can view or modify. You can view or modify the text for any query by using the Advanced Editor. Just select View and then Advanced Editor.

Here's a screenshot of the Advanced Editor, with the query steps associated with the USA_StudentEnrollment query displayed. These steps are created in the Power Query Formula Language, often referred to as M. For more information, see Create Power Query formulas in Excel. To view the language specification itself, see Power Query M language specification.
Power BI Desktop provides an extensive set of formula categories. For more information, and a complete reference of all Power Query Editor formulas, see Power Query M function reference.
Related content
You can do all sorts of things with Power BI Desktop. For more information on its capabilities, see the following resources:

