Navigate through code by using the Visual Studio debugger
The Visual Studio debugger can help you navigate through code to inspect the state of an app and show its execution flow, which is also known as code stepping. You can use keyboard shortcuts, debug commands, breakpoints, and other features to quickly get to the code you want to examine. By getting more familiar with debugger navigation commands and shortcuts, you can find and resolve app problems faster and more easily. For a list of the most common keyboard shortcuts related to code navigation and debugging, see the Debug section in Keyboard shortcuts.
Note
If you're new to debugging code, you might want to read Debugging for absolute beginners and Debugging techniques and tools before you read this article.
Start debugging and enter break mode
Some navigation commands start your app and automatically attach the debugger. Your app pauses on a specific line of code based on the command you used to start navigation, and you enter break mode (that is, your app is paused in the debugger).
In break mode, app execution is suspended while functions, variables, and objects remain in memory. When the debugger is in break mode, you can navigate through your code. There are two very common ways to quickly enter break mode:
Set a breakpoint and start your app.
Run to a specific location or function.
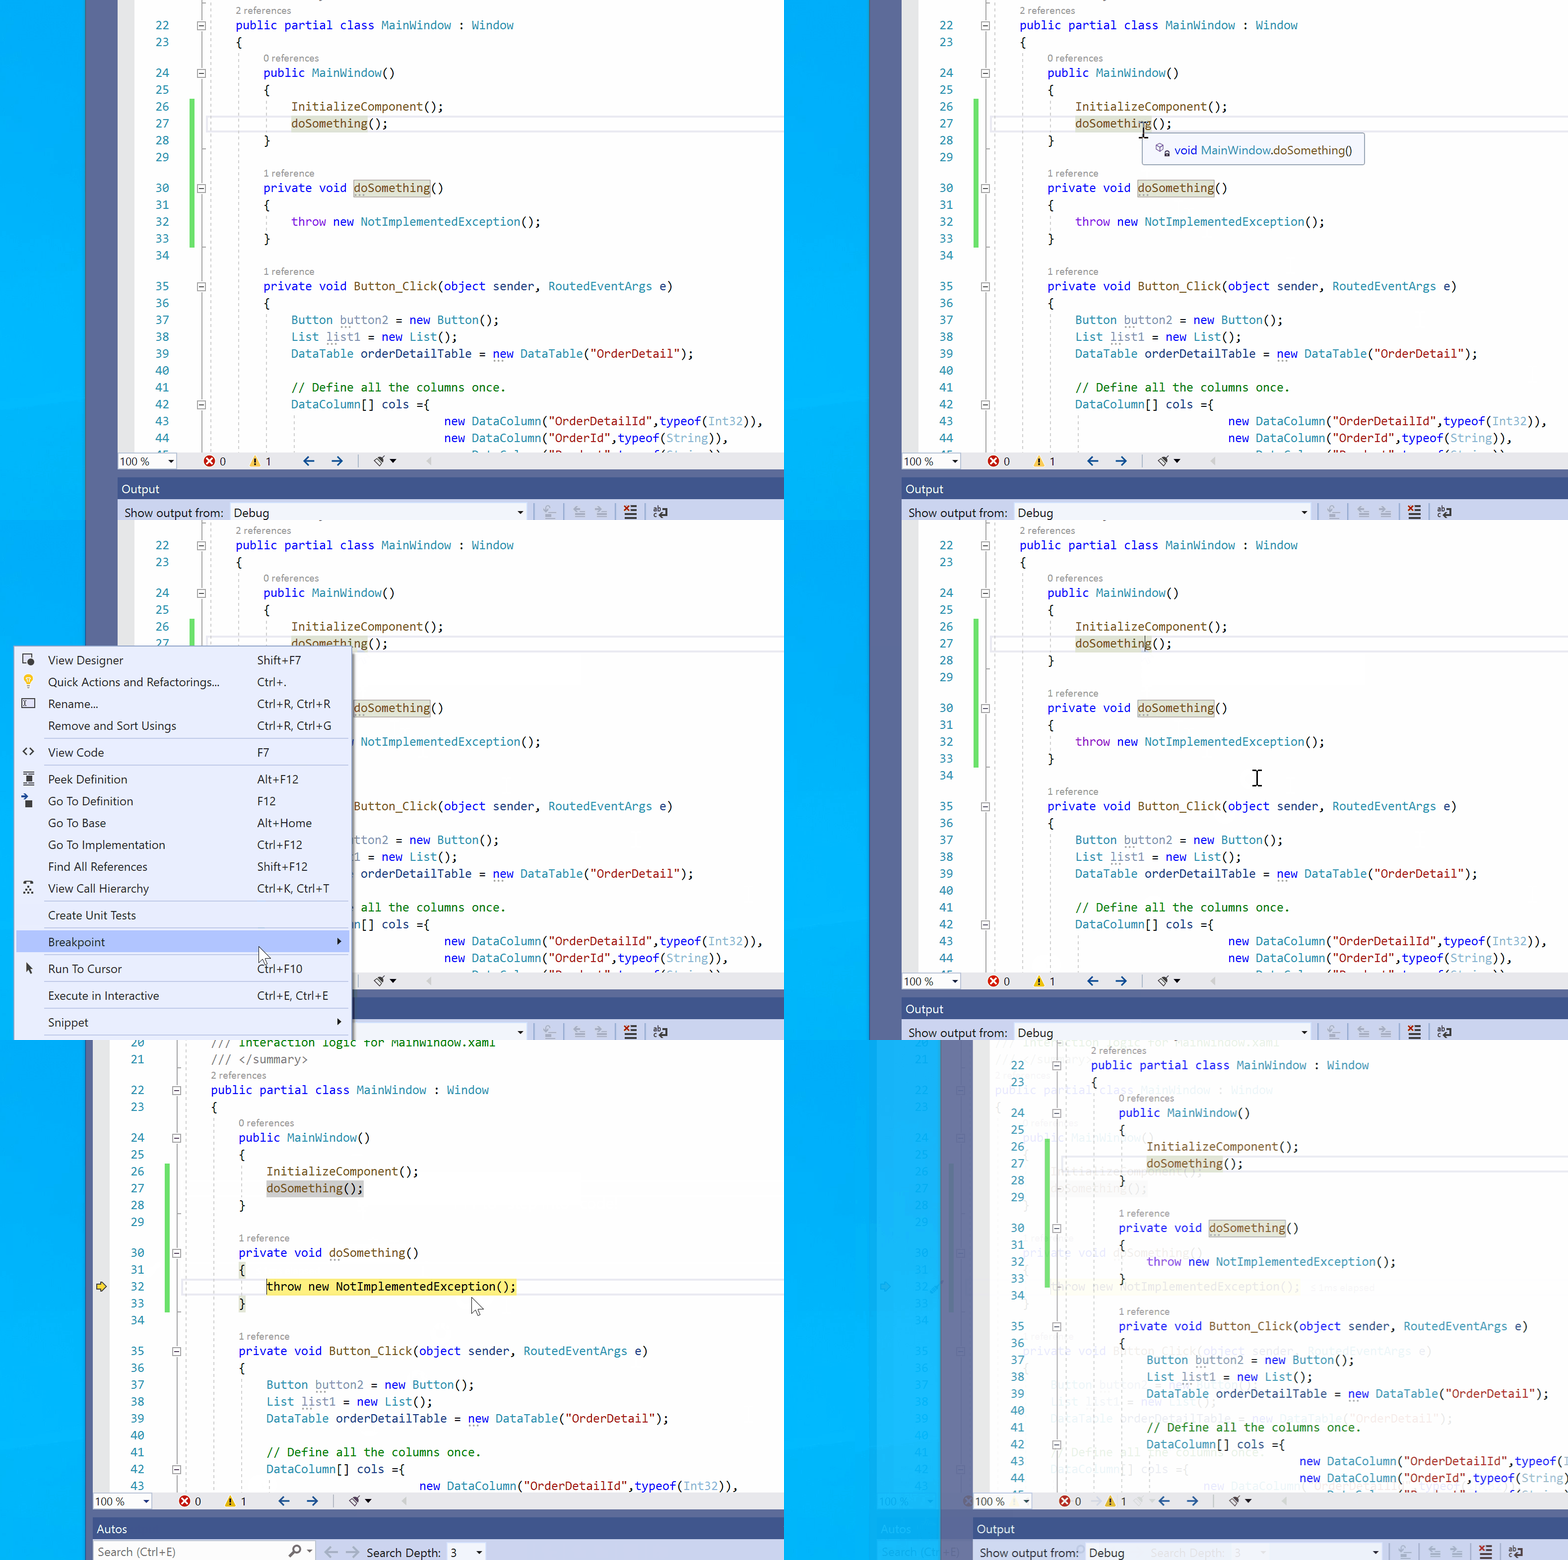
For example, in the code editor in Visual Studio, you can use the Run To Cursor command to start the app, with the debugger attached, and enter break mode. Then you can use step commands to navigate the code.


Code stepping commands can be used to start your app, but are more commonly used after you enter break mode.
Navigate code while in break mode
Some navigation commands are mostly used while in break mode (that is, while you're paused in the debugger).
Code stepping commands are most commonly used in break mode.
Some commands like Run to click can only be used while in break mode.
Debugging and break mode
When you're in break mode, you can use various commands to navigate through your code. You can examine the values of variables to look for violations or bugs. For some project types, you can also make adjustments to the app when you're in break mode.
Most debugger windows, like the Modules and Watch windows, are available only when the debugger is attached to your app. Some debugger features, like viewing variable values in the Locals window or evaluating expressions in the Watch window, are available only when the debugger is paused (that is, in break mode).
Note
If you break into code that doesn't have source or symbol (.pdb) files loaded, the debugger displays a Source Files Not Found or Symbols Not Found page that can help you find and load the files. See Specify symbol (.pdb) and source files. If you can't load the symbol or source files, you can still debug the assembly instructions in the Disassembly window.
Code stepping
Code stepping refers to executing your application code one statement at a time, with the debugger attached. The debugger step commands help you observe the effects of each statement and find out more about its execution flow.
Step into code
To stop on each statement when you're debugging, use Debug > Step Into, or select F11.
The debugger steps through code statements, not physical lines. For example, an if clause can be written on one line:
But when you step into this line, the debugger treats the condition as one step and the consequence as another. In the preceding example, the condition is true.
On a nested function call, Step Into steps into the most deeply nested function. For example, if you use Step Into on a call like Func1(Func2()), the debugger steps into the function Func2.
Tip
As you run each line of code, you can hover over variables to see their values, or use the Locals and Watch windows to watch the values change. You can also visually trace the call stack while you step into functions. (For Visual Studio Enterprise only, see Map methods on the call stack while debugging.)
Step through code and skip some functions
You might not care about a function when you're debugging. Or you might know some code works, like well-tested library code. You can use the following commands to skip code when you're code stepping. The functions still run, but the debugger skips over them.
| Keyboard command | Debug menu command | Description |
|---|---|---|
| F10 | Step Over | If the current line contains a function call, Step Over runs the code and then suspends execution at the first line of code after the called function returns. |
| Shift+F11 | Step Out | Step Out continues running code and suspends execution when the current function returns. The debugger skips through the current function. |
Run to a specific location or function
You might prefer to run directly to a specific location or function when you know exactly what code you want to inspect or if you know where you want to start debugging.
- Setting a breakpoint is best if you think you might want to re-use the breakpoint.
- Other methods are for convenience, and are similar to setting a temporary breakpoint.
Run to a breakpoint in code
To set a simple breakpoint in your code, select the far-left margin next to the line of code where you want to suspend execution. You can also select the line and then select F9, select Debug > Toggle Breakpoint, or right-click and select Breakpoint > Insert Breakpoint. The breakpoint appears as a red dot in the left margin next to the line of code. The debugger suspends execution just before the line runs.


Breakpoints in Visual Studio provide a rich set of functionality, like conditional breakpoints and tracepoints. For details, see Using breakpoints.
Run to a function breakpoint
You can set the debugger to run until it reaches a specified function. You can specify the function by name, or you can choose it from the call stack.
To specify a function breakpoint by name:
Select Debug > New Breakpoint > Function Breakpoint.
In the New Function Breakpoint dialog, enter the name of the function and select its language:


Select OK.
If the function is overloaded or in more than one namespace, you can choose the one you want in the Breakpoints window:


To select a function breakpoint from the call stack:
While debugging, open the Call Stack window by selecting Debug > Windows > Call Stack.
In the Call Stack window, right-click a function and select Run To Cursor, or select Ctrl+F10.
For information about visually tracing the call stack, see Map methods on the call stack while debugging.
Run to a cursor location
To run to the cursor location, in source code or the Call Stack window, select the line you want to break at, and then right-click and select Run To Cursor, or select Ctrl+F10. Selecting Run To Cursor is similar to setting a temporary breakpoint.
Force run to a cursor location
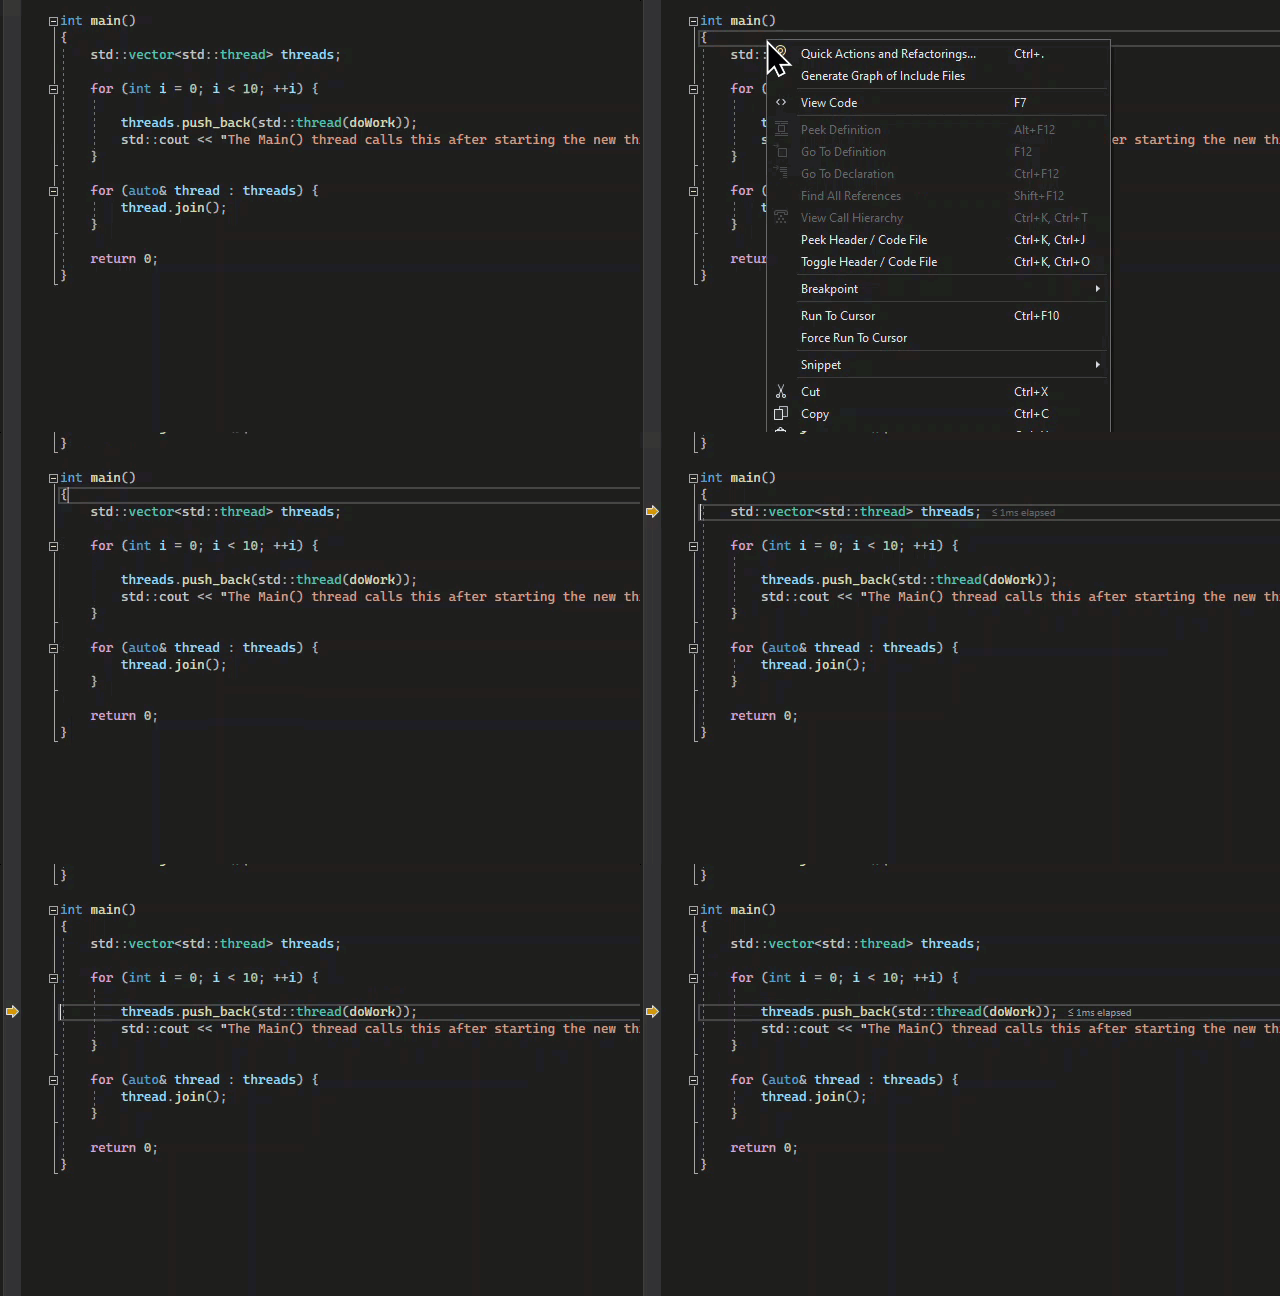
To run to the cursor location, in source code or the Call Stack window, select the line you want to break at, and then right-click and select Force Run To Cursor. Selecting Force Run To Cursor will skip any breakpoints and first-chance exceptions until the debugger reaches the line of code where the cursor is located.
Run to click
While the debugger is paused, you can hover over a statement in source code or the Disassembly window and select the Run execution to here green arrow. Using Run to Click is similar to setting a temporary breakpoint.

Note
Run to Click is available starting in Visual Studio 2017.
Force run to click
While the debugger is paused, you can hover over a statement in source code while pressing the Shift key and then select Force run execution to here (the double green arrow). When you choose this option, the application attaches the Visual Studio debugger and pauses at the cursor location. Any breakpoints and first-chance exceptions found during execution are temporarily disabled.

Note
Force Run to Click is available starting in Visual Studio 2022.
Manually break into code
To break into the next available line of code in a running app, select Debug > Break All, or select Ctrl+Alt+Break.
Debug non-user code
By default, the debugger tries to debug only your app code by enabling a setting called Just My Code. For details about how this feature works for various project types and languages, and how you can customize it, see Just My Code.
To look at framework code, third-party library code, or system calls while debugging, you can disable Just My Code. In Tools (or Debug) > Options > Debugging, clear the Enable Just My Code checkbox. When Just My Code is disabled, non-user code appears in the debugger windows, and the debugger can step into the non-user code.
Note
Just My Code isn't supported for device projects.
Debug system code
If you've loaded debugging symbols for Microsoft system code and disabled Just My Code, you can step into a system call just as you can any other call.
Starting in Visual Studio 2022 version 17.7, you can autodecompile .NET code when stepping into external code without the need to manually load debugging symbols. For more information, see Generate source code from .NET assemblies while debugging.
To learn about loading Microsoft symbols, see Configure location of symbol files and loading options.
To load symbols for a specific system component:
While you're debugging, open the Modules window by selecting Debug > Windows > Modules or by pressing Ctrl+Alt+U.
In the Modules window, you can tell which modules have symbols loaded in the Symbol Status column. Right-click the module that you want to load symbols for and then select Load Symbols.
Step into properties and operators in managed code
The debugger steps over properties and operators in managed code by default. In most cases, this behavior provides a better debugging experience. To enable stepping into properties or operators, select Debug > Options. On the Debugging > General page, clear the Step over properties and operators (Managed only) checkbox.
Move the pointer to change the execution flow
You can change the next statement that will run by moving the yellow execution pointer. You can use this feature while in break mode.
This is an advanced debugger feature. For more information, see Move the execution pointer.