Helping an agent's productivity
It's important that customer service managers and supervisors have necessary operational metrics at their disposal to ensure agents are providing customers with quality support. By equipping supervisors with the right data, they can spot trends in these metrics over periods of time to better understand how agents and queues are performing. Based on this information, they can take corrective measures, provide appropriate guidance to agents, and improve the customer support experience.
Dynamics 365 Omnichannel for Customer Service includes the Omnichannel Insights dashboard. It provides Key Performance Indicators (KPIs) and trends that supervisors can use to better understand the overall state of the support experience at a glance.
The overview dashboard is divided into two sections:
Omnichannel Insights dashboard: Provides important KPI details such as Average wait time, Abandon Rates, Average Handle Time, Transfer rate, Average Customer Sentiment Pulse and more.
Omnichannel Sentiment Analysis dashboard: Provides an overview of Important KPIs and trends relative to the sentiment analysis of conversation offered.
The following illustration is an example of the Omnichannel Insights for Dynamics 365 dashboard.

You can learn more about the different KPIs and visualizations available on the Omnichannel Insights dashboard here: Omnichannel Insights Dashboard.
Omnichannel Insights for Dynamics 365
The Omnichannel Insights reports allow your administrators and supervisors to know how overall support is performing across channels. Rich visualizations with the ability to filter across channels, queues, agents, and date ranges help them to better understand performance and troubleshoot problem areas.
The reporting structure consists of the following sections:
Conversations and channels: Provides historical visibility into the overall support operations across various conversations and channels.
Queue and agents: Provide historical visibility about how queues and agents are performing across different channels so supervisors can take appropriate steps to improve the support experience for the customer.
Bot insights: Provides historical visibility into how bots are performing to help resolve customer support issues.
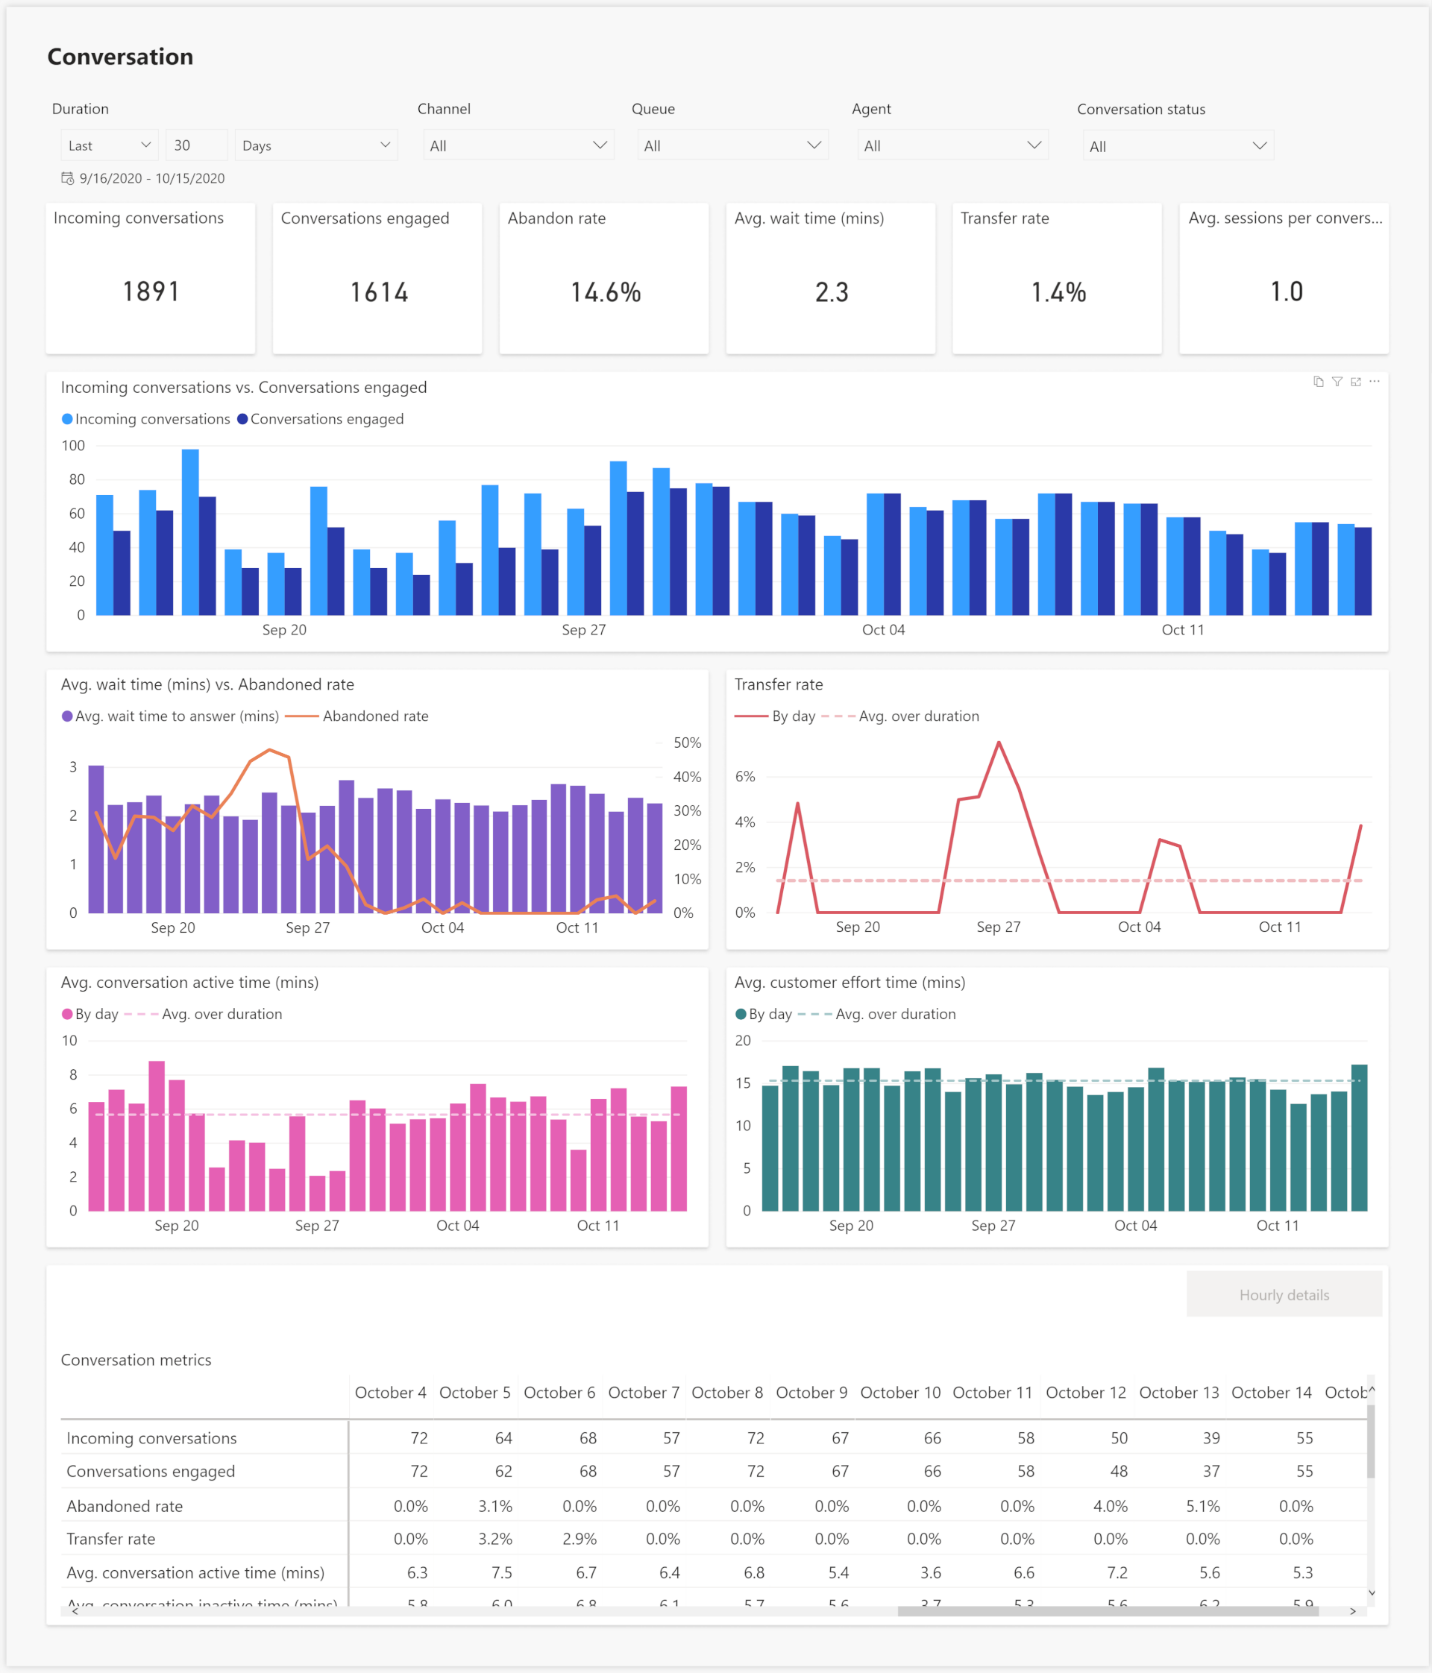
Conversations and Channels
The conversations and channels report provides important KPIs for conversations and channels. For conversations, these KPIs are applicable to scenarios in which bots escalate to agents or agents directly handle customer calls. For support channels such as chat, SMS, or voice, KPIs are applicable by each channel. This helps supervisors easily understand how each support channel is performing and take appropriate actions to improve the overall support experience for customers.
Some of the key KPIs available are:
Incoming conversations: The number of conversations initiated by the customers that can be presented to agents.
Conversations engaged: Offered conversations that are engaged by an agent. Customer-to-agent communication can begin at this point.
Abandon rate: The percentage of conversations that aren't engaged by agents.
Transfer rate: The percentage of conversations that are transferred to another agent or queue.
Conversation handle time: Cumulative session active time for a conversation.
Average Conversation time: Average time from the conversation start to conversation end.
Average Customer Effort time: Average time from the conversation start to the conversation wrap-up start time.
Customer wait time: The average time customers have waited before connecting to agents.
Average Customer sentiment pulse (CSP): The predicted customer sentiment in a given timeframe for a set queue or agent, which indicates the degree of positive sentiment expressed by customers at the end of their interactions.

You can find a complete list of all KPIs, and a breakdown of each one included in the Conversation and Channels report here: Conversations and Channels
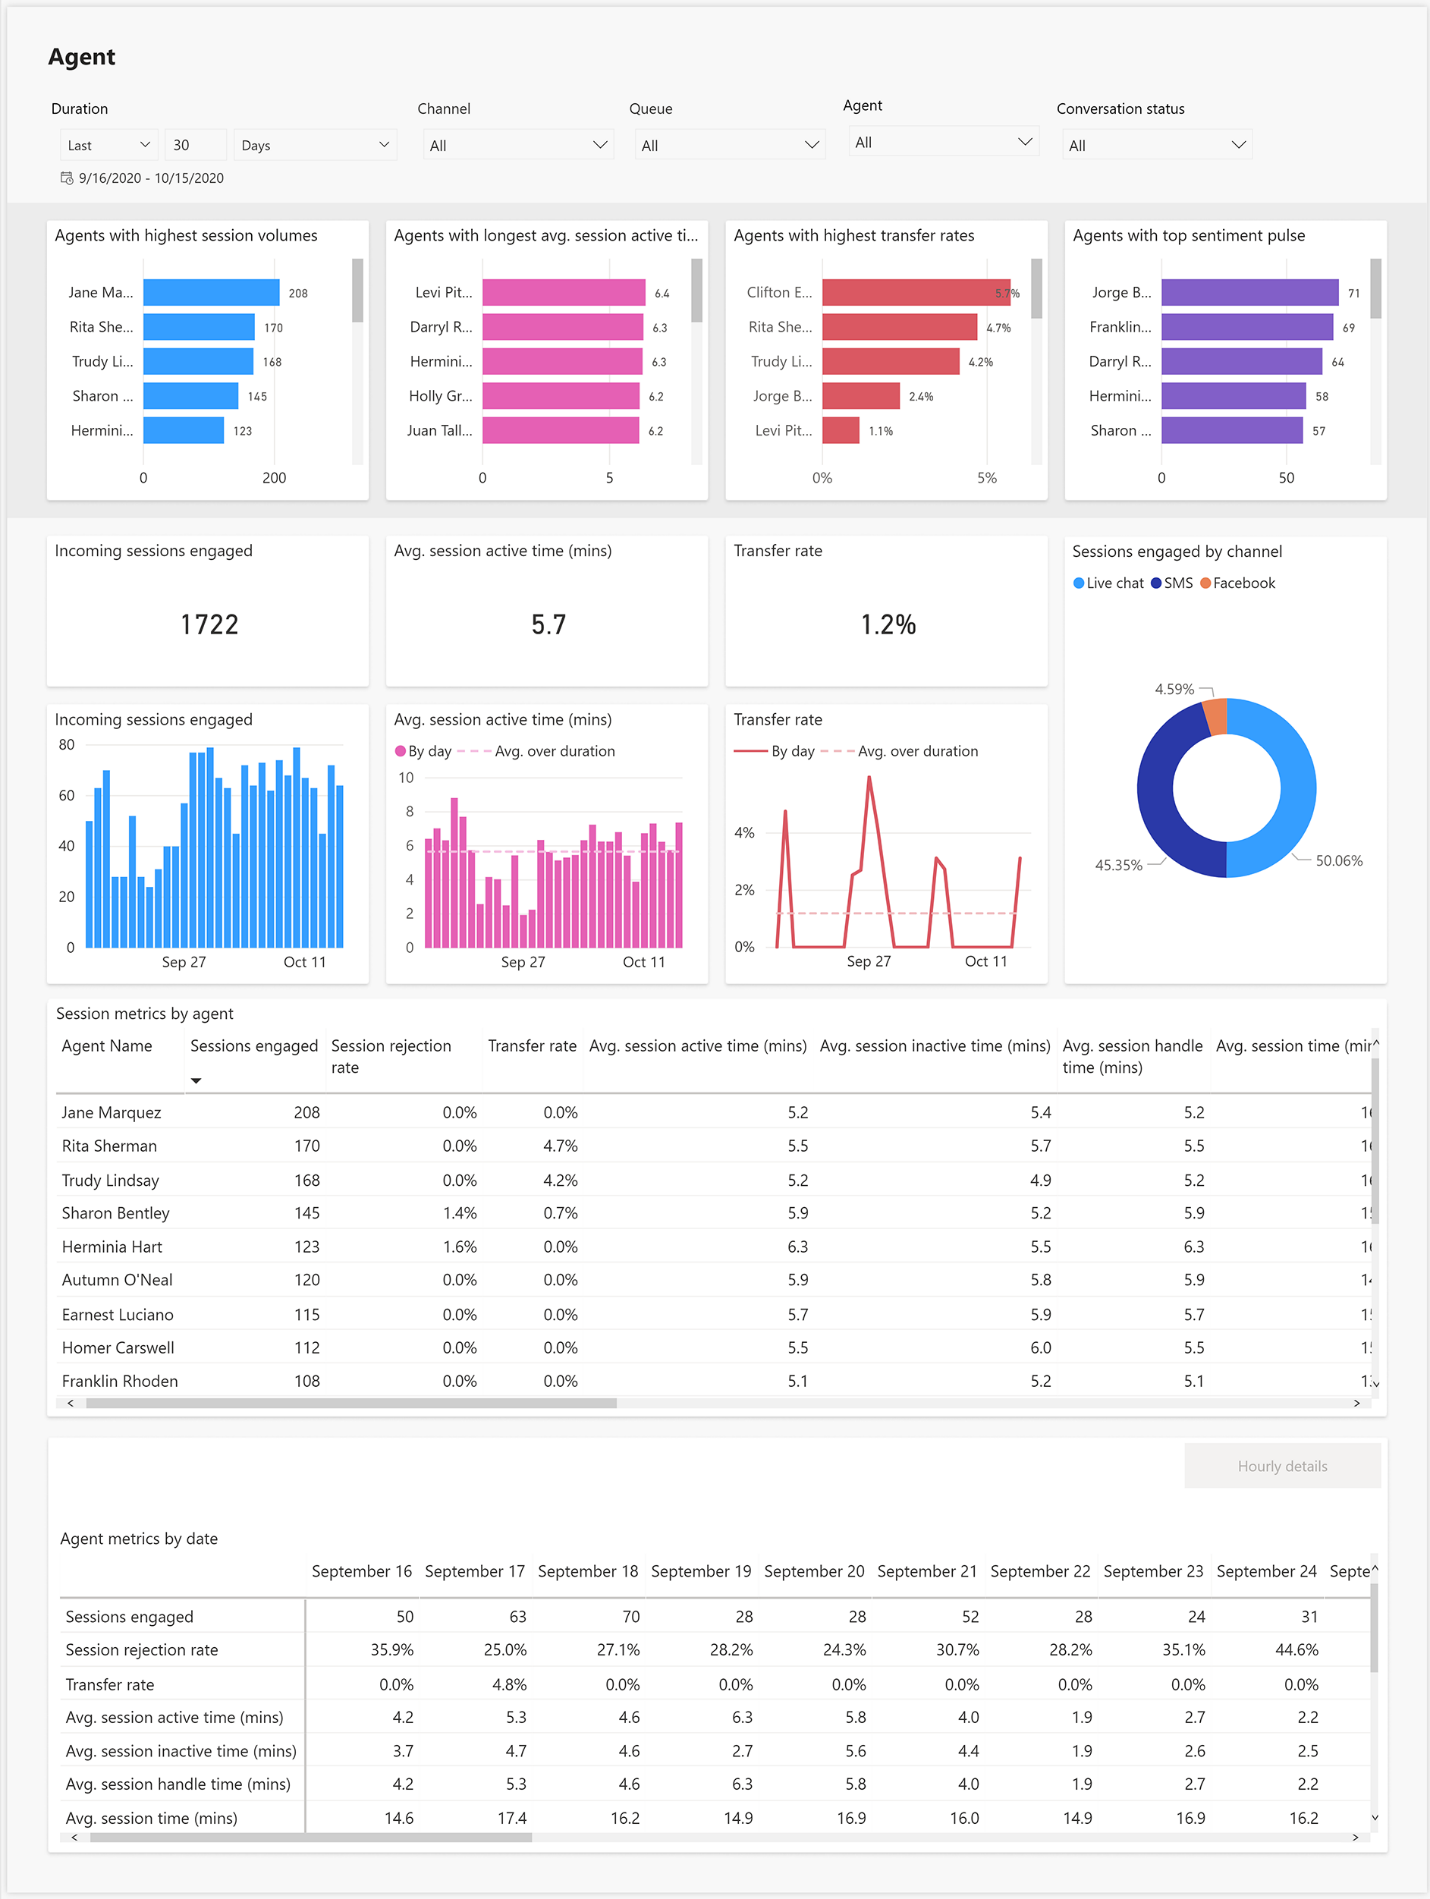
Queue and agents
The queue and agent sections contain KPIs that help break down conversation information by queues and agents. For example, you can use this information to identify which agents are most efficient. The metrics in this section are computed based on the session granularity. Each customer contact is defined as a conversation. Each conversation is defined as a session. It's possible that one or more agents can handle a conversation.
Some of the key KPIs provided in this section include:
Consult sessions: The number of sessions accepted by a user in mode = consult.
Total consult time: The time spent on the consult from when the agent joined to when they left the session participant.
Average consult time: The total consult time divided by the total consult sessions.
Sessions engaged: the number of sessions presented to an agent and accepted by an agent.
Session rejection rate: The number of sessions presented to an agent that aren't accepted by an agent.
Transfer rate: The number of sessions transferred by an agent.
Consult sessions: The number of sessions where the agent has participated in consult mode.
Monitor sessions: The number of sessions where the agent has participated in monitor mode.
Average consult time: The average time the agent spent on a session in consulting mode.
Session active time: The time an agent actively spent on a session.

You can find a complete list of all KPIs, and a breakdown of each one included in the Queue and Agent section here: Queues and Agents
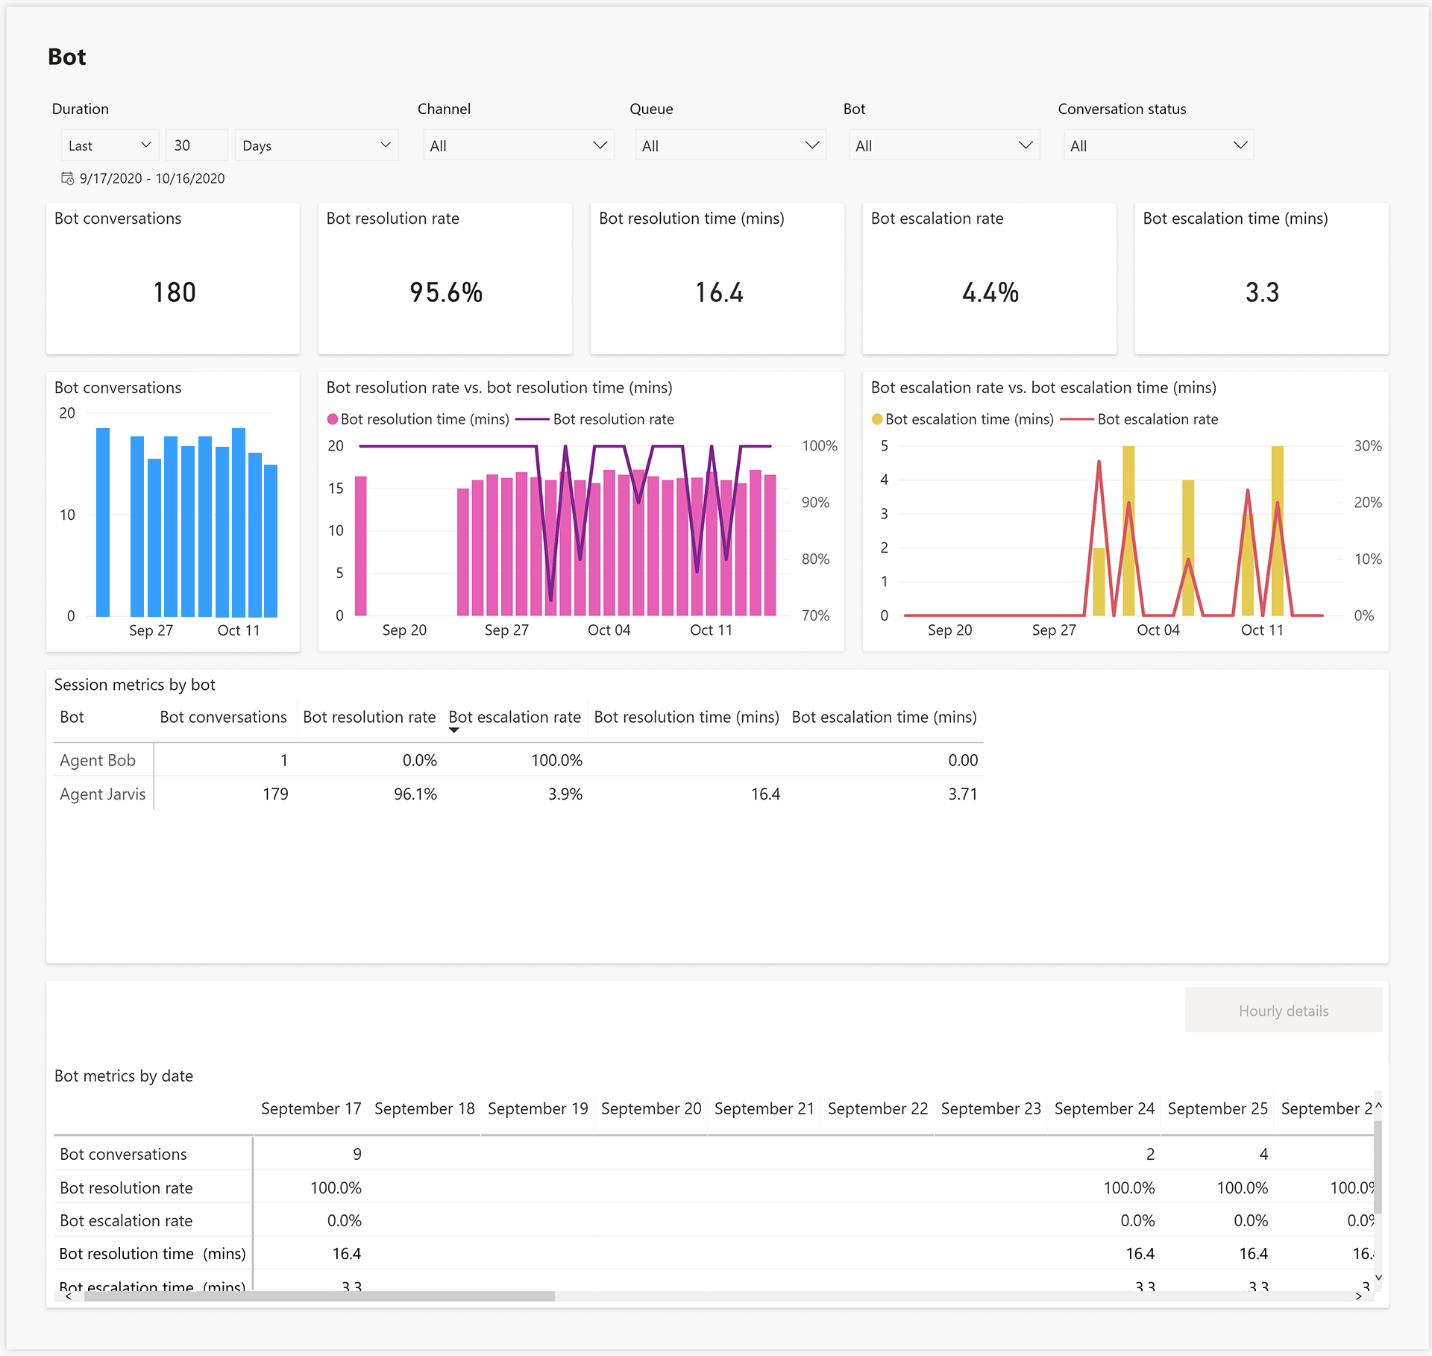
Bot insights
More support organizations are using bots to help enhance their customers support experience. They can help to reduce customer wait times, ease agent work loads, and more. The Bot insights section lets you see how your bots are performing to help resolve customer support issues. The KPIs available for bots include:
Bot conversations: The number of conversations initiated by the customer and handled by a bot.
Bot resolution rate: The percentage of conversations that were closed by interacting with a bot out of all conversations handled by a bot.
Bot resolution time (mins): The length of time, in minutes, a customer interacted with a bot before the conversation was closed.
Bot escalation rate: The percentage of conversations that a bot escalates to a human agent.
Bot escalation time (mins): The length of time, in minutes, a customer interacted with a bot before the conversation was escalated to a human agent.

You can find a complete list of all KPIs and a breakdown of each one included in the Bot insights section here: Bot insights
Omnichannel Sentiment Analysis dashboard
Sentiment refers to the positivity or negativity expressed by individuals. Sentiment analysis provides an effective way to evaluate written or spoken language to determine if the expression is favorable, unfavorable, or neutral, and to what degree. As customer sentiment is captured, it's placed into sentiment zones. There are three zones that conversations could be placed in:
Positive sentiment: Expressed by the customer writing messages indicating that they're happy, pleased, or positive because of the support interaction. There must be positive words to convey positive feeling beyond simple pleasantries or politeness. For example, a customer saying, "thank you," is just being polite. It doesn't indicate that they're pleased or happy. However, if they say something like "I can't thank you enough" or "thank you very much," now they're indicating a positive feeling.
Negative sentiment: Expressed by the customer when they're disappointed with the support interaction. These can be cases where the customer is indicating frustration or unhappiness when describing a problem because of how it's currently affecting them. For something to be scored with negative sentiment, the words need to clearly convey that the user is unhappy, disappointed, or frustrated.
Neutral sentiment: Represented when a customer's sentiment wasn't positive or negative. A customer's problem statement isn't to be scored as negative. It should be scored neutral unless it contains words that denote emotion. This is true regardless of how severe the user's problem is. Messages with non-specific pleasantries or politeness are scored as neutral and not as positive.
There are several sentiment analysis KPIs displayed on the report.
Average Sentiment Pulse: The predicted customer sentiment in a given timeframe for a set queue or agent that indicates the degree of positive sentiment expressed by customers at the end of their interactions. For channel and queue, it provides the overall customer sentiment of the conversation. For agent, it provides the customer sentiment specific to the sessions handled by the agent in the conversation.
% Positive Sentiment: Count of positive sentiment zone conversations divided by total sessions.
% Neutral Sentiment: Count of neutral sentiment zone conversations divided by total sessions.
% Negative Sentiment: Count of negative sentiment zone conversations divided by total sessions.

Configure Omnichannel Insights dashboards
Customer service managers or supervisors are responsible for managing agents who work to resolve customer queries every day through various service channels. They need to know key operational metrics to ensure that their agents are providing quality support. Omnichannel Insights consists of channels and sentiment analysis dashboards that can help.
As an administrator, you must download the Omnichannel Insights for Dynamics 365 app and configure it to display channels and sentiment analysis dashboards in the Omnichannel for Customer Service app. To configure Omnichannel Insights, follow these steps:
Step 2: Install Omnichannel Insights for Dynamics 365 app
Step 3: Connect to Omnichannel Insights for Dynamics 365 app
Step 4: Configure refresh frequency on Power BI Dataset
Step 5: Publish application within your organization
Step 6: Add Power BI Dashboards to Omnichannel for Customer Service
Before you can configure the dashboards, you need to have administrative privileges for both Dynamics 365 Customer Service and Power BI. Also, you need a Power BI Pro license to:
Get the Omnichannel insights from the app store and install it in your organization.
For users to use the template app or to share it with other Power BI Pro users.
You also need to have assigned template app workspace to a premium capacity so that every free user in the organization can consume the report. For more information, see Ways to collaborate and share in Power BI.
The final thing that you need to do before getting started is to ensure that you have enabled the embedding of Power BI reports in Dynamics 365 Customer Service. You can do so in the Power Platform Admin Center.
Once in the Power Platform admin center, select the environment to embed the Power BI Reports in, and choose Settings. Once in Settings, expand Product and choose Features. Under the Embedded content heading, set Power BI visualization embedding to On.

Install Omnichannel Insights for Dynamics 365 app
The Omnichannel Insights for Dynamics 365 app is an add-in app for Power BI that allows you to connect to your Dynamics 365 Customer Service Instance. Power BI administrators can install the Omnichannel Insights for Dynamics 365 app from the Omnichannel Insights for Dynamics 365 app page.

Connect to Omnichannel Insights for Dynamics 365 app
After the application is installed, you're ready to connect to your Dynamics 365 Data. On the Omnichannel Insights for Dynamics 365 app configuration page, select Connect.

As you walk through the configuration, you need to provide the following information:
Your organization's CRM OData feed URL: You can find the URL by going to your Dynamic 365 Customer Service instance, and going to Settings > Customizations, then selecting Developer Resources. It's located under the Instance Web API.
Row Count Limit: Specifies the number of rows you want to pull in your query. The default is 500,000. Increasing the number may affect performance.
Months to query: Defines the number of months you want to include in the query.

You need to authenticate to your Dynamics 365 instance to get the access the data that displays in the report. You want to choose:
Authentication method = OAuth2
Privacy level = Organizational

Once you have successfully authenticated and logged in, the existing report is updated with the data from your organization.
Configure refresh frequency on Power BI dataset
After you connect the Dynamics 365 Omnichannel Insights app with a Dynamics 365 organization, you need to configure the refresh frequency on the Power BI dataset so reports and dashboards refresh properly. In the Omnichannel Insights app workspace, select the Datasets tab and select Settings. Set the Scheduled refresh to On. It's highly recommended that you set the refresh frequency to Daily.

Publish application within your organization
To ensure that supervisors and other individuals who use the reports have access to them, you must share the configured application with your entire organization for supervisors to view the Omnichannel Insights dashboards and reports with their own Power BI Pro accounts.
On the App workspace, select Update app to open the Update app wizard. Go to the Access tab, and select Entire organization.

Add Power BI Dashboards to Omnichannel for Customer Service
Once you have the dashboards created and shared with the organization, supervisors can access them in Dynamics 365. Each supervisor needs to configure their Power Platform environment to integrate the Omnichannel Insights and Omnichannel Sentiment Analysis dashboards. In the dashboards area, select New and then choose Power BI Dashboard. In the Add a Power BI Dashboard screen, configure as follows:
Set the Workspace field to Omnichannel Insights for Dynamics 365.
Set the Dashboard field to Omnichannel Insights for Dynamics 365.

To add the Omnichannel Insights - Sentiment Analysis dashboard, select New and Power BI dashboard again. Configure as follows:
Set the Workspace field to Omnichannel Insights for Dynamics 365.
Set the Dashboard field to Omnichannel Sentiment Analysis for Dynamics 365.

Customize Omnichannel Insights
The Omnichannel Insights template app is built with a set of entities and fields that are useful for most reporting scenarios. Dynamics 365 apps are often extended with custom fields. These custom fields don't automatically show up in the Power BI model. Based on your organizational needs, you can edit and extend the report included in the template app to include custom fields in the Power BI model.
For more information, see Customize Omnichannel Insights.