Query Performance Insight in Azure Database for MariaDB
Important
Azure Database for MariaDB is on the retirement path. We strongly recommend that you migrate to Azure Database for MySQL. For more information about migrating to Azure Database for MySQL, see What's happening to Azure Database for MariaDB?.
Applies to: Azure Database for MariaDB 10.2
Query Performance Insight helps you to quickly identify what your longest running queries are, how they change over time, and what waits are affecting them.
Common scenarios
Long running queries
- Identifying longest running queries in the past X hours
- Identifying top N queries that are waiting on resources
Wait statistics
- Understanding wait nature for a query
- Understanding trends for resource waits and where resource contention exists
Prerequisites
For Query Performance Insight to function, data must exist in the Query Store.
Viewing performance insights
The Query Performance Insight view in the Azure portal will surface visualizations on key information from Query Store.
In the portal page of your Azure Database for MariaDB server, select Query Performance Insight under the Intelligent Performance section of the menu bar.
Long running queries
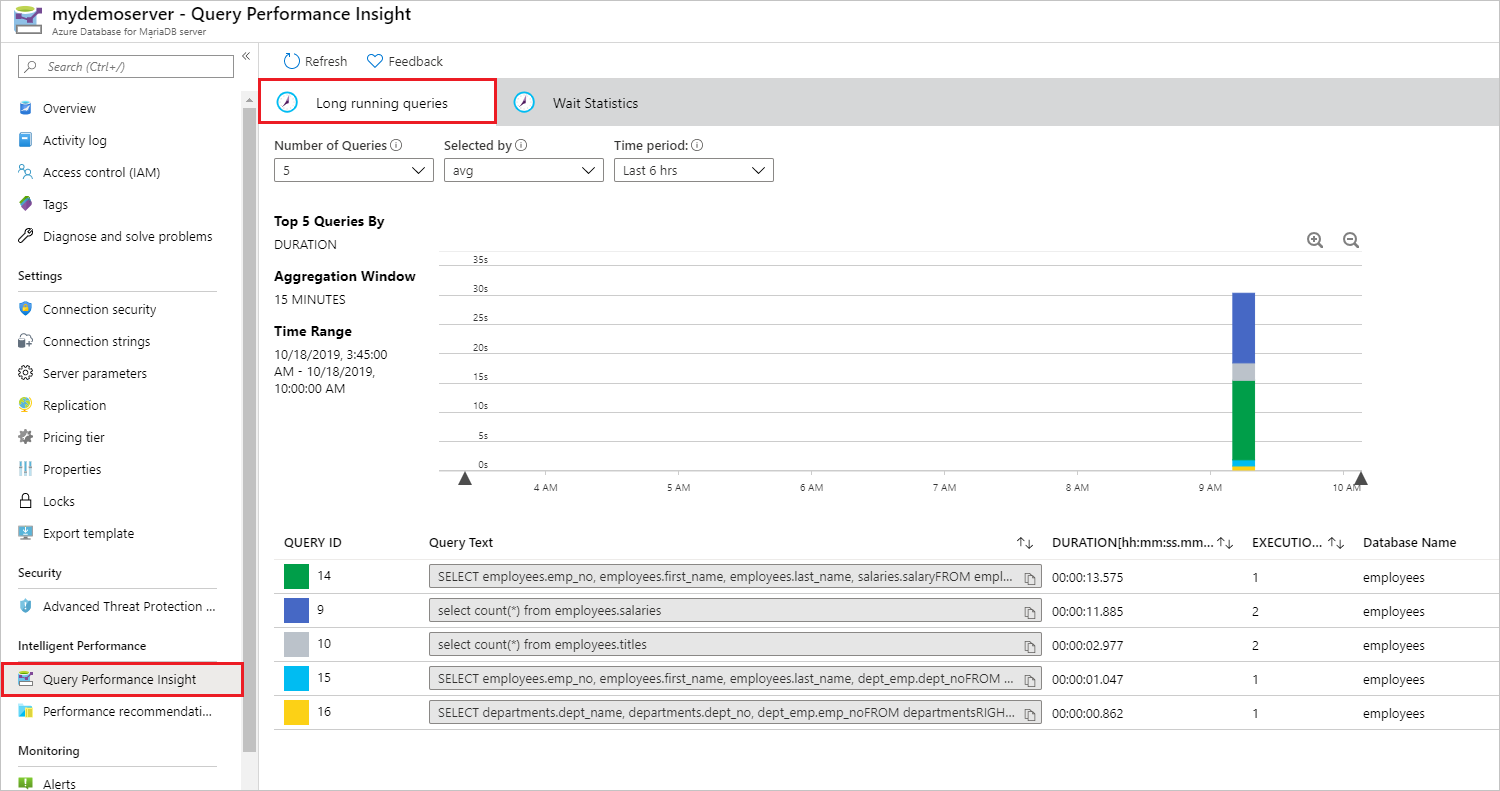
The Long running queries tab shows the top 5 queries by average duration per execution, aggregated in 15-minute intervals. You can view more queries by selecting from the Number of Queries drop down. The chart colors may change for a specific Query ID when you do this.
You can select and drag in the chart to narrow down to a specific time window. Alternatively, use the zoom in and out icons to view a smaller or larger time period respectively.

Wait statistics
Note
Wait statistics are meant for troubleshooting query performance issues. It is recommended to be turned on only for troubleshooting purposes.
If you receive the error message in the Azure portal "The issue encountered for 'Microsoft.DBforMariaDB'; cannot fulfill the request. If this issue continues or is unexpected, please contact support with this information." while viewing wait statistics, use a smaller time period.
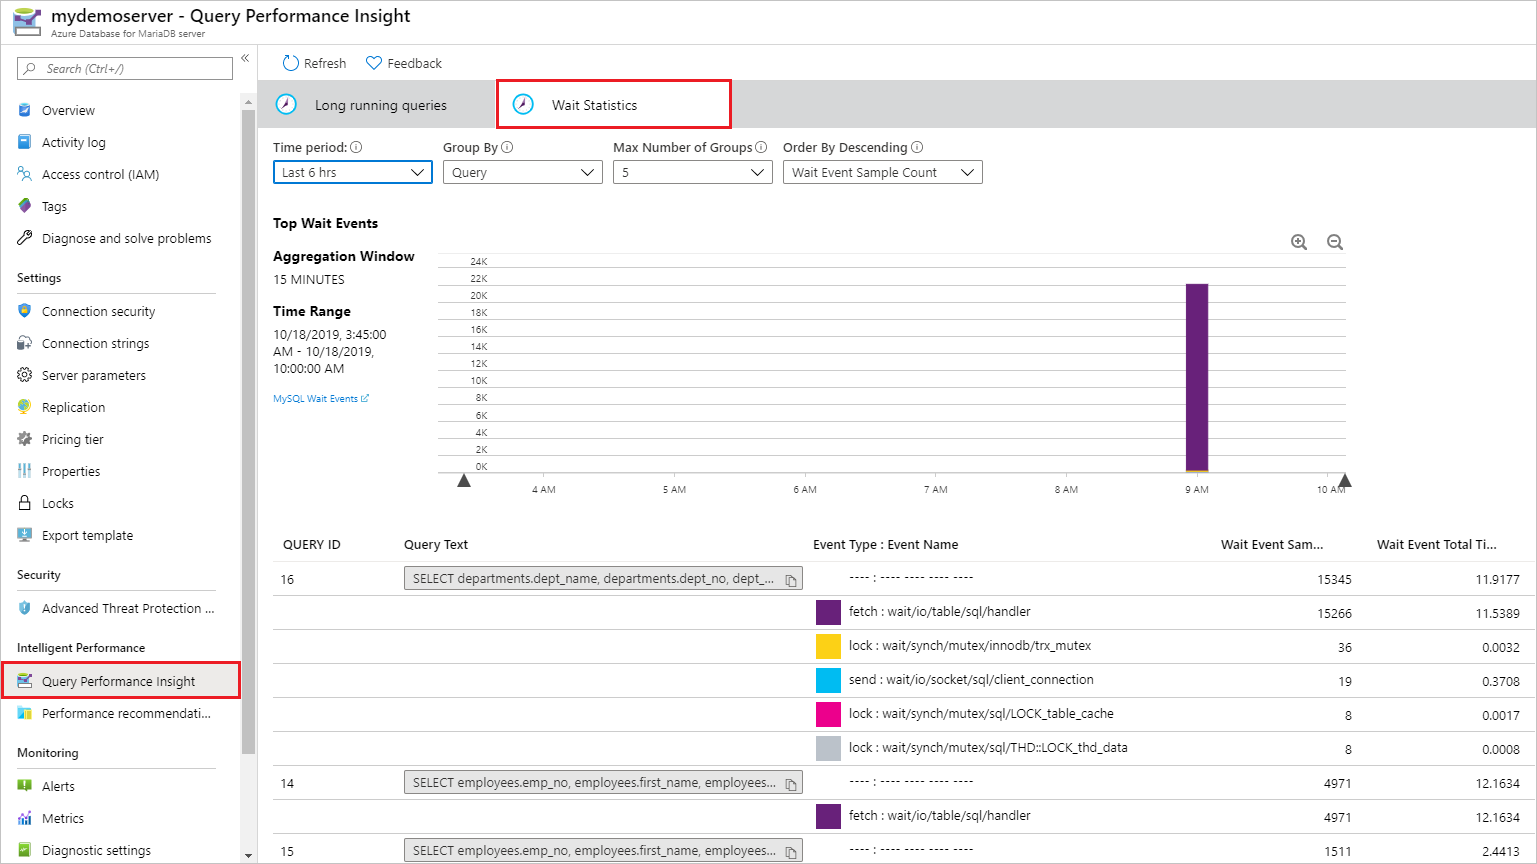
Wait statistics provides a view of the wait events that occur during the execution of a specific query. Learn more about the wait event types in the MySQL engine documentation.
Select the Wait Statistics tab to view the corresponding visualizations on waits in the server.
Queries displayed in the wait statistics view are grouped by the queries that exhibit the largest waits during the specified time interval.

Limitations
- Query performance insight is not supported for version 10.3
Next steps
- Learn more about monitoring and tuning in Azure Database for MariaDB.