Create entity relationship diagrams
Documentation can take many forms from requirements gathering and validation to test plans, training plans and user manuals. In this lesson we will learn about creating entity relationship diagrams (also known ERDs), wireframes and mockups for apps, documenting requirements and solution artifacts, and documenting details of data for migration and integration. In Power Platform, the data is represented as a table. For the purposes of this lesson, consider the terms interchangeable.
The entity relationship diagram
A data model is a visual model showing how data flows through your system and how different tables relate to each other. (We will learn more about tables and data models in the next module.) Data models define the relationship types between tables and abstract a database to a visual representation that is easy to understand. When you are planning and creating the diagram, do it in such a way to allow for the evolution of the project.
Before deciding what to include in your diagram, first you need to understand the audience. The amount of detail in a diagram destined for a summary meeting with executive stakeholders is much different than the amount of detail needed for an ERD on its way to the quality assurance team for test plan authoring.
Things to consider including in your ERD:
- Tables (system, custom, and virtual)
- Relationship types (1:N, N:1, N:N)
- Table mapping
- Column mapping
- Column type
- High-level integration architecture
Types of data models
Data models for Microsoft Power Platform data structures typically fall into two general categories: logical and physical.
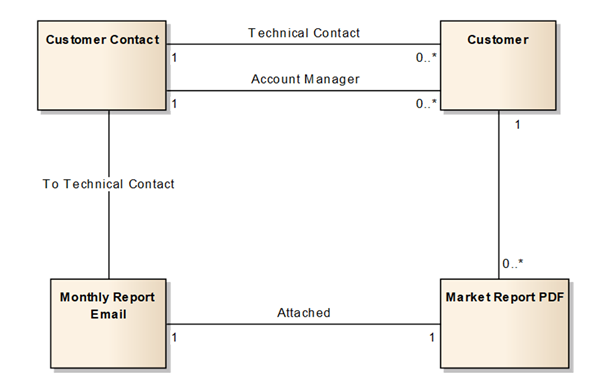
Logical data models
Logical data models are high-level diagrams that show the way that data flows through the system. These diagrams are frequently put together at the beginning of the project during discovery and before all of the columns have been defined. Generally, the logical data model diagram uses the business names of the tables, not the schema/database name.
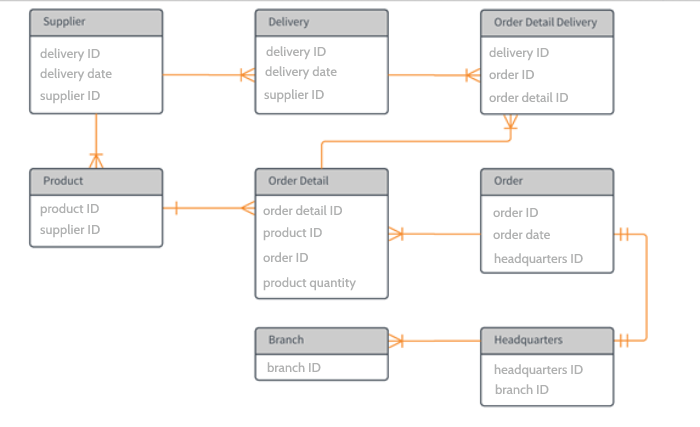
Physical data models
Physical data models are lower level than logical data models. They generally include column-level detail and more precisely designed relationships. The physical data model is created when the high-level logical design is translated to physical tables. A common type of physical data model is an Entity Relationship Diagram (ERD), or table relationship diagram.
Data modeling is a science, and there are data modeling professionals and established standards for data modeling. To be effective with Microsoft Power Platform data modeling, you don’t have to be a professional data modeler or use any special tools. Popular tools like Microsoft Visio can be used to quickly create a basic diagram that visualizes the relationships and flow of data between tables and so can casual planning with whiteboard drawings. In this section, we discuss some general best practices for data modeling for deployments.
- Data models should be updated continuously during a deployment. It’s common for a data model to be designed at the beginning of a project, but it is very important that it doesn’t stop there. As you go through the deployment, new columns and tables will be added - it’s important to capture these in the data model and make it a “living” data model. Recommend to customers that they continue to update it as they enhance the system.
- Don’t start from scratch. Community tools available with the XRM Toolbox (xrmtoolbox.com) make it easy to quickly generate ERD diagrams of your data configuration. These tools include the UML Generator and Entity Relationship Diagram Generator. After you complete configuration updates, generate an up-to-date diagram.
- Don’t include every table. Some core tables, such as activities, notes, and users (row or record owners) are related to nearly every table. If you include every relationship with these tables in your data model, the result will be unreadable. Best practice is to only include the primary tables leveraged in your configuration in your data model diagram and only include custom relationships with the user and activity tables to maximize readability.
- Data models should include tables outside of the Dataverse data model. If you are integrating with other systems via Dataverse data connectors or virtual tables, or if data flows outside of Dataverse via an integration, this data should also be represented in your data model diagram.
- Start simple, with the standard tables, then add custom table (entity) relationships to your data model.
- Start with what you need now but design the data model in a way that will support what you are going to be doing in the future. For example, if you know that down the road you will need to store additional details about sales territories, using a text column for territory now will make it more difficult to implement than if you use the territory table relationship. Plan for what is coming.