Note
Access to this page requires authorization. You can try signing in or changing directories.
Access to this page requires authorization. You can try changing directories.
Tip
Power BI Dataflow Gen1 is now in a legacy state and won't receive new feature investment. Rather than building a custom monitoring dashboard, Dataflow Gen2 provides built-in refresh tracking through the Monitoring hub in Microsoft Fabric, with real-time status, duration, and error details. To learn about upgrading existing dataflows, see Upgrade from Dataflow Gen1 to Dataflow Gen2.
Power BI dataflows enable you to connect to, transform, combine, and distribute data for downstream analytics. A key element in dataflows is the refresh process, which applies the transformation steps you authored in the dataflows and updates the data in the items themselves.
To understand run times, performance, and whether you're getting the most out of your dataflow, you can download the refresh history after you refresh a dataflow.
Understand refreshes
There are two types of refreshes applicable to dataflows:
Full, which performs a complete flush and reload of your data.
Incremental (Premium only), which processes a subset of your data based on time-based rules, expressed as a filter, that you configure. The filter on the date column dynamically partitions the data into ranges in the Power BI service. After you configure the incremental refresh, the dataflow automatically alters your query to include filtering by date. You can edit the automatically generated query by using the Advanced Editor in Power Query to fine-tune or customize your refresh. If you bring your own Azure Data Lake Storage, you can see time slices of your data based on the refresh policy you set.
Note
To learn more about incremental refresh and how it works, see Using incremental refresh with dataflows.
Incremental refresh enables large dataflows in Power BI with the following benefits:
Refreshes are faster after the first refresh, due to the following facts:
- Power BI refreshes the last N partitions specified by the user (where partition is day/week/month, and so on), or
- Power BI refreshes only data that needs to be refreshed. For example, refreshing only the last five days of a 10-year semantic model.
- Power BI only refreshes data that has changed, as long as you specify the column you want to check for changes.
Refreshes are more reliable - it's no longer necessary to maintain long-running connections to volatile source systems.
Resource consumption is reduced - less data to refresh reduces overall consumption of memory and other resources.
Wherever possible, Power BI employs parallel processing on partitions, which can lead to faster refreshes.
In any of these refresh scenarios, if a refresh fails, the data doesn't update. Your data might be stale until the latest refresh completes, or you can refresh it manually and it can then complete without error. Refresh occurs at a partition or entity, so if an incremental refresh fails, or an entity has an error, then the entire refresh transaction doesn't occur. Said another way, if a partition (incremental refresh policy) or entity fails for a dataflow, the entire refresh operation fails, and no data gets updated.
Understand and optimize refreshes
To better understand how a dataflow refresh operation performs, review the Refresh History for the dataflow by navigating to one of your dataflows. Select More options (...) for the dataflow. Then choose Settings > Refresh history. You can also select the dataflow in the Workspace. Then choose More options (…) > Refresh History.
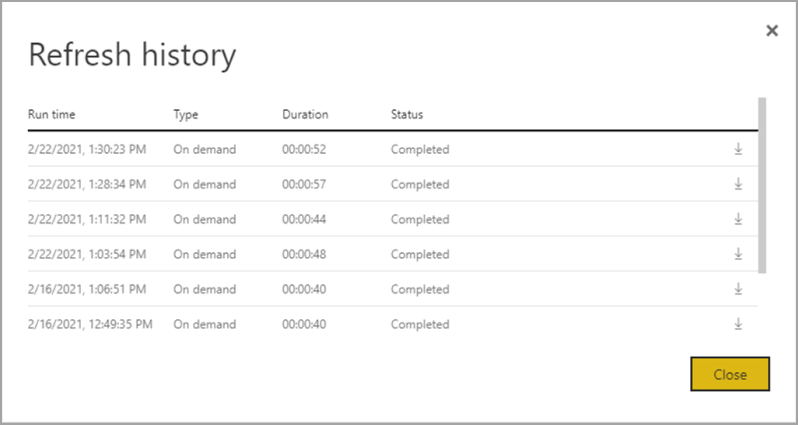
The Refresh History provides an overview of refreshes, including the type – on demand or scheduled, the duration, and the run status. To see details in the form of a CSV file, select the download icon on the far right of the refresh description's row. The downloaded CSV includes the attributes described in the following table. Premium refreshes provide more information based on the extra compute and dataflows capabilities, versus Pro based dataflows that reside on shared capacity. As such, some of the following metrics are available only in Premium.
| Item | Description | Pro | Premium |
|---|---|---|---|
| Requested on | Time refresh was scheduled or refresh now was clicked, in local time. | ✔ | ✔ |
| Dataflow name | Name of your Dataflow. | ✔ | ✔ |
| Dataflow refresh status | Completed, Failed, or Skipped (for an entity) are possible statuses. Use cases like Linked Entities are reasons why one might see skipped. | ✔ | ✔ |
| Entity name | Table name. | ✔ | ✔ |
| Partition name | This item is dependent on if the dataflow is premium or not, and if Pro shows as NA because it doesn't support incremental refreshes. Premium shows either FullRefreshPolicyPartition or IncrementalRefreshPolicyPartition-[DateRange]. | ✔ | |
| Refresh status | Refresh status of the individual entity or partition, which provides status for that time slice of data being refreshed. | ✔ | ✔ |
| Start time | In Premium, this item is the time the dataflow was queued up for processing for the entity or partition. This time can differ if dataflows have dependencies and need to wait for the result set of an upstream dataflow to begin processing. | ✔ | ✔ |
| End time | End time is the time the dataflow entity or partition completed, if applicable. | ✔ | ✔ |
| Duration | Total elapsed time for the dataflow to refresh expressed in HH:MM:SS. | ✔ | ✔ |
| Rows processed | For a given entity or partition, the number of rows scanned or written by the dataflows engine. This item might not always contain data based on the operation you performed. Data might be omitted when the compute engine isn't used, or when you use a gateway as the data is processed there. | ✔ | |
| Bytes processed | For a given entity or partition, Data written by the dataflows engine, expressed in bytes. When using a gateway on this particular dataflow, this information isn't provided. |
✔ | |
| Max commit (KB) | Max Commit is the peak commit memory useful for diagnosing out-of-memory failures when the M query isn't optimized. When you use a gateway on this particular dataflow, this information isn't provided. |
✔ | |
| Processor Time | For a given entity or partition, time, expressed in HH:MM:SS that the dataflows engine spent performing transformations. When you use a gateway on this particular dataflow, this information isn't provided. |
✔ | |
| Wait time | For a given entity or partition, the time that an entity spent in wait status, based on workload on the Premium capacity. | ✔ | |
| Compute engine | For a given entity or partition, details on how the refresh operation uses the compute engine. The values are: - NA - Folded - Cached - Cached + Folded These elements are described in more detail later in this article. |
✔ | |
| Error | If applicable, the detailed error message is described per entity or partition. | ✔ | ✔ |
Dataflow refresh guidance
The refresh statistics provide valuable information you can use to optimize and speed up performance of your dataflows. In the following sections, we describe some scenarios, what to watch out for, and how to optimize based on the information provided.
Orchestration
Using dataflows in the same workspace allows straightforward orchestration. As an example, you might have dataflows A, B and C in a single workspace, and chaining like A > B > C. If you refresh the source (A), the downstream entities also get refreshed. However, if you refresh C, then you have to refresh others independently. Also, if you add a new data source in dataflow B (which isn't included in A) that data isn't refreshed as a part of orchestration.
You might want to chain items together that don't fit the managed orchestration Power BI performs. In these scenarios, you can use the APIs and/or use Power Automate. You can refer to the API documentation and the PowerShell script for programmatic refresh. There's a Power Automate connector that enables doing this procedure without writing any code. You can see detailed samples, with specific walk-throughs for sequential refreshes.
Monitoring
Using the enhanced refresh statistics described earlier in this article, you can get detailed per-dataflow refresh information. But if you would like to see dataflows with tenant-wide or workspace-wide overview of refreshes, perhaps to build a monitoring dashboard, you can use the APIs or Power Automate templates. Similarly, for use cases such as sending simple or complex notifications, you can use the Power Automate connector or build your own custom application by using the APIs.
Timeout errors
Optimizing the time it takes to perform extract, transform, and load (ETL) scenarios is ideal. In Power BI, the following cases apply:
- Some connectors have explicit timeout settings you can configure. For more information, see Connectors in Power Query.
- Power BI dataflows, using Power BI Pro, can also experience timeouts for long running queries within an entity or dataflows themselves. That limitation doesn't exist in Power BI Premium workspaces.
Timeout guidance
Timeout thresholds for Power BI Pro dataflows are:
- Two hours at the individual entity level.
- Three hours at the entire dataflow level.
For example, if you have a dataflow with three tables, no individual table can take more than two hours and the entire dataflow times out if the duration exceeds three hours.
If you're experiencing timeouts, consider optimizing your dataflow queries, and consider using query folding on your source systems.
Separately, consider upgrading to Premium Per User, which isn't subject to these time-outs and offers increased performance due to many Power BI Premium Per User features.
Long durations
Complex or large dataflows can take more time to refresh, as can poorly optimized dataflows. The following sections provide guidance on how to mitigate long refresh durations.
Guidance for long refresh durations
The first step to improve long refresh durations for dataflows is to build dataflows according to the best practices. Notable patterns include:
- Use linked entities for data that can be used later in other transformations.
- Use computed entities to cache data, reducing data loading and data ingestion burden on source systems.
- Split data into staging dataflows and transformation dataflows, separating the ETL into different dataflows.
- Optimize expanding table operations.
- Follow guidance for complex dataflows.
Next, it can help to evaluate whether you can use incremental refresh.
Using incremental refresh can improve performance. It's important that the partition filters are pushed to the source system when queries are submitted for refresh operations. To push filtering down means the data source should support query folding, or you can express business logic through a function or other means that can help Power Query eliminate and filter files or folders. Most data sources that support SQL queries support query folding, and some OData feeds can also support filtering.
However, data sources like flat files, blobs, and APIs typically don't support filtering. In cases where the data source back-end doesn't support the filter, it can't be pushed down. In such cases, the mash-up engine compensates and applies the filter locally, which might require retrieving the full semantic model from the data source. This operation can cause incremental refresh to be slow, and the process can run out of resources either in the Power BI service or in the on-premises data gateway, if used.
Given the various levels of query folding support for each data source, you should perform verification to ensure the filter logic is included in the source queries. To make this easier, Power BI attempts to perform this verification for you, with step folding indicators for Power Query Online. Many of these optimizations are design-time experiences, but after a refresh occurs, you have an opportunity to analyze and optimize your refresh performance.
Finally, consider optimizing your environment. You can optimize the Power BI environment by scaling up your capacity, right-sizing data gateways, and reducing network latency with the following optimizations:
When using capacities available with Power BI Premium or Premium Per User, you can increase performance by increasing your Premium instance, or assigning the content to a different capacity.
A gateway is required whenever Power BI needs to access data that isn't available directly over the Internet. You can install the on-premises data gateway on an on-premises server, or on a virtual machine.
- To understand gateway workloads and sizing recommendations, see On-premises data gateway sizing.
- Also evaluate bringing the data first into a staging dataflow, and referencing it downstream by using linked and computed entities.
Network latency can affect refresh performance by increasing the time required for requests to reach the Power BI service, and for responses to be delivered. Tenants in Power BI are assigned to a specific region. To determine where your tenant is located, see Find the default region for your organization. When users from a tenant access the Power BI service, their requests always route to that region. As requests reach the Power BI service, the service might then send extra requests, for example, to the underlying data source, or a data gateway—which are also subject to network latency.
- Tools such as Azure Speed Test provide an indication of network latency between the client and the Azure region. In general, to minimize the impact of network latency, strive to keep data sources, gateways, and your Power BI cluster as close as possible. Residing in the same region is preferable. If network latency is an issue, try locating gateways and data sources closer to your Power BI cluster by placing them inside cloud-hosted virtual machines.
High processor time
If you see high processor time, you likely have expensive transformations that aren't being folded. The high processor time is either because of the number of applied steps you have, or the type of transformations you're making. Each of these possibilities can result in higher refresh times.
Guidance for high processor time
There are two options for optimizing high processor time.
First, use query folding within the data source itself, which should reduce the load on the dataflow compute engine directly. Query folding within the data source allows the source system to do most of the work. The dataflow can then pass through queries in the native language of the source, rather than having to perform all the computations in memory after the initial query.
Not all data sources can perform query folding, and even when query folding is possible, some dataflows perform certain transformations that can't fold to the source. In such cases, the enhanced compute engine is a capability introduced by Power BI to potentially improve performance by up to 25 times, for transformations specifically.
Use the compute engine to maximize performance
While Power Query has design-time visibility into query folding, the compute engine column provides details about whether the internal engine itself is used. The compute engine is helpful when you have a complex dataflow and you're performing transformations in memory. This situation is where the enhanced refresh statistics can be helpful, since the compute engine column provides details about whether or not the engine itself was used.
The following sections provide guidance about using the compute engine, and its statistics.
Warning
During design time the folding indicator in the editor might show that the query doesn't fold when consuming data from another dataflow. Check the source dataflow if enhanced compute is enabled to ensure folding on the source dataflow is enabled.
Guidance on compute engine Statuses
Turning on the enhanced compute engine and understanding the various statuses is helpful. Internally, the enhanced compute engine uses a SQL database to read and store data. It's best to have your transformations execute against the query engine here. The following paragraphs provide various situations, and guidance about what to do for each.
NA - This status means that the compute engine wasn't used, either because:
- You're using Power BI Pro dataflows.
- You explicitly turned off the compute engine.
- You're using query folding on the data source.
- You're performing complex transformations that can't make use of the SQL engine used to speed up queries.
If you're experiencing long durations and still get a status of NA, make sure that it's turned on and not accidentally turned off. One recommended pattern is to use staging dataflows to initially get your data into the Power BI service, then build dataflows on top of this data, after it is in a staging dataflow. That pattern can reduce load on source systems and, together with the compute engine, provide a speed boost for transformations and improve performance.
Cached - If you see the cached status, the dataflow data was stored in the compute engine and available to be referenced as part of another query. This situation is ideal if you're using it as a linked entity, because the compute engine caches that data for use downstream. The cached data doesn't need to be refreshed multiple times in the same dataflow. This situation is also potentially ideal if you want to use it for DirectQuery.
When cached, the performance impact on initial ingestion pays off later, in the same dataflow or in a different dataflow in the same workspace.
If you have a large duration for the entity, consider turning off the compute engine. To cache the entity, Power BI writes it to storage and to SQL. If it's a single-use entity, the performance benefit for users might not be worth the penalty of the double-ingestion.
Folded - Folded means that the dataflow was able to use SQL compute to read data. The calculated entity used the table from SQL to read data, and the SQL used is related to the constructs of their query.
Folded status appears if, when you're using on-premises or cloud data sources, you first loaded data into a staging dataflow and referenced that in this dataflow. This status applies only to entities that reference another entity. It means your queries were run on top of the SQL engine, and they have the potential to be improved with SQL compute. To ensure the SQL engine processes your transformations, use transformations that support SQL folding, such as merge (join), group by (aggregation), and append (union) actions in the Query Editor.
Cached + Folded - When you see cached + folded, it's likely that the data refresh is optimized, as you have an entity that both references another entity and is referred to by another entity upstream. This operation also runs on top of the SQL and, as such, also has the potential for improvement with SQL compute. To be sure you're getting the best performance possible, use transformations that support SQL folding, like merge (join), group by (aggregation), and append (union) actions in the Query Editor.
Guidance for compute engine performance optimization
The following steps enable workloads to trigger the compute engine, and thereby, always improve performance.
Computed and linked entities in the same workspace:
For ingestion, focus on getting the data into the storage as fast as possible, use filters only if they reduce the overall semantic model size. Keep your transformation logic separate from this step. Next, separate your transformation and business logic into a separate dataflow in the same workspace. Use linked or computed entities. Doing so allows for the engine to activate and accelerate your computations. For a simple analogy, it's like food preparation in a kitchen: food preparation is typically a separate and distinct step from gathering your raw ingredients, and a pre-requisite for putting the food in the oven. Similarly, you need to prepare your logic separately before it can take advantage of the compute engine.
Ensure you perform the operations that fold, such as merges, joins, conversion, and others.
Also, build dataflows within published guidelines and limitations.
When the compute engine is on, but performance is slow:
Take the following steps when investigating scenarios where the compute engine is on, but you're seeing poor performance:
- Limit computed and linked entities that exist across the workspace.
- If your initial refresh is with the compute engine turned on, data gets written in the lake and in the cache. This double-write results in refreshes being slower.
- If you have a dataflow linking to multiple dataflows, make sure you schedule refreshes of the source dataflows so that they don't all refresh at the same time.
Considerations and limitations
- A Power BI Pro license has a dataflows refresh limit of 8 refreshes per day.
- If at least one query of a dataflow is configured to use a gateway, then all queries of this dataflow will use that gateway for data movement.