series_fit_poly_fl()
A função series_fit_poly_fl() é uma função definida pelo usuário (UDF) que aplica uma regressão polinomial em uma série. Esta função pega uma tabela contendo séries múltiplas (matrizes numéricas dinâmicas) e gera o melhor ajuste polinomial de alta ordem para cada série usando regressão polinomial. Essa função retorna os coeficientes polinomiais e o polinômio interpolado ao longo do intervalo da série.
Observação
- Use a função nativa series_fit_poly() em vez da função descrita neste documento. A função nativa fornece a mesma funcionalidade e é melhor para desempenho e escalabilidade. Este documento é fornecido apenas para fins de referência.
- Para regressão linear de uma série espaçada uniformemente, como criada pelo operador make-series, use a função nativa series_fit_line().
Pré-requisitos
- O plugin Python deve estar habilitado no cluster. Isso é necessário para o Python embutido usado na função.
- O plugin Python deve estar habilitado no banco de dados. Isso é necessário para o Python embutido usado na função.
Sintaxe
T | invoke series_fit_poly_fl(, y_series y_fit_series, grau, fit_coeff ,[ x_series ], [ x_istime ])
Saiba mais sobre as convenções de sintaxe.
Parâmetros
| Nome | Digitar | Obrigatória | Descrição |
|---|---|---|---|
| y_series | string |
✔️ | O nome da coluna da tabela de entrada que contém a variável dependente. Ou seja, a série para encaixar. |
| y_fit_series | string |
✔️ | O nome da coluna para armazenar a série mais adequada. |
| fit_coeff | string |
✔️ | O nome da coluna para armazenar os coeficientes polinomiais de melhor ajuste. |
| grau | int |
✔️ | A ordem necessária do polinômio para se encaixar. Por exemplo, 1 para regressão linear, 2 para regressão quadrática e assim por diante. |
| x_series | string |
O nome da coluna que contém a variável independente, ou seja, o eixo x ou tempo. Esse parâmetro é opcional e é necessário apenas para séries com espaçamento desigual. O valor padrão é uma cadeia de caracteres vazia, pois x é redundante para a regressão de uma série espaçada uniformemente. | |
| x_istime | bool |
Esse parâmetro é necessário somente se x_series for especificado e for um vetor de datetime. |
Definição de função
Você pode definir a função incorporando seu código como uma função definida por consulta ou criando-a como uma função armazenada em seu banco de dados, da seguinte maneira:
Defina a função usando a instrução let a seguir. Nenhuma permissão é necessária.
Importante
Uma instrução let não pode ser executada sozinha. Ele deve ser seguido por uma instrução de expressão tabular. Para executar um exemplo funcional do series_fit_poly_fl(), consulte Exemplos.
let series_fit_poly_fl=(tbl:(*), y_series:string, y_fit_series:string, fit_coeff:string, degree:int, x_series:string='', x_istime:bool=False)
{
    let kwargs = bag_pack('y_series', y_series, 'y_fit_series', y_fit_series, 'fit_coeff', fit_coeff, 'degree', degree, 'x_series', x_series, 'x_istime', x_istime);
    let code = ```if 1:
        y_series = kargs["y_series"]
        y_fit_series = kargs["y_fit_series"]
        fit_coeff = kargs["fit_coeff"]
        degree = kargs["degree"]
        x_series = kargs["x_series"]
        x_istime = kargs["x_istime"]

        def fit(ts_row, x_col, y_col, deg):
            y = ts_row[y_col]
            if x_col == "": # If there is no x column creates sequential range [1, len(y)]
               x = np.arange(len(y)) + 1
            else: # if x column exists check whether its a time column. If so, normalize it to the [1, len(y)] range, else take it as is.
               if x_istime:
                   x = pd.to_numeric(pd.to_datetime(ts_row[x_col]))
                   x = x - x.min()
                   x = x / x.max()
                   x = x * (len(x) - 1) + 1
               else:
                   x = ts_row[x_col]
            coeff = np.polyfit(x, y, deg)
            p = np.poly1d(coeff)
            z = p(x)
            return z, coeff

        result = df
        if len(df):
           result[[y_fit_series, fit_coeff]] = df.apply(fit, axis=1, args=(x_series, y_series, degree,), result_type="expand")
    ```;
    tbl
     | evaluate python(typeof(*), code, kwargs)
};
// Write your query to use the function here.
Exemplos
Os exemplos a seguir usam o operador invoke para executar a função.
Ajustar o polinômio de quinta ordem a uma série temporal regular
Para usar uma função definida por consulta, invoque-a após a definição da função incorporada.
let series_fit_poly_fl=(tbl:(*), y_series:string, y_fit_series:string, fit_coeff:string, degree:int, x_series:string='', x_istime:bool=False)
{
let kwargs = bag_pack('y_series', y_series, 'y_fit_series', y_fit_series, 'fit_coeff', fit_coeff, 'degree', degree, 'x_series', x_series, 'x_istime', x_istime);
let code = ```if 1:
y_series = kargs["y_series"]
y_fit_series = kargs["y_fit_series"]
fit_coeff = kargs["fit_coeff"]
degree = kargs["degree"]
x_series = kargs["x_series"]
x_istime = kargs["x_istime"]
def fit(ts_row, x_col, y_col, deg):
y = ts_row[y_col]
if x_col == "": # If there is no x column creates sequential range [1, len(y)]
x = np.arange(len(y)) + 1
else: # if x column exists check whether its a time column. If so, normalize it to the [1, len(y)] range, else take it as is.
if x_istime:
x = pd.to_numeric(pd.to_datetime(ts_row[x_col]))
x = x - x.min()
x = x / x.max()
x = x * (len(x) - 1) + 1
else:
x = ts_row[x_col]
coeff = np.polyfit(x, y, deg)
p = np.poly1d(coeff)
z = p(x)
return z, coeff
result = df
if len(df):
result[[y_fit_series, fit_coeff]] = df.apply(fit, axis=1, args=(x_series, y_series, degree,), result_type="expand")
```;
tbl
| evaluate python(typeof(*), code, kwargs)
};
//
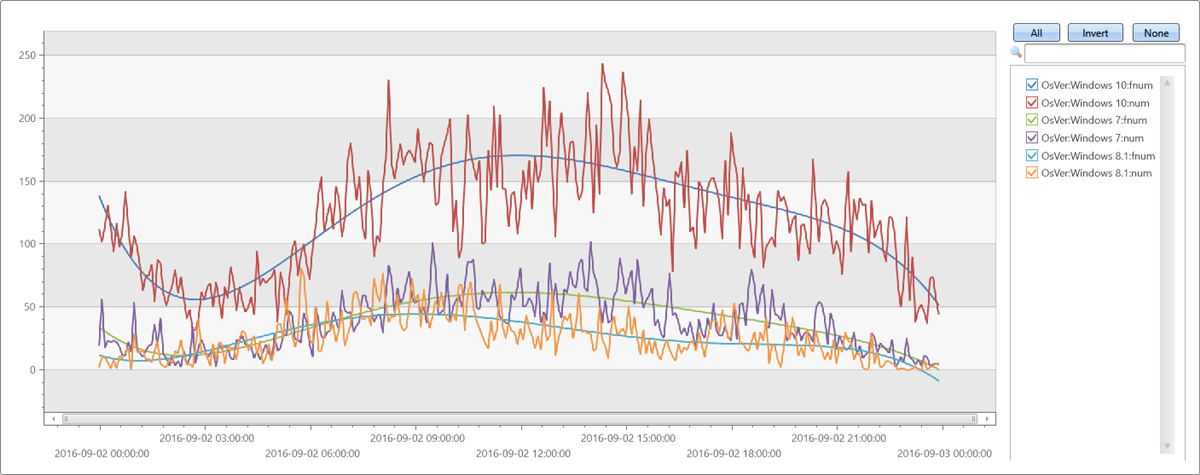
// Fit fifth order polynomial to a regular (evenly spaced) time series, created with make-series
//
let max_t = datetime(2016-09-03);
demo_make_series1
| make-series num=count() on TimeStamp from max_t-1d to max_t step 5m by OsVer
| extend fnum = dynamic(null), coeff=dynamic(null), fnum1 = dynamic(null), coeff1=dynamic(null)
| invoke series_fit_poly_fl('num', 'fnum', 'coeff', 5)
| render timechart with(ycolumns=num, fnum)
Saída
Testar séries temporais irregulares
Para usar uma função definida por consulta, invoque-a após a definição da função incorporada.
let series_fit_poly_fl=(tbl:(*), y_series:string, y_fit_series:string, fit_coeff:string, degree:int, x_series:string='', x_istime:bool=False)
{
let kwargs = bag_pack('y_series', y_series, 'y_fit_series', y_fit_series, 'fit_coeff', fit_coeff, 'degree', degree, 'x_series', x_series, 'x_istime', x_istime);
let code = ```if 1:
y_series = kargs["y_series"]
y_fit_series = kargs["y_fit_series"]
fit_coeff = kargs["fit_coeff"]
degree = kargs["degree"]
x_series = kargs["x_series"]
x_istime = kargs["x_istime"]
def fit(ts_row, x_col, y_col, deg):
y = ts_row[y_col]
if x_col == "": # If there is no x column creates sequential range [1, len(y)]
x = np.arange(len(y)) + 1
else: # if x column exists check whether its a time column. If so, normalize it to the [1, len(y)] range, else take it as is.
if x_istime:
x = pd.to_numeric(pd.to_datetime(ts_row[x_col]))
x = x - x.min()
x = x / x.max()
x = x * (len(x) - 1) + 1
else:
x = ts_row[x_col]
coeff = np.polyfit(x, y, deg)
p = np.poly1d(coeff)
z = p(x)
return z, coeff
result = df
if len(df):
result[[y_fit_series, fit_coeff]] = df.apply(fit, axis=1, args=(x_series, y_series, degree,), result_type="expand")
```;
tbl
| evaluate python(typeof(*), code, kwargs)
};
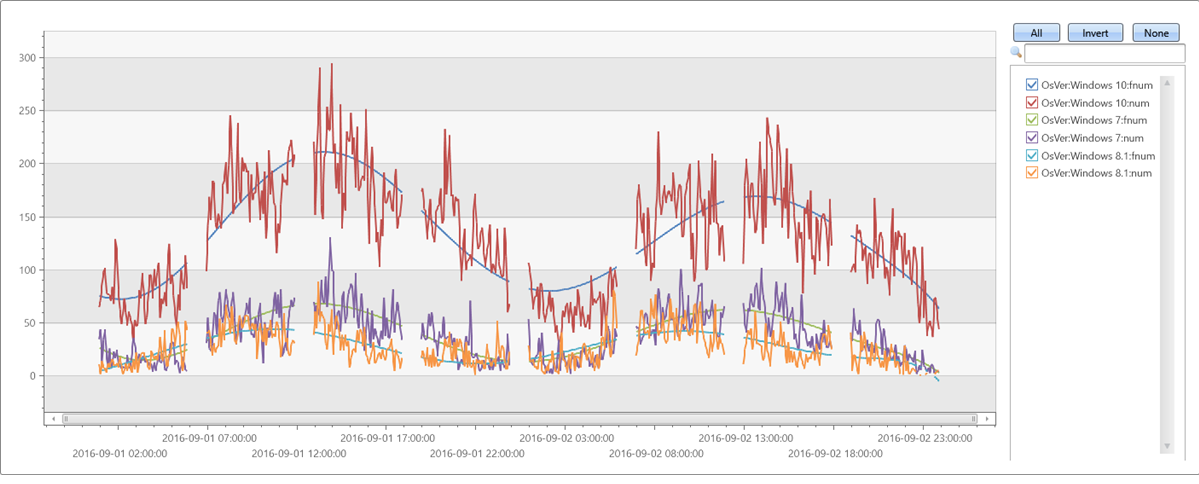
let max_t = datetime(2016-09-03);
demo_make_series1
| where TimeStamp between ((max_t-2d)..max_t)
| summarize num=count() by bin(TimeStamp, 5m), OsVer
| order by TimeStamp asc
| where hourofday(TimeStamp) % 6 != 0 // delete every 6th hour to create unevenly spaced time series
| summarize TimeStamp=make_list(TimeStamp), num=make_list(num) by OsVer
| extend fnum = dynamic(null), coeff=dynamic(null)
| invoke series_fit_poly_fl('num', 'fnum', 'coeff', 8, 'TimeStamp', True)
| render timechart with(ycolumns=num, fnum)
Saída
Polinômio de quinta ordem com ruído nos eixos x & y
Para usar uma função definida por consulta, invoque-a após a definição da função incorporada.
let series_fit_poly_fl=(tbl:(*), y_series:string, y_fit_series:string, fit_coeff:string, degree:int, x_series:string='', x_istime:bool=False)
{
let kwargs = bag_pack('y_series', y_series, 'y_fit_series', y_fit_series, 'fit_coeff', fit_coeff, 'degree', degree, 'x_series', x_series, 'x_istime', x_istime);
let code = ```if 1:
y_series = kargs["y_series"]
y_fit_series = kargs["y_fit_series"]
fit_coeff = kargs["fit_coeff"]
degree = kargs["degree"]
x_series = kargs["x_series"]
x_istime = kargs["x_istime"]
def fit(ts_row, x_col, y_col, deg):
y = ts_row[y_col]
if x_col == "": # If there is no x column creates sequential range [1, len(y)]
x = np.arange(len(y)) + 1
else: # if x column exists check whether its a time column. If so, normalize it to the [1, len(y)] range, else take it as is.
if x_istime:
x = pd.to_numeric(pd.to_datetime(ts_row[x_col]))
x = x - x.min()
x = x / x.max()
x = x * (len(x) - 1) + 1
else:
x = ts_row[x_col]
coeff = np.polyfit(x, y, deg)
p = np.poly1d(coeff)
z = p(x)
return z, coeff
result = df
if len(df):
result[[y_fit_series, fit_coeff]] = df.apply(fit, axis=1, args=(x_series, y_series, degree,), result_type="expand")
```;
tbl
| evaluate python(typeof(*), code, kwargs)
};
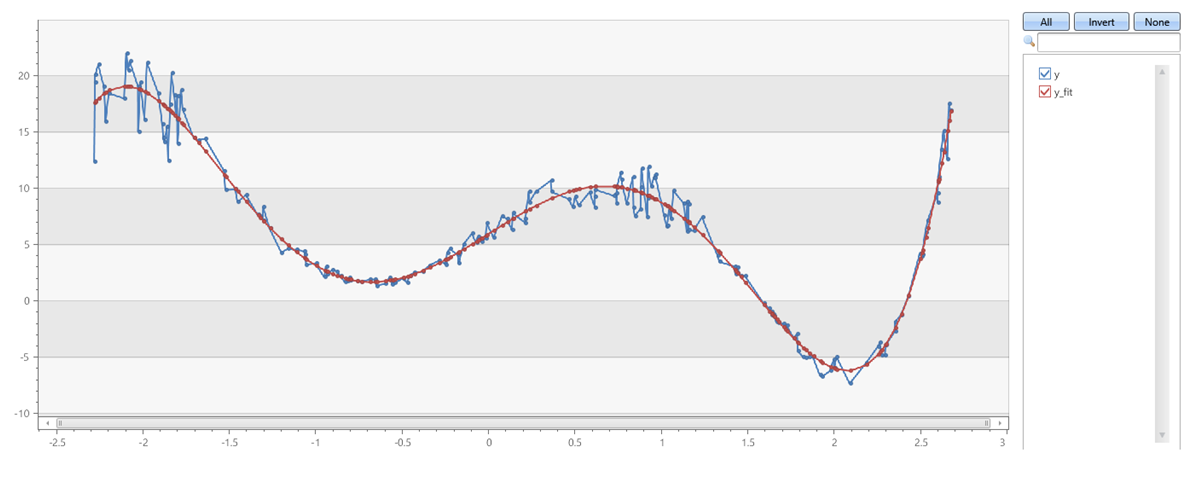
range x from 1 to 200 step 1
| project x = rand()*5 - 2.3
| extend y = pow(x, 5)-8*pow(x, 3)+10*x+6
| extend y = y + (rand() - 0.5)*0.5*y
| summarize x=make_list(x), y=make_list(y)
| extend y_fit = dynamic(null), coeff=dynamic(null)
| invoke series_fit_poly_fl('y', 'y_fit', 'coeff', 5, 'x')
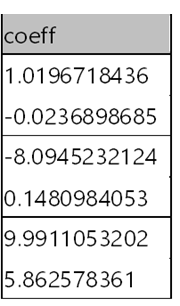
|fork (project-away coeff) (project coeff | mv-expand coeff)
| render linechart
Saída
Não há suporte para esse recurso.
Comentários
Em breve: Ao longo de 2024, eliminaremos os problemas do GitHub como o mecanismo de comentários para conteúdo e o substituiremos por um novo sistema de comentários. Para obter mais informações, consulte https://aka.ms/ContentUserFeedback.
Enviar e exibir comentários de