Observação
O acesso a essa página exige autorização. Você pode tentar entrar ou alterar diretórios.
O acesso a essa página exige autorização. Você pode tentar alterar os diretórios.
Aplica-se a: Aplicativos Lógicos do Azure (Standard)
Este guia mostra como criar localmente um exemplo de fluxo de trabalho do aplicativo lógico Standard que você pode executar nos Aplicativos Lógicos do Azure de locatário único ao usar o Visual Studio Code com a extensão aplicativos lógicos do Azure (Standard).
Neste guia, você cria um workspace e um projeto de aplicativo lógico Standard, desenvolve seu fluxo de trabalho e implanta seu projeto como um recurso de aplicativo lógico Standard no Azure, onde seu fluxo de trabalho pode ser executado em Aplicativos Lógicos do Azure de locatário único ou no Ambiente do Serviço de Aplicativo v3 (somente em planos do Serviço de Aplicativo baseados em Windows). Você também pode implantar e executar seu fluxo de trabalho em qualquer lugar que o Kubernetes possa executar, como o Azure, o Serviço de Kubernetes do Azure, localmente ou até mesmo outros provedores de nuvem, devido ao runtime em contêineres dos Aplicativos Lógicos do Azure (Standard).
Aqui estão apenas alguns benefícios que os aplicativos lógicos Standard fornecem:
Você pode criar, depurar, executar e testar fluxos de trabalho localmente no ambiente de desenvolvimento do Visual Studio Code local. O portal do Azure e o Visual Studio Code fornecem a capacidade de criar, executar e implantar recursos e fluxos de trabalho do aplicativo lógico Standard. No entanto, com o Visual Studio Code, você pode executar essas tarefas localmente.
Seu projeto de aplicativo lógico Standard pode incluir fluxos de trabalho com estado e sem estado.
Os fluxos de trabalho no mesmo recurso de aplicativo lógico Standard e no locatário são executados no mesmo processo que o runtime dos Aplicativos Lógicos do Azure (Standard), para que compartilhem os mesmos recursos e forneçam melhor desempenho.
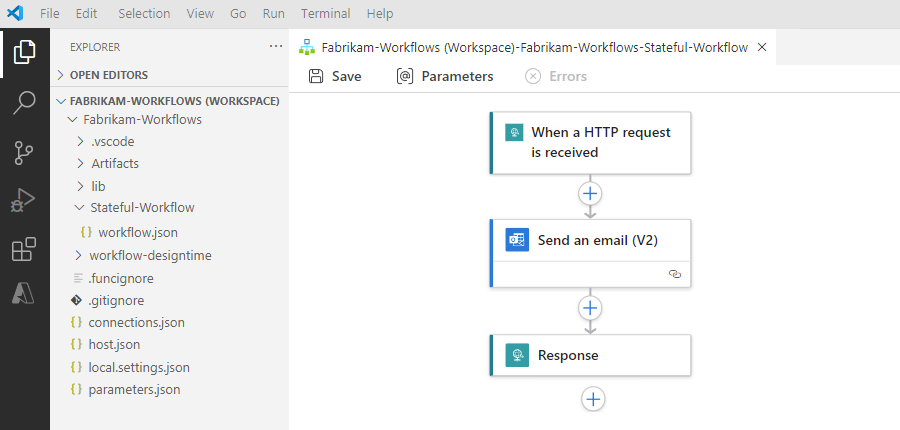
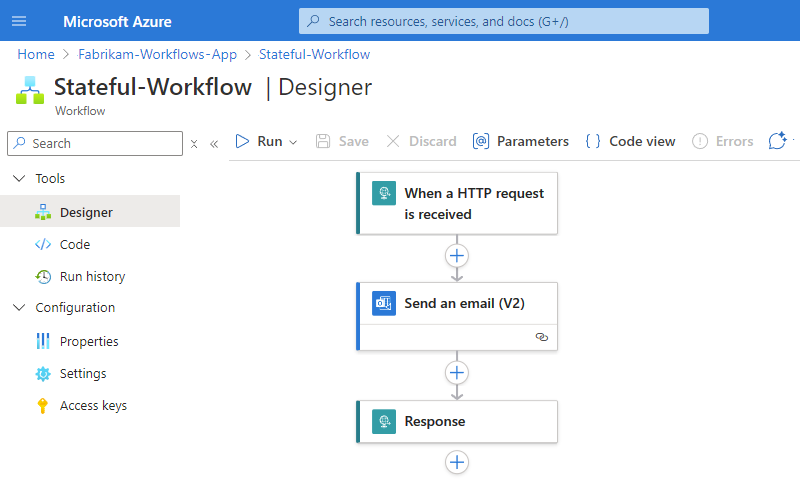
O fluxo de trabalho de exemplo deste guia começa inicialmente com um gatilho de solicitação seguido por uma ação do Outlook do Office 365 . O gatilho Solicitação cria um ponto de extremidade resgatável para o fluxo de trabalho e aguarda uma solicitação HTTPS de entrada de qualquer chamador. Quando o gatilho recebe uma solicitação e é acionado, a próxima ação é executada enviando emails para o destinatário especificado, juntamente com as saídas de gatilho selecionadas. Posteriormente, você pode adicionar uma ação de resposta que retorna uma resposta e dados processados ao chamador.
Embora o exemplo deste guia seja baseado em nuvem e tenha apenas algumas etapas, você pode criar fluxos de trabalho usando operações de mais de 1.400 conectores que ajudam a integrar uma ampla gama de serviços, sistemas, aplicativos e dados em ambientes de nuvem, locais e híbridos.
À medida que você avança pelo guia, você conclui as seguintes tarefas de alto nível:
- Crie um espaço de trabalho de aplicativo lógico Standard e um projeto com um fluxo de trabalho com estado em branco.
- Adicione um gatilho e ações ao fluxo de trabalho.
- Executar, depurar e testar localmente.
- Avalie o histórico de execução do fluxo de trabalho.
- Localizar os detalhes do nome de domínio para acesso ao firewall.
- Habilitar o histórico de execuções para fluxos de trabalho sem estado.
- Implantar no Azure, que inclui, opcionalmente, a habilitação do Application Insights.
- Após a implantação, habilitar ou abrir o Application Insights.
- Gerencie o recurso de aplicativo lógico implantado no Visual Studio Code e no portal do Azure.
Pré-requisitos
Requisitos de acesso e conectividade
Se você planeja criar e executar fluxos de trabalho localmente usando apenas operações internas, que são executadas nativamente no runtime dos Aplicativos Lógicos do Azure (Standard), você não precisa dos requisitos de acesso e conectividade nesta seção. No entanto, para os seguintes cenários, você precisa atender a esses requisitos:
- Implante seu aplicativo lógico no Azure por meio do Visual Studio Code.
- Crie um fluxo de trabalho que usa operações de conector gerenciado que são executadas no Azure global.
- Acesse os recursos e fluxos de trabalho do aplicativo lógico Standard existentes no Azure ou em outros recursos implantados do Azure.
Esses requisitos incluem os seguintes itens:
Uma conta e uma assinatura do Azure. Se você não tem uma assinatura, inscreva-se em uma conta gratuita do Azure.
Acessar a Internet para baixar a extensão necessária, conectar o Visual Studio Code à sua conta do Azure, testar fluxos de trabalho que incluem operações de conectores gerenciados e implantar no Azure a partir do Visual Studio Code.
Para criar o mesmo fluxo de trabalho de exemplo neste guia, você precisa de uma conta de email do Outlook do Office 365 que use uma conta corporativa ou de estudante da Microsoft para entrar.
Se não tem uma conta do Office 365, você pode usar qualquer outra ação disponível que possa enviar mensagens de sua conta de email, por exemplo, o Outlook.com. Se você escolher um conector de email diferente, como o Outlook.com, ainda poderá seguir o exemplo, e as etapas gerais serão as mesmas. No entanto, sua experiência e opções podem ser diferentes de algumas maneiras. Por exemplo, com o conector do Outlook.com, use sua conta pessoal da Microsoft para fazer login.
Ferramentas
Baixe e instale o Visual Studio Code, que é gratuito.
Baixe e instale a extensão dos Aplicativos Lógicos do Azure (Standard) para Visual Studio Code seguindo estas etapas:
No Visual Studio Code, na barra Atividades, selecione Extensões. (Teclado: Pressione Ctrl+Shift+X)
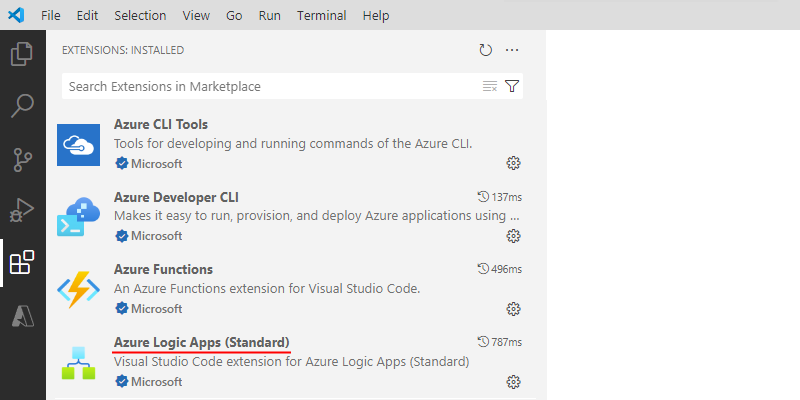
Na caixa de pesquisa de extensões, insira aplicativos lógicos do azure standard. Na lista de resultados, selecione Aplicativos Lógicos do Azure (Standard)>Instalar.
A extensão baixa e instala todas as dependências necessárias e as versões corretas para as seguintes estruturas:
- Azure Functions Core Tools
- SDK .NET
- Node.js
Após a conclusão da instalação, a extensão aparecerá na lista Extensões: instaladas.
Recarregue ou reinicie o Visual Studio Code para garantir que a extensão e todas as dependências sejam instaladas corretamente.
Para confirmar se a extensão e todas as dependências foram instaladas corretamente, consulte Verificar a instalação da extensão.
No momento, você pode ter extensões de Consumo (multilocatário) e Standard (locatário único) instaladas ao mesmo tempo. As experiências de desenvolvimento diferem umas das outras de algumas maneiras, mas na sua assinatura do Azure você pode incluir tipos de recursos de aplicativo lógico Standard e Consumption. No Visual Studio Code, o painel do Azure mostra todos os aplicativos lógicos implantados e hospedados pelo Azure em sua assinatura do Azure, mas organiza seus aplicativos das seguintes maneiras:
- Seção Recursos: todos os aplicativos lógicos Standard em sua assinatura.
- Seção Aplicativos Lógicos (Consumo): todos os aplicativos lógicos de consumo em sua assinatura.
Para executar localmente gatilhos e ações baseados em webhook, como o gatilho de Webhook HTTP interno, você precisa configurar o encaminhamento para a URL de retorno de chamada no Visual Studio Code.
Para habilitar o registro em log e rastreamento de diagnóstico com o Application Insights para seu aplicativo lógico Standard, conclua essa tarefa durante a implantação do aplicativo lógico ou após a implantação. Você precisa ter um recurso do Application Insights, mas pode criar esse recurso com antecedência, durante a implantação ou após a implantação.
Instale ou use uma ferramenta que pode enviar solicitações HTTP para testar o fluxo de trabalho de exemplo, por exemplo:
- Visual Studio Code com uma extensão do Visual Studio Marketplace
- Invoke-RestMethod do PowerShell
- Microsoft Edge – ferramenta console de rede
- Bruno
- curl
Cuidado
Para cenários em que você tem dados confidenciais, como credenciais, segredos, tokens de acesso, chaves de API e outras informações semelhantes, use uma ferramenta que proteja seus dados com os recursos de segurança necessários. A ferramenta deve funcionar offline ou localmente e não exigir entrar em uma conta online ou sincronizar dados com a nuvem. Ao usar uma ferramenta com essas características, você reduz o risco de expor dados confidenciais ao público.
Verificar a instalação da extensão
Para garantir que a extensão e todas as dependências estejam instaladas corretamente, recarregue ou reinicie o Visual Studio Code.
Confirme se o Visual Studio Code localiza e instala automaticamente as atualizações de extensão para que todas as suas extensões recebam as últimas atualizações. Caso contrário, você precisará desinstalar manualmente a versão desatualizada e instalar a versão mais recente.
No menu Arquivo, acesse Preferências>Configurações.
Na guia Usuário, acesse Recursos>Extensões.
Verifique se as Atualizações de Verificação Automática estão selecionadas e se a Atualização Automática está definida como Todas as Extensões.
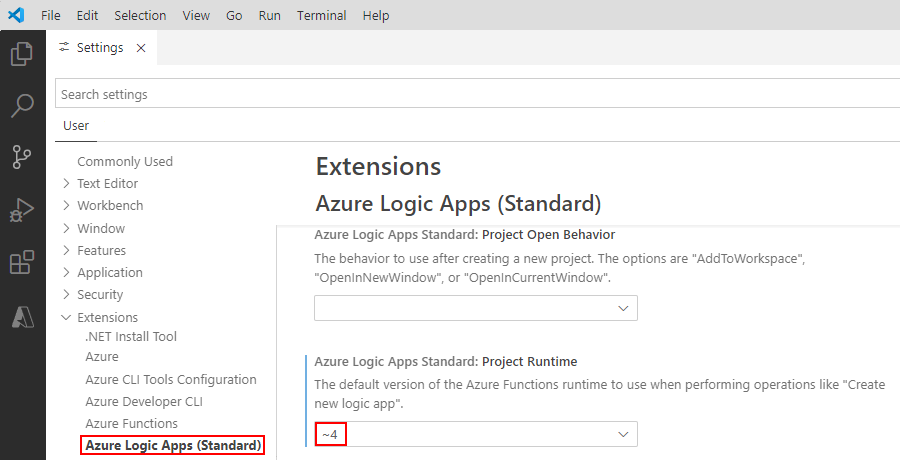
Confirme se a configuração Azure Logic Apps Standard: Project Runtime está definida como a versão correta:
Na guia Usuário, acesse >Extensões>Aplicativos Lógicos do Azure (Standard).
Verifique se o Project Runtime está definido como a versão ~4, por exemplo:
Observação
Esta versão é necessária para usar as ações de Operações de Código Embutido.
Conectar-se à sua conta do Azure
Se você ainda não estiver conectado à sua conta do Azure, siga estas etapas para se conectar:
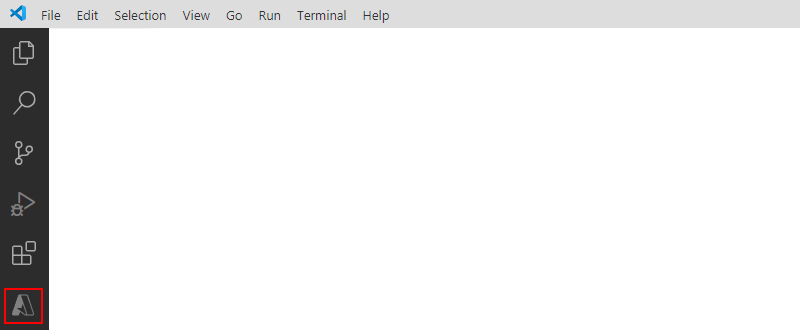
No Visual Studio Code, na Barra de Atividades, selecione o ícone do Azure para abrir o painel do Azure .
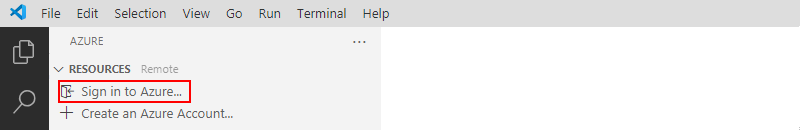
No painel do Azure, em Recursos, selecione Entrar no Azure. Quando a página de autenticação do Visual Studio Code for exibida, entre com sua conta do Azure.
Depois de entrar, o painel do Azure mostra as assinaturas do Azure associadas à sua conta do Azure. Se as assinaturas esperadas não aparecerem ou se você quiser que o painel mostre apenas assinaturas específicas, siga estas etapas:
Na lista de assinaturas, mova o ponteiro ao lado da primeira assinatura até que o botão Selecionar Assinaturas (ícone de filtro) seja exibido. Selecione o ícone de filtro.

Ou, na barra de status do Visual Studio Code, selecione sua conta do Azure.
Quando a lista de assinaturas atualizadas for exibida, selecione as assinaturas desejadas e verifique se você selecionou OK.
Criar um espaço de trabalho local
Um projeto de aplicativo lógico sempre requer um workspace. Portanto, antes de criar seu aplicativo lógico, você precisa criar um workspace no qual mantenha seu projeto de aplicativo lógico. Posteriormente, você usará esse workspace e projeto para gerenciar, executar e implantar seu aplicativo lógico do Visual Studio Code em seu ambiente de implantação. O projeto subjacente é semelhante a um projeto do Azure Functions, também conhecido como um projeto de aplicativo de funções.
No computador, crie uma pasta local vazia para usar posteriormente para o espaço de trabalho e o projeto.
Este exemplo cria uma pasta chamada fabrikam-workflows.
No Visual Studio Code, feche todas as pastas abertas.
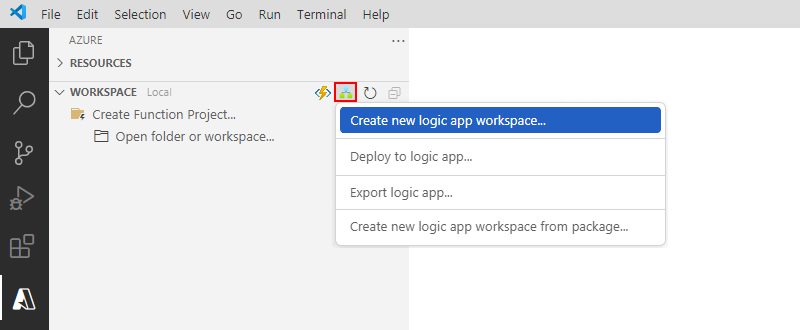
Na janela do Azure , na barra de ferramentas da seção Workspace , no menu Aplicativos Lógicos do Azure , selecione Criar novo workspace de aplicativo lógico.
Se o Windows Defender Firewall solicitar a concessão de acesso à rede para o Code.exe, que é o Visual Studio Code, e para o func.exe, que é o Azure Functions Core Tools, selecione Redes privadas, como minha casa ou rede de trabalho>Permitir acesso.
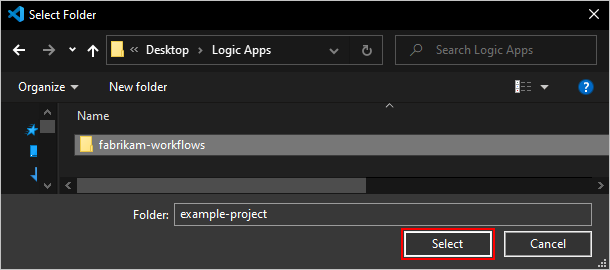
Na janela Selecionar Pasta , vá para o local onde você criou sua pasta, selecione a pasta e escolha Selecionar (não selecione a pasta duas vezes).
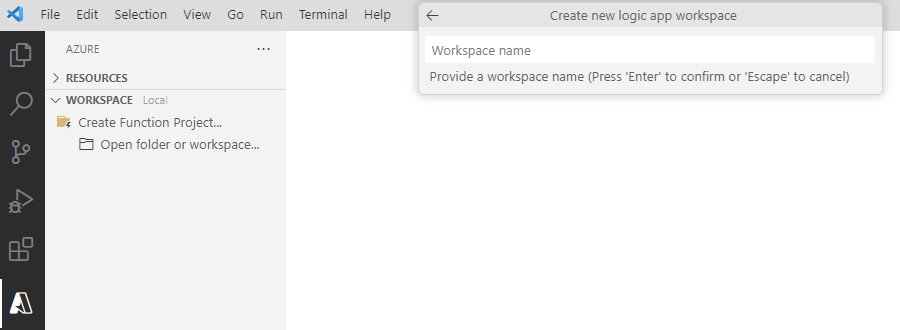
Na barra de ferramentas do Visual Studio Code, um prompt é exibido para você nomear seu workspace.
Para fornecer um nome de workspace, insira o nome do workspace a ser usado.
Este exemplo usa Fabrikam-Workflows.
Em seguida, crie seu projeto de aplicativo lógico.
Criar seu projeto de aplicativo lógico
Depois de criar o workspace necessário, siga os prompts para criar seu projeto.
Para o modelo de projeto, selecione Aplicativo lógico. Insira um nome de projeto a ser usado.
Este exemplo usa Fabrikam-Workflows.
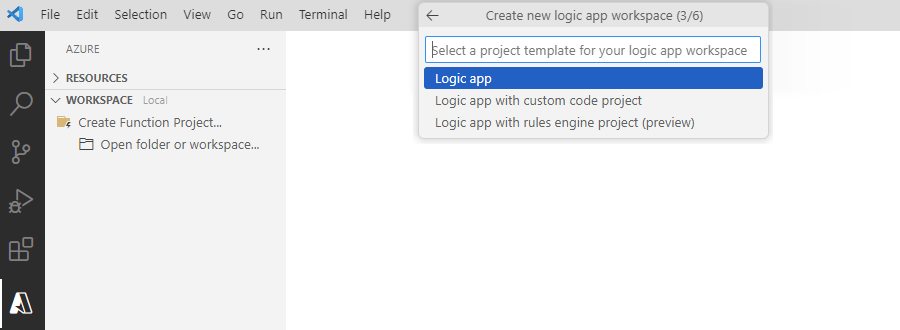
Para o modelo de fluxo de trabalho, selecione fluxo de trabalho com estado ou fluxo de trabalho sem estado, com base em seu cenário. Insira um nome de fluxo de trabalho a ser usado.
Este exemplo seleciona o fluxo de trabalho com estado, que armazena o histórico de fluxo de trabalho, entradas e saídas e usa Stateful-Workflow como o nome.
Fluxos de trabalho sem estado não armazenam esses dados e atualmente dão suporte apenas a ações de conector gerenciado, não a gatilhos. Embora você tenha a opção de habilitar conectores no Azure para seu fluxo de trabalho sem estado, o designer não mostra nenhum gatilho de conector gerenciado para você selecionar.
Observação
Se você receber um erro chamado azureLogicAppsStandard.createNewProject com a mensagem de erro, não será possível gravar nas Configurações do Workspace porque azureFunctions.suppressProject não é uma configuração registrada, tente reinstalar a extensão do Azure Functions para Visual Studio Code, diretamente do Visual Studio Marketplace ou de dentro do Visual Studio Code.
Agora, escolha se deseja abrir seu projeto na janela atual do Visual Studio Code ou em uma nova janela. Selecione Abrir na janela atual ou Abrir em nova janela, com base em sua preferência.
O painel Explorador é aberto para mostrar seu espaço de trabalho, projeto e o arquivo workflow.json aberto automaticamente. Esse arquivo existe na pasta denominada Stateful-Workflow e armazena a definição JSON subjacente para o fluxo de trabalho que você cria no designer. Para obter informações sobre sua estrutura de projeto, consulte a estrutura do projeto do aplicativo lógico Standard.
Você também receberá um prompt para habilitar conectores "compartilhados" de multilocação hospedados no Azure, como:
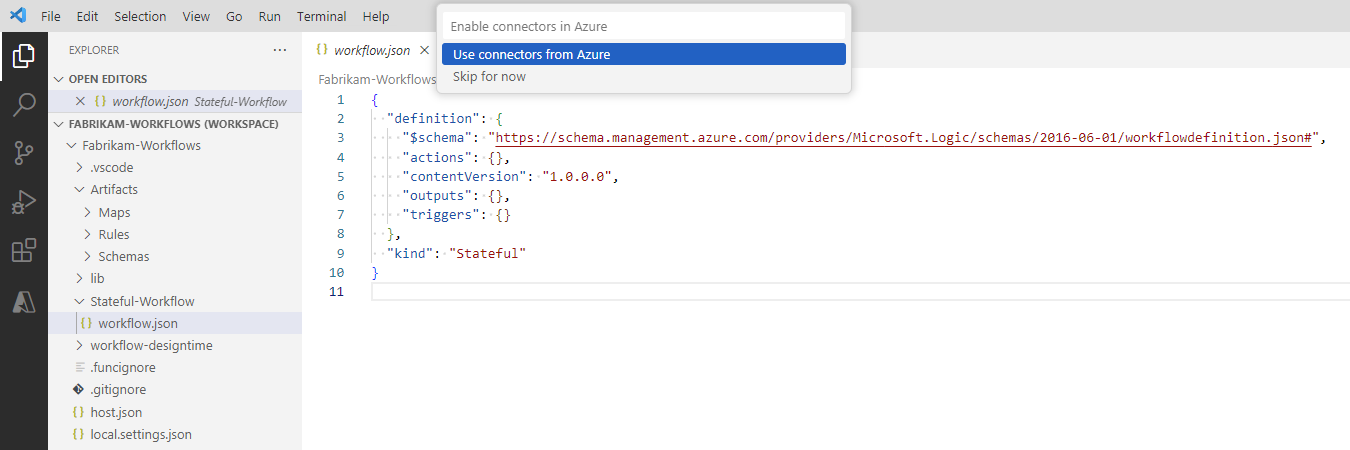
Para habilitar todos os conectores "compartilhados" gerenciados que são executados no Azure multilocatário para que você possa exibir e optar por usá-los em seu fluxo de trabalho, selecione Usar conectores do Azure.
Observação
Se você não selecionar essa opção e, posteriormente, tentar adicionar uma operação de conector gerenciado ao criar seu fluxo de trabalho, não poderá continuar porque o painel de informações da operação mostra um círculo giratório que não para.
Para o grupo de recursos do Azure, selecione Criar novo grupo de recursos. Insira o nome do grupo de recursos a ser usado.
Este exemplo usa Fabrikam-Workflows-RG.
Para a assinatura, selecione a assinatura do Azure a ser usada com seu projeto de aplicativo lógico.
Para o local onde criar seu grupo e recursos, selecione a região do Azure.
Este exemplo usa Centro-Oeste dos EUA.
Se o projeto precisar de outra configuração para desenvolvimento ou precisar de artefatos de suporte para criar seu fluxo de trabalho, consulte os seguintes cenários e tarefas relacionadas:
Cenário Tarefa Execute ações ou gatilhos baseados em webhook localmente. Configure o encaminhamento para URLs de retorno de chamada de webhook. Configure o histórico de execuções de fluxo de trabalho sem monitoração de estado. Habilite o histórico de execução para fluxos de trabalho sem estado. Adicione artefatos e dependências, como mapas, esquemas e assemblies. Adicionar artefatos e dependências. Trabalhar com um projeto baseado em NuGet (.NET) Converta um projeto de pacote baseado em extensão (Node.js) em um projeto baseado em pacote NuGet (.NET).
Observação: para converter um projeto baseado em pacote de extensão (Node.js) que você criou antes da existência do suporte a assemblies, consulte também Migrar projetos baseados em pacote nuGet para usar assemblies na pasta lib.Crie seus próprios conectores integrados. 1. Converter um projeto baseado em pacote de extensão (Node.js) em um projeto baseado em pacote NuGet (.NET ).
2. Habilitar a criação de conectores internos.
Agora, abra o designer de fluxo de trabalho.
Abrir o designer de fluxo de trabalho
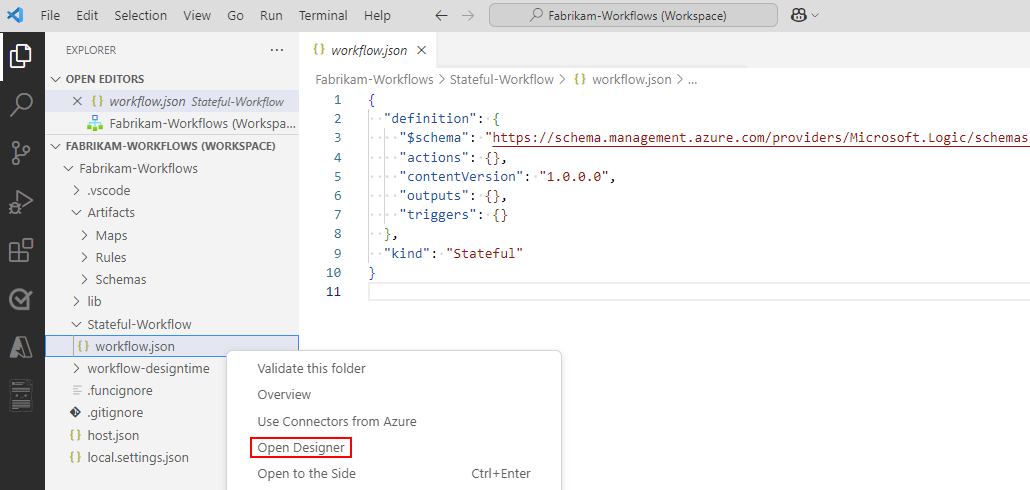
Depois que o projeto for aberto no painel do Explorer, abra o designer para que você possa criar seu fluxo de trabalho.
No menu de atalho de arquivo workflow.json, selecione Abrir Designer.
Observação
Depois de selecionar essa opção, você poderá receber a mensagem de que a inicialização pode levar alguns segundos devido a "iniciar a API de tempo de design do fluxo de trabalho". Você pode ignorar esta mensagem ou selecionar OK.
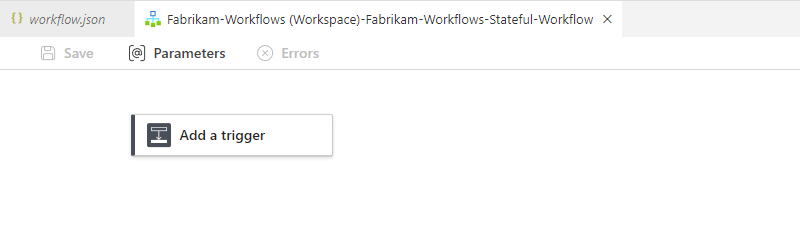
O Visual Studio Code abre o designer de fluxo de trabalho e mostra o prompt Adicionar um gatilho , por exemplo:
Observação
Se o designer não abrir, confira a seção de solução de problemas, o Designer não abre.
Em seguida, adicione um gatilho e ações para criar seu fluxo de trabalho.
Adicionar um gatilho e uma ação
Para criar seu fluxo de trabalho, inicie o fluxo de trabalho com um gatilho e, inicialmente, adicione uma única ação. Dessa forma, você pode testar seu fluxo de trabalho antes de adicionar a próxima ação. O fluxo de trabalho de exemplo usa o seguinte gatilho e ações, coletivamente conhecidos como operações:
| Conector ou grupo de operações | Nome da operação | Tipo de operação | Descrição |
|---|---|---|---|
| Solicitação | Quando uma solicitação HTTP é recebida | Gatilho (interno) | Cria um URL de ponto de extremidade no fluxo de trabalho para receber chamadas de entrada ou solicitações de outros serviços ou fluxos de trabalho de aplicativo lógico. Para obter mais informações, consulte Receber e responder a chamadas HTTPs de entrada para fluxos de trabalho. |
| Outlook do Office 365 | Enviar um email | Ação (gerenciada) | Envie um email usando uma conta do Outlook do Office 365. Para seguir as etapas neste guia, você precisa de uma conta de email do Outlook do Office 365. Para obter mais informações, consulte Conectar-se ao Office 365 Outlook por meio dos Aplicativos Lógicos do Azure. Observação: se você tiver uma conta de email compatível com um conector diferente, poderá usar esse conector, mas a experiência do usuário desse conector difere das etapas neste exemplo. |
| Solicitação | Resposta | Ação (interna) | Envie uma resposta e retorne os dados de volta ao chamador. Para obter mais informações, consulte Adicionar uma ação de resposta. |
Adicionar o gatilho de Solicitação
No designer de fluxo de trabalho, selecione Adicionar um gatilho, se ainda não estiver selecionado.
O painel Adicionar um gatilho é aberto e mostra uma galeria na qual você pode selecionar entre conectores e grupos de operações disponíveis, por exemplo:
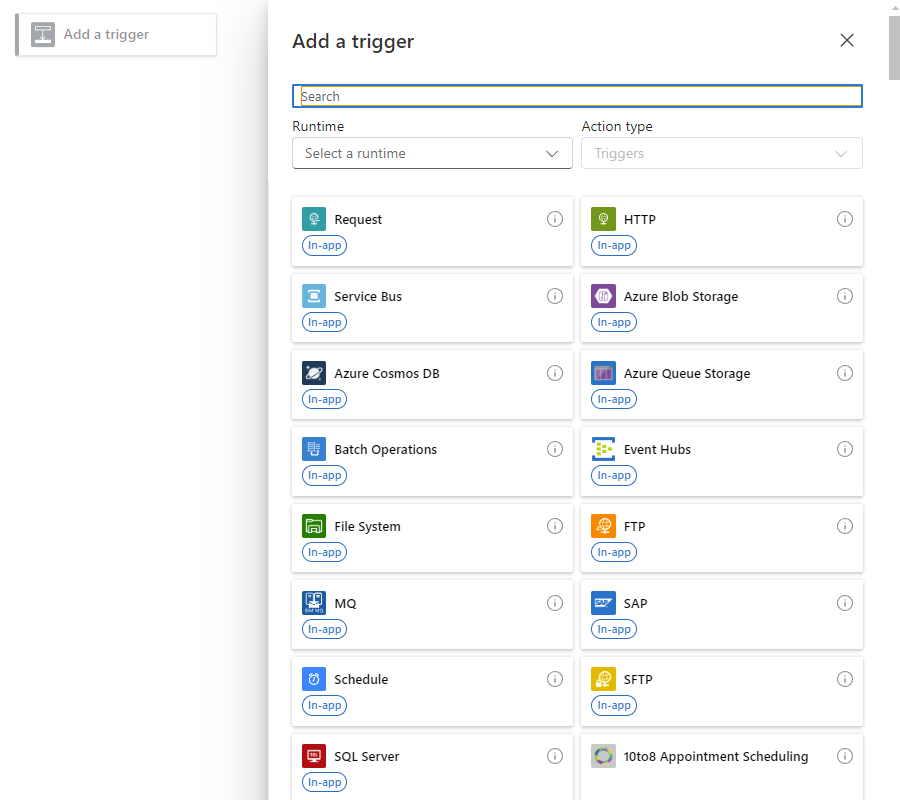
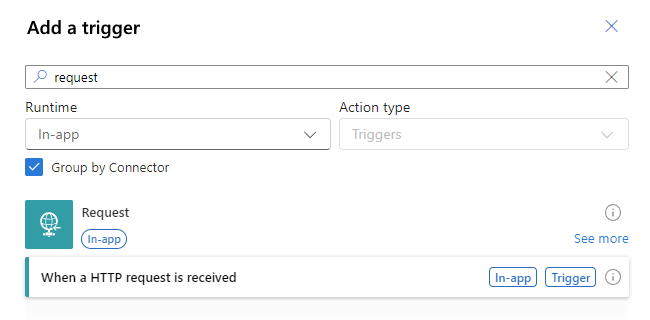
No painel Adicionar um gatilho , siga estas etapas gerais para adicionar o gatilho de solicitação chamado Quando uma solicitação HTTP for recebida.
O exemplo a seguir seleciona a opção Interna para que apenas os gatilhos internos apareçam:
Quando o gatilho aparece no designer, o painel de informações do gatilho é aberto e mostra os parâmetros, as configurações e outras tarefas relacionadas do gatilho.
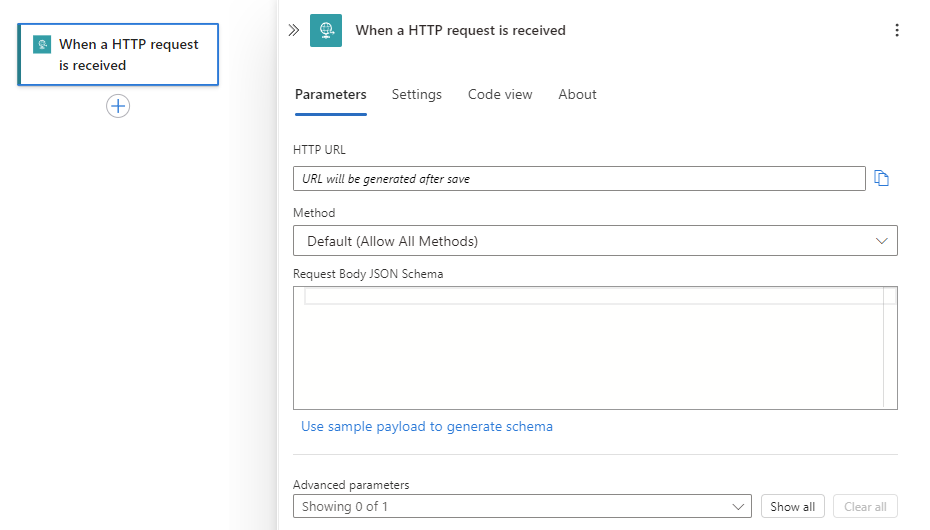
Observação
Se o painel de informações de gatilho não aparecer, verifique se o gatilho está selecionado no designer.
Salve seu fluxo de trabalho. Selecione Salvar na barra de ferramentas do designer.
Adicionar a ação do Office 365 Outlook
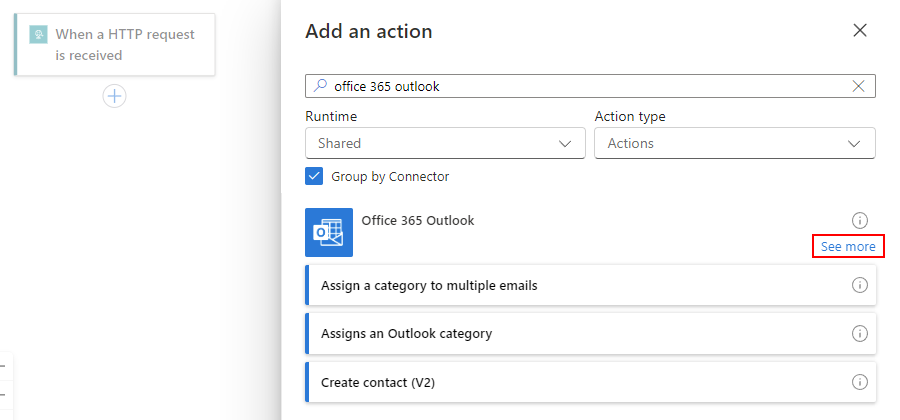
No designer, no gatilho Solicitação , siga estas etapas gerais para adicionar a ação do Outlook do Office 365 chamada Enviar um email (V2).
Se a ação não aparecer nos resultados iniciais, ao lado do nome do conector, selecione Ver mais, por exemplo:
Quando o painel de autenticação da ação for exibido, selecione Entrar para criar uma conexão com sua conta de email.
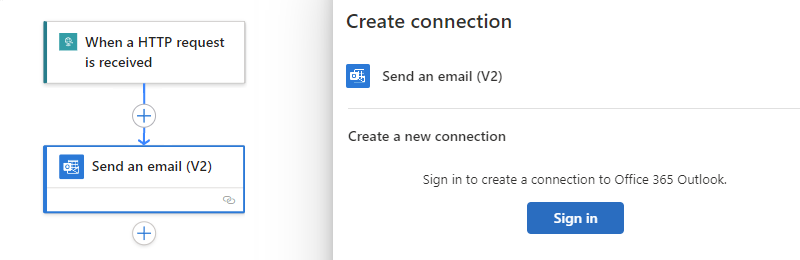
Siga os prompts subsequentes para autenticar suas credenciais, permitir o acesso e permitir o retorno ao Visual Studio Code.
Observação
Se passar muito tempo antes de concluir os prompts, o processo de autenticação atingirá o tempo limite e falhará. Nesse caso, retorne ao designer e tente entrar novamente para criar a conexão.
Quando o prompt de autenticação da Microsoft for exibido, selecione sua conta de usuário para o Outlook do Office 365. Na página de confirmação necessária que é aberta, selecione Permitir acesso.
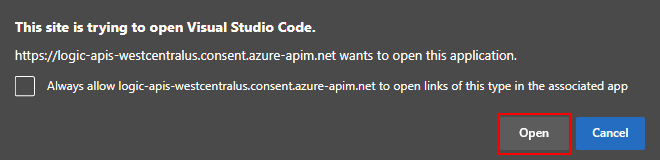
Quando os Aplicativos Lógicos do Azure solicitarem a abertura de um link do Visual Studio Code, selecione Abrir.
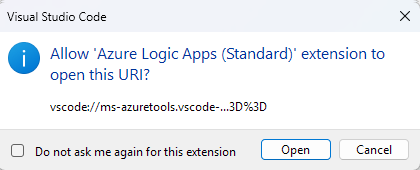
Quando o Visual Studio Code solicitar que a extensão abra as Ferramentas do Microsoft Azure, selecione Abrir.
Depois que o Visual Studio Code cria sua conexão, alguns conectores mostram a mensagem de que a conexão será válida somente por <n> dias. Esse limite de tempo aplica-se apenas à duração enquanto você cria o seu fluxo de trabalho de aplicativo lógico no Visual Studio Code. Após a implantação, esse limite não se aplica mais porque seu fluxo de trabalho pode autenticar em runtime usando sua identidade gerenciada atribuída pelo sistema habilitada automaticamente. Essa identidade gerenciada difere das credenciais de autenticação ou da cadeia de conexão que você usa ao criar uma conexão. Se você desabilitar essa identidade gerenciada atribuída pelo sistema, as conexões não funcionarão no runtime.
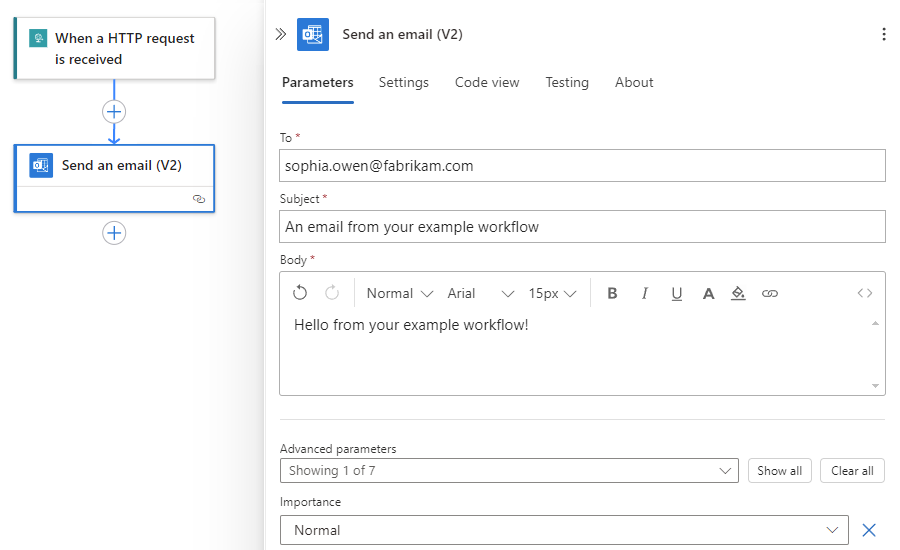
No painel Enviar informações de email que é aberto, na guia Parâmetros, forneça as informações necessárias para a ação.
Observação
Se o painel de informações de ação não for aberto automaticamente, selecione a ação Enviar um email no designer.
Propriedade Obrigatório Valor Descrição Para Sim < seu endereço de email> O destinatário do email, que pode ser seu endereço de email para fins de teste. Este exemplo usa o endereço de email fictício sophia.owen@fabrikam.com. Assunto Sim Um email do seu fluxo de trabalho de exemplo O assunto do email Corpo Sim Olá do seu exemplo de fluxo de trabalho! O conteúdo do corpo do email Por exemplo:
Salve seu fluxo de trabalho. No designer, selecione Salvar.
Estrutura de projeto de aplicativo lógico padrão
No Visual Studio Code, seu projeto de aplicativo lógico tem um dos seguintes tipos:
- Baseado em pacote de extensão (Node.js), que é o tipo padrão
- Baseado em pacote NuGet (.NET), que você pode converter pelo tipo padrão
Com base nesses tipos, seu projeto pode incluir pastas ou arquivos ligeiramente diferentes. Por exemplo, um projeto baseado em pacote nuget tem uma pasta .bin que contém pacotes e outros arquivos de biblioteca. Um projeto baseado em pacote de extensão não inclui essa pasta de .bin .
Alguns cenários exigem um projeto baseado em pacote NuGet para que seu aplicativo seja executado, por exemplo, quando você deseja desenvolver e executar operações internas personalizadas. Para obter mais informações sobre como converter o projeto para usar o NuGet, confira Habilitar a criação de conector integrado.
O projeto baseado em pacote de extensão padrão tem uma estrutura de arquivos e pasta semelhante ao seguinte exemplo:
MyWorkspaceName
| MyBundleBasedLogicAppProjectName
  || .vscode
  || Artifacts
     ||| Maps
         |||| MapName1
         |||| ...
     ||| Rules
     ||| Schemas
         |||| SchemaName1
         |||| ...
  || lib
     ||| builtinOperationSdks
         |||| JAR
         |||| net472
     ||| custom
  || WorkflowName1
     ||| workflow.json
     ||| ...
  || WorkflowName2
     ||| workflow.json
     ||| ...
  || workflow-designtime
     ||| host.json
     ||| local.settings.json
  || .funcignore
  || connections.json
  || host.json
  || local.settings.json
No nível raiz do projeto, você pode encontrar as seguintes pastas e arquivos junto com outros itens:
| Nome | Pasta ou arquivo | Descrição |
|---|---|---|
| .vscode | Pasta | Contém os arquivos de configurações relacionadas ao Visual Studio Code, como os arquivos extensions.json, launch.json, settings.json e tasks.json. |
| Artefatos | Pasta | Contém artefatos de conta de integração que você define e usa em fluxos de trabalho que suportam cenários B2B (entre empresas). Por exemplo, a estrutura de exemplo inclui as seguintes pastas: - Mapas: contém mapas a serem usados para operações de transformação XML. - Esquemas: contém esquemas a serem usados para operações de validação XML. - Regras: artefatos para regras de negócios em projetos de mecanismo baseados em regras. |
| Lib | Pasta | Contém assemblies com suporte que seu aplicativo lógico pode usar ou referenciar. Você pode carregar esses assemblies em seu projeto no Visual Studio Code, mas deve adicioná-los a pastas específicas em seu projeto. Por exemplo, essa pasta inclui as seguintes pastas: - builtinOperationSdks: contém as pastas JAR e net472 para assemblies Java e .NET Framework, respectivamente. - personalizado: contém assemblies personalizados do .NET Framework. Para obter mais informações sobre os tipos de assembly com suporte e onde colocá-los em seu projeto, consulte Adicionar assemblies ao seu projeto. |
| < WorkflowName> | Pasta | Para cada fluxo de trabalho, a pasta <WorkflowName> inclui um arquivo workflow.json, que contém a definição JSON subjacente desse fluxo de trabalho. |
| workflow-designtime | Pasta | Contém arquivos de configurações relacionados ao ambiente de desenvolvimento. |
| .funcignore | Arquivo | Contém informações relacionadas ao Azure Functions Core Tools instalado. |
| connections.json | Arquivo | Contém os metadados, pontos de extremidade e chaves para conexões gerenciadas e funções do Azure usados pelos fluxos de trabalho. Importante: para usar diferentes conexões e funções para cada ambiente, certifique-se de parametrizar esse arquivo connections.json e atualizar os pontos de extremidade. |
| host.json | Arquivo | Contém definições e valores de configuração específicos do runtime, como limites padrão para a plataforma de Aplicativos Lógicos do Azure de locatário único, aplicativos lógicos, fluxos de trabalho, gatilhos e ações. No nível raiz do projeto de aplicativo lógico, o arquivo de metadados host.json contém as definições de configuração e os valores padrão que todos os fluxos de trabalho no mesmo aplicativo lógico usam durante a execução, seja localmente ou no Azure. Para obter informações de referência, consulte Editar configurações de aplicativo e configurações de host. Observação: quando você cria seu aplicativo lógico, o Visual Studio Code cria um arquivo host.snapshot.*.json em seu contêiner de armazenamento. Se você excluir seu aplicativo lógico, esse arquivo de backup não será excluído. Se você criar outro aplicativo lógico com o mesmo nome, outro arquivo de instantâneo será criado. Você pode ter apenas até dez instantâneos para o mesmo aplicativo lógico. Se ultrapassar esse limite, você verá o seguinte erro: Microsoft.Azure.WebJobs.Script.WebHost: Repository has more than 10 non-decryptable secrets backups (host)) Para resolver esse erro, exclua os arquivos de instantâneo adicionais do seu contêiner de armazenamento. |
| local.settings.json | Arquivo | Contém configurações de aplicativo, cadeias de conexão e outras configurações usadas pelos fluxos de trabalho ao serem executados localmente. Essas configurações e valores se aplicam somente quando você executa seus projetos em seu ambiente de desenvolvimento local. Durante a implantação para o Azure, o arquivo e as configurações são ignorados e não são incluídos na implantação. Esse arquivo armazena configurações e valores como variáveis de ambiente locais que suas ferramentas de desenvolvimento locais usam para os appSettings valores. Você pode chamar e fazer referência a essas variáveis de ambiente no runtime e durante a implantação usando configurações de aplicativo e parâmetros. Importante: o arquivo local.settings.json pode conter segredos; verifique se você também excluiu esse arquivo do seu controle do código-fonte do projeto. Esse arquivo também contém as configurações de aplicativo que seu aplicativo lógico precisa para funcionar corretamente. Para obter informações de referência, consulte Editar configurações de aplicativo e configurações de host. |
Outras tarefas de configuração de desenvolvimento
Depois de criar seu projeto, você ainda poderá ter outras tarefas de instalação para dar suporte a cenários específicos de desenvolvimento local em torno da criação, execução e implantação de aplicativos lógicos Standard usando o Visual Studio Code. As seções a seguir descrevem as tarefas para esses cenários.
Habilitar webhooks em execução localmente
Uma operação de webhook é um gatilho de fluxo de trabalho ou uma ação que aguarda que um evento ocorra antes que a operação possa ser executada. Especificamente, a operação de webhook aguarda uma solicitação HTTPS chegar de um serviço de chamador ou fluxo de trabalho antes que a operação possa continuar. Por exemplo, os webhooks incluem operações como o gatilho de solicitação e o gatilho HTTP + Webhook .
No portal do Azure, o runtime dos Aplicativos Lógicos do Azure assina automaticamente o webhook no serviço de chamador ou no fluxo de trabalho. O runtime registra um URL de retorno de chamada para o webhook com o serviço de chamador ou fluxo de trabalho. O webhook aguarda o chamador enviar a solicitação usando o URL de retorno de chamada.
No entanto, no Visual Studio Code, você precisa concluir algumas tarefas de instalação para que as operações de webhook funcionem corretamente. Nesse cenário, a URL de retorno de chamada usa o servidor localhost (http://localhost:7071/...), que é privado, para que o chamador não possa enviar diretamente uma solicitação pela Internet para essa URL.
Para operações de webhook em fluxos de trabalho em execução local, você precisa configurar uma URL pública que expõe o servidor localhost e encaminha com segurança as chamadas do chamador para a URL de retorno de chamada. Você pode usar um serviço de encaminhamento e uma ferramenta como ngrok, que abre um túnel HTTP para a porta do localhost, ou pode usar sua ferramenta equivalente.
Configurar o encaminhamento de chamadas usando ngrok
Vá para o site do ngrok. Inscreva-se para uma nova conta ou entre em sua conta, se você já tiver uma.
Obtenha seu token de autenticação pessoal, que o cliente do ngrok precisa para se conectar e autenticar o acesso à sua conta.
Para localizar sua página do token de autenticação, no menu do painel da sua conta, expanda Autenticação e selecione Seu Authtoken.
Na caixa Seu Authtoken, copie o token para um local seguro.
Na página de download do ngrok ou no painel da sua conta, baixe a versão do ngrok que você deseja e extraia o arquivo .zip.
Para saber mais, confira Etapa 1: Descompactar para instalar.
Em seu computador, abra a ferramenta de prompt de comando. Navegue até o local onde você tem o arquivo ngrok.exe.
Conecte o cliente ngrok à sua conta ngrok executando o seguinte comando:
ngrok authtoken <your-authentication-token>Para saber mais, confira Etapa 2: Conectar sua conta.
Abra o túnel HTTP para a porta localhost 7071 executando o seguinte comando:
ngrok http 7071Para saber mais, confira Etapa 3: Acionar.
Da saída, encontre a seguinte linha:
http://<domain>.ngrok.io -> http://localhost:7071Copie e salve a URL, que tem este formato:
http://<domain>.ngrok.io
Configurar a URL de encaminhamento nas configurações do aplicativo
No Visual Studio Code, no designer, adicione a operação de webhook que você deseja usar em seu fluxo de trabalho.
Este exemplo continua com o gatilho HTTP + Webhook.
Quando o prompt for exibido pedindo o local do ponto de extremidade do host, insira a URL de encaminhamento (redirecionamento) que você criou anteriormente.
Observação
Ignorar o prompt faz com que apareça um aviso de que você deve fornecer a URL de encaminhamento, portanto, selecione Configurare insira a URL. Depois de concluir esta etapa, a solicitação não será exibida para as operações de webhook subsequentes que você pode adicionar.
Para fazer com que o prompt apareça, no nível raiz do seu projeto, abra o menu de atalho do arquivo local.settings.json e selecione Configurar o Ponto de Extremidade de Redirecionamento do Webhook. O prompt agora é exibido para que você possa fornecer a URL de encaminhamento.
O Visual Studio Code adiciona a URL de encaminhamento ao arquivo local.settings.json na pasta raiz do projeto.
ValuesNo objeto, a propriedade nomeadaWorkflows.WebhookRedirectHostUriagora aparece e é definida como a URL de encaminhamento, por exemplo:{ "IsEncrypted": false, "Values": { "AzureWebJobsStorage": "UseDevelopmentStorage=true", "FUNCTIONS_WORKER_RUNTIME": "dotnet", "FUNCTIONS_V2_COMPATIBILITY_MODE": "true", <...> "Workflows.WebhookRedirectHostUri": "http://xxxXXXXxxxXXX.ngrok.io", <...> } }Para obter mais informações sobre essas configurações de aplicativo, consulte Editar configurações de aplicativo e configurações de host para aplicativos lógicos Standard.
Na primeira vez em que você inicia uma sessão de depuração local ou executa o fluxo de trabalho sem depuração, o runtime dos Aplicativos Lógicos do Azure registra o fluxo de trabalho com o chamador e assina o ponto de extremidade do chamador que notifica as operações de webhook. Na próxima vez em que o fluxo de trabalho for executado, o runtime não será registrado ou reassinado porque o registro de assinatura já existe no armazenamento local.
Quando você interrompe a sessão de depuração para um fluxo de trabalho que usa operações de webhook executadas localmente, os registros de assinatura existentes não são excluídos. Para cancelar o registro, você precisa remover manualmente ou excluir os registros de assinatura.
Observação
Depois que o fluxo de trabalho começar a ser executado, a janela do terminal poderá mostrar erros como este exemplo:
message='Http request failed with unhandled exception of type 'InvalidOperationException' and message: 'System.InvalidOperationException: Synchronous operations are disallowed. Call ReadAsync or set AllowSynchronousIO to true instead.'
Nesse caso, abra o arquivo local.settings.jsno na pasta raiz do projeto e verifique se a propriedade está definida como true:
"FUNCTIONS_V2_COMPATIBILITY_MODE": "true"
Habilitar o histórico de execuções para fluxos de trabalho sem estado
Para depurar um fluxo de trabalho sem estado com mais facilidade, habilite o histórico de execução para esse fluxo de trabalho e desabilite o histórico de execução quando terminar. Siga essas etapas para o Visual Studio Code ou, se estiver trabalhando no portal do Azure, confira Criar fluxos de trabalho baseados em locatário único no portal do Azure.
No projeto do Visual Studio Code, no nível da pasta raiz, abra o arquivo local.settings.json .
Adicione a propriedade
Workflows.<workflow-name>.operationOptionse defina o valor comoWithStatelessRunHistory, por exemplo:Windows
{
   "IsEncrypted": false,
   "Values": {
      "AzureWebJobsStorage": "UseDevelopmentStorage=true",
      "FUNCTIONS_WORKER_RUNTIME": "dotnet",
      "Workflows.<workflow-name>.OperationOptions": "WithStatelessRunHistory"
   }
}
macOS ou Linux
{
   "IsEncrypted": false,
   "Values": {
      "AzureWebJobsStorage": "DefaultEndpointsProtocol=https;AccountName=fabrikamstorageacct; \
          AccountKey=<access-key>;EndpointSuffix=core.windows.net",
      "FUNCTIONS_WORKER_RUNTIME": "dotnet",
      "Workflows.<workflow-name>.OperationOptions": "WithStatelessRunHistory"
   }
}
Na pasta do projeto chamada workflow-designtime, abra o arquivo local.settings.json e faça a mesma alteração.
Para desativar o histórico de execuções ao concluir, você pode definir a
Workflows.<workflow-name>.OperationOptionspropriedade comoNoneou excluir a propriedade e seu valor.
Adicionar artefatos e dependências ao seu projeto
Em cenários específicos, seu fluxo de trabalho pode incluir operações que exigem dependências como assemblies ou artefatos, como mapas, esquemas ou regras. No Visual Studio Code, você pode adicionar esses itens às pastas correspondentes em seu projeto, por exemplo:
| Elemento | Tipo de arquivo | Descrição |
|---|---|---|
| Mapas | .xslt | Para obter mais informações, consulte Adicionar mapas para transformações em fluxos de trabalho. |
| Esquemas | .xsd | Para obter mais informações, consulte Adicionar esquemas para validação. |
| Regras | .xml | Para obter mais informações, consulte Criar um projeto do Mecanismo de Regras dos Aplicativos Lógicos do Azure. |
| Assembléias |
-
.dll (.NET Framework ou .NET 8) - .jar (Java) |
Um recurso de aplicativo lógico Standard pode usar ou fazer referência a tipos específicos de assemblies, que você pode carregar no projeto no Visual Studio Code. No entanto, você deve adicioná-las a pastas de projeto específicas. Para obter mais informações, consulte Adicionar assemblies referenciados. Observação: se você tiver um projeto de aplicativo lógico baseado em pacote NuGet (.NET) antes do suporte a assemblies ficar disponível, consulte Migrar projetos baseados em pacote NuGet para usar assemblies na pasta lib. |
Converter seu projeto em .NET (baseado em pacote NuGet)
Por padrão, o Visual Studio Code cria seu projeto de aplicativo lógico como um projeto baseado em pacote de extensão (Node.js). Se você precisar de um projeto baseado em pacote NuGet (.NET), por exemplo, para criar seus próprios conectores internos, deverá converter seu projeto padrão em um projeto baseado em pacote NuGet (.NET).
Importante
Essa ação é uma operação unidirecional que não pode ser desfeita.
No painel Do Explorer, mova o ponteiro do mouse sobre qualquer área em branco abaixo das pastas e arquivos do projeto, abra o menu de atalho e selecione Converter em projeto de aplicativo lógico baseado em NuGet.
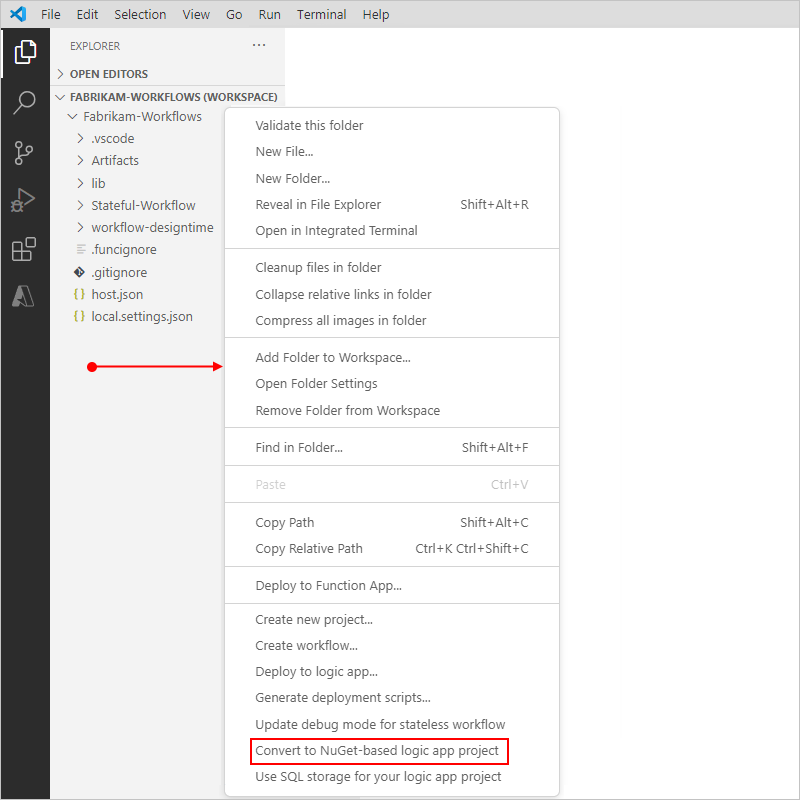
Quando o prompt for exibido, confirme a conversão do projeto.
Migrar projetos baseados no pacote NuGet para usar assemblies na pasta "lib"
Importante
Essa tarefa é necessária apenas para projetos de aplicativo lógico baseado em pacote nuGet (.NET) criados antes que o suporte a assemblies se disponibilize.
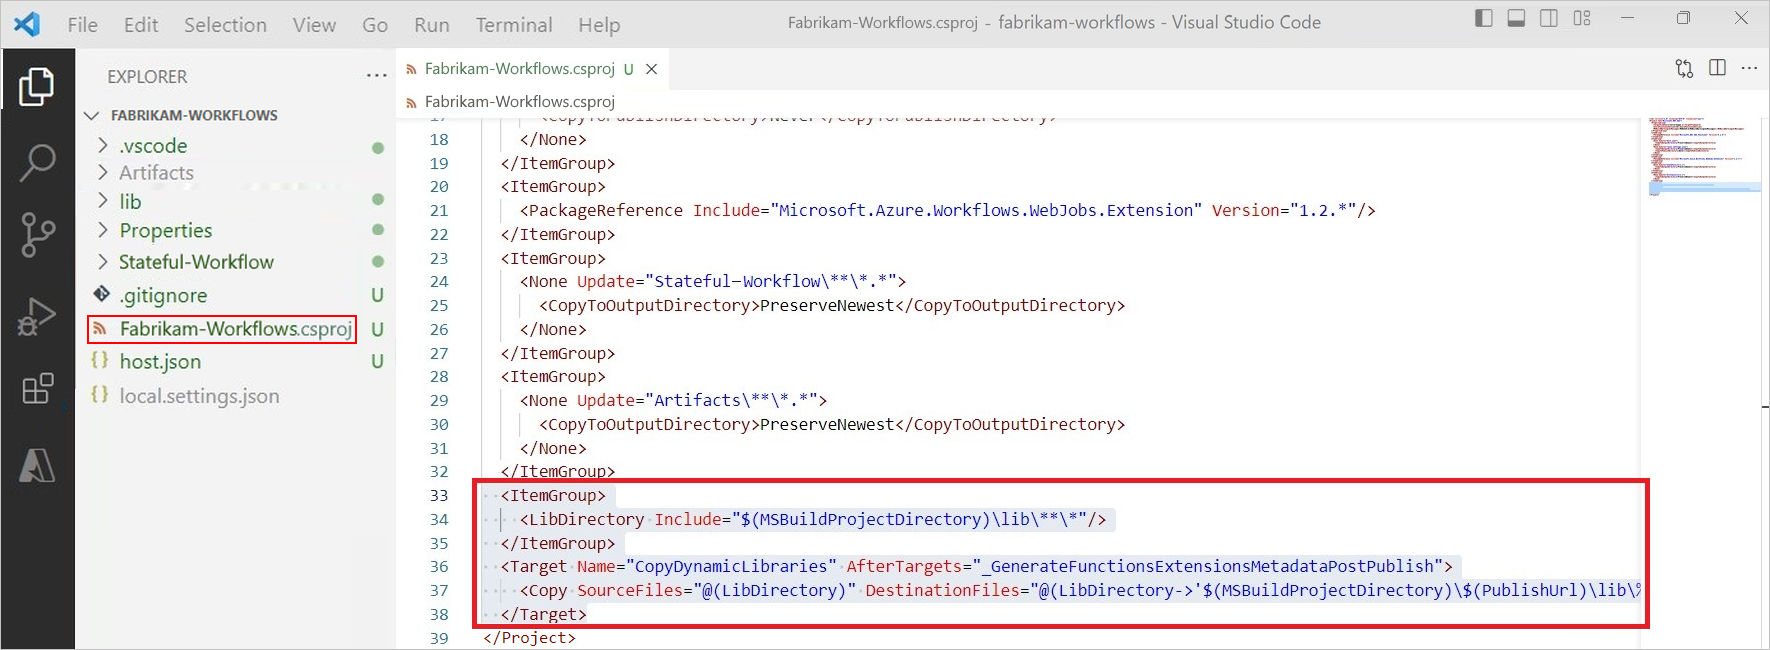
Se você criou seu projeto de aplicativo lógico quando o suporte a assemblies não estava disponível para fluxos de trabalho de aplicativo lógico Standard, você pode adicionar as seguintes linhas ao arquivo <project-name>.csproj para trabalhar com projetos que usam assemblies:
  <ItemGroup>
    <LibDirectory Include="$(MSBuildProjectDirectory)\lib\**\*"/>
  </ItemGroup>
  <Target Name="CopyDynamicLibraries" AfterTargets="_GenerateFunctionsExtensionsMetadataPostPublish">
    <Copy SourceFiles="@(LibDirectory)" DestinationFiles="@(LibDirectory->'$(MSBuildProjectDirectory)\$(PublishUrl)\lib\%(RecursiveDir)%(Filename)%(Extension)')"/>
  </Target>
Importante
Para um projeto executado no Linux ou macOS, atualize o separador de diretório. Por exemplo, examine a imagem a seguir que mostra o código anterior adicionado ao < arquivo project-name.csproj>:
Habilitar a criação de conectores internos
Você pode criar seus conectores internos para qualquer serviço necessário usando a estrutura de extensibilidade dos Aplicativos Lógicos do Azure de locatário único. De maneira semelhante a conectores internos como o Barramento de Serviço do Azure e o SQL Server, esses conectores fornecem maior taxa de transferência, baixa latência, conectividade local e execução nativa no mesmo processo que o runtime dos Aplicativos Lógicos do Azure de locatário único.
No momento, a capacidade de criação está disponível apenas no Visual Studio Code, mas não está habilitada por padrão. Para criar esses conectores, siga estas etapas:
Caso ainda não tenha feito isso, converta seu projeto baseado em pacote de extensão (Node.js) em um projeto baseado em pacote NuGet (.NET).
Examine e siga as etapas no artigo, Aplicativos Lógicos do Azure em Execução em Qualquer Lugar – Extensibilidade de conector interno.
Executar, depurar e testar fluxos de trabalho localmente
As seções a seguir mostram como você pode definir pontos de interrupção e iniciar uma sessão de depuração para executar e testar seu fluxo de trabalho localmente.
Definir pontos de interrupção para depuração
Antes de executar e testar o fluxo de trabalho do aplicativo lógico iniciando uma sessão de depuração, você pode definir pontos de interrupção dentro do arquivo workflow.json para cada fluxo de trabalho. Nenhuma outra configuração é necessária.
No momento, há suporte para pontos de interrupção apenas para ações, não para gatilhos. Cada definição de ação tem estes locais de ponto de interrupção:
Defina o ponto de interrupção inicial na linha que mostra o nome da ação. Quando esse ponto de interrupção é atingido durante a sessão de depuração, você pode revisar as entradas da ação antes que elas sejam avaliadas.
Defina o ponto de interrupção final na linha que mostra a chave de fechamento da ação (}). Quando esse ponto de interrupção é atingido durante a sessão de depuração, você pode revisar os resultados da ação antes que a execução da ação seja concluída.
Para adicionar um ponto de interrupção, siga estas etapas:
Abra o arquivo workflow.json para o fluxo de trabalho que você deseja depurar.
Na linha em que você deseja definir o ponto de interrupção, na coluna à esquerda, selecione dentro dessa coluna. Para remover o ponto de interrupção, selecione esse ponto de interrupção.
Quando você inicia a sessão de depuração, a exibição da Execução aparece no lado esquerdo da janela de código, enquanto a barra de ferramentas Depurar aparece perto da parte superior.
Observação
Se a exibição da Execução não aparecer automaticamente, pressione Ctrl+Shift+D.
Para examinar as informações disponíveis quando atinge um ponto de interrupção, na exibição da Execução, examine o painel Variáveis.
Para continuar a execução do fluxo de trabalho, na barra de ferramentas Depurar, selecione Continuar (botão reproduzir).
Você pode adicionar e remover pontos de interrupção a qualquer momento durante a execução do fluxo de trabalho. No entanto, se você atualizar o arquivo workflow.json depois que a execução for iniciada, os pontos de interrupção não serão atualizados automaticamente. Para atualizar os pontos de interrupção, reinicie o aplicativo lógico.
Para informações gerais, confira Pontos de interrupção – Visual Studio Code.
Depurar e testar seu fluxo de trabalho
Para testar o fluxo de trabalho, siga estas etapas para executar uma sessão de depuração e encontrar a URL do endpoint criado pelo gatilho Requisição. Você precisa dessa URL para que possa enviar posteriormente uma solicitação para esse ponto de extremidade.
Caso tenha um fluxo de trabalho sem estado, habilite o histórico de execuções para o fluxo de trabalho para facilitar a depuração.
No menu Executar , selecione Iniciar Depuração (F5).
A janela do Terminal é aberta para que você possa examinar a sessão de depuração.
Observação
Se você receber o erro "Há um erro após executar o preLaunchTask 'generateDebugSymbols'", confira a seção de solução de problemas, Falha na inicialização da sessão de depuração.
Agora, localize o URL de retorno de chamada para o ponto de extremidade criado pelo gatilho se Solicitação.
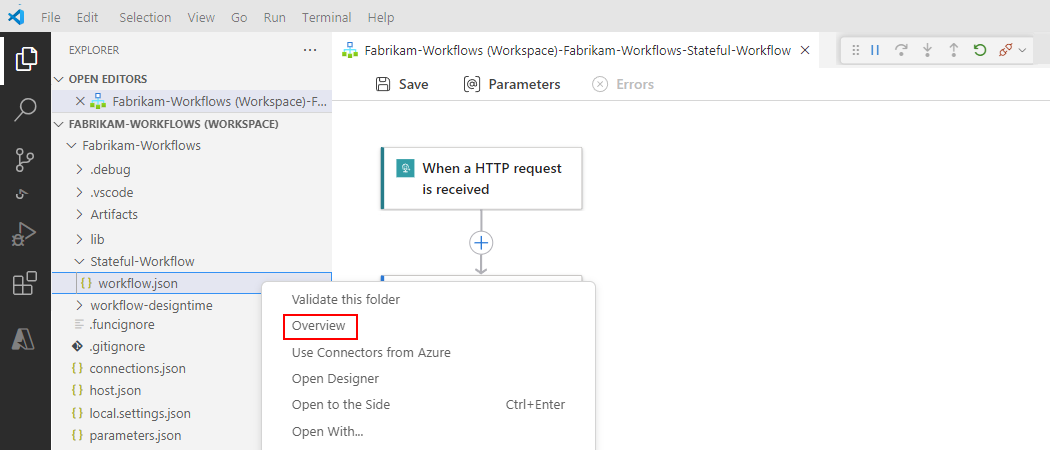
Reabra o painel Do Explorer para exibir seu projeto.
No menu de atalho do arquivo workflow.json, selecione Visão geral.
Copie e guarde a URL de callback, que é semelhante à seguinte URL para o gatilho Quando uma solicitação HTTP é recebida neste exemplo.
http://localhost:7071/api/<workflow-name>/triggers/manual/invoke?api-version=2020-05-01&sp=%2Ftriggers%2Fmanual%2Frun&sv=1.0&sig=<shared-access-signature>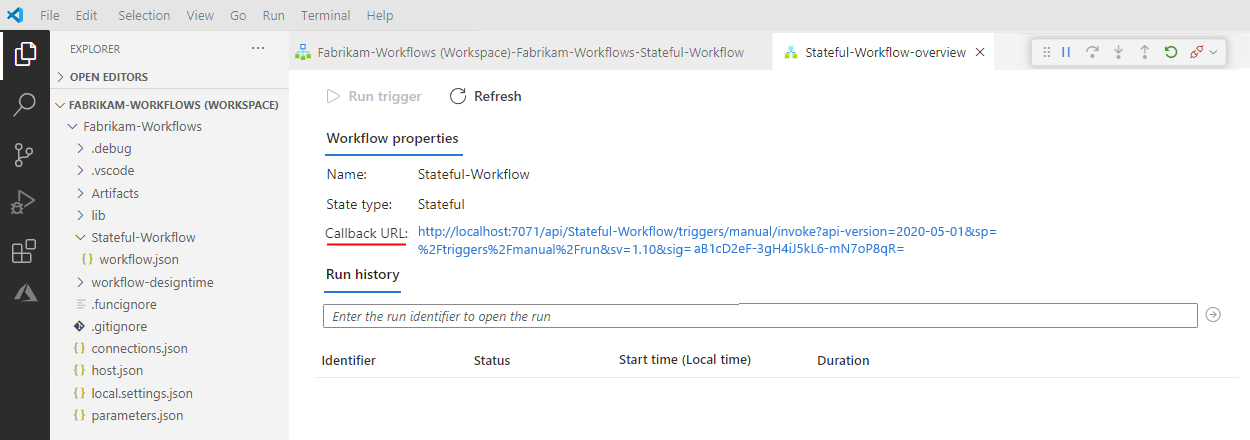
Para testar a URL de callback e disparar o fluxo de trabalho, envie uma solicitação HTTP para a URL, incluindo o método HTTP que o gatilho espera, utilizando sua ferramenta de requisição HTTP e seguindo suas instruções.
Esse exemplo usa o método GET com a URL copiada, que se parece com a seguinte amostra:
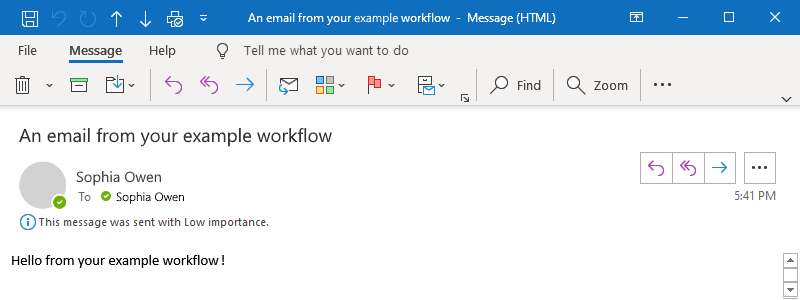
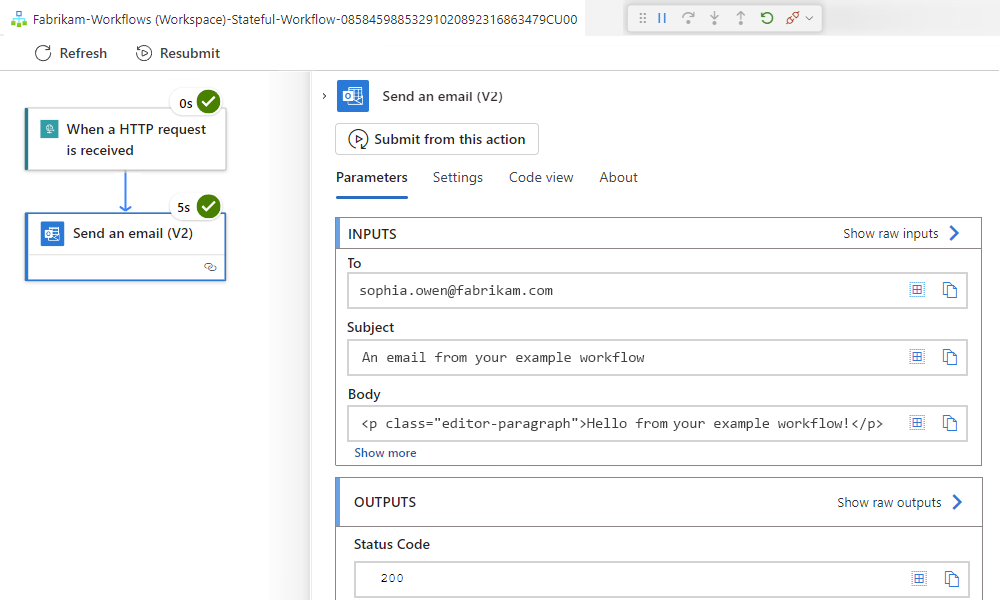
GET http://localhost:7071/api/Stateful-Workflow/triggers/manual/invoke?api-version=2020-05-01&sp=%2Ftriggers%2Fmanual%2Frun&sv=1.0&sig=<shared-access-signature>Quando o gatilho é acionado, o fluxo de trabalho de exemplo é executado e envia um email semelhante a este exemplo:
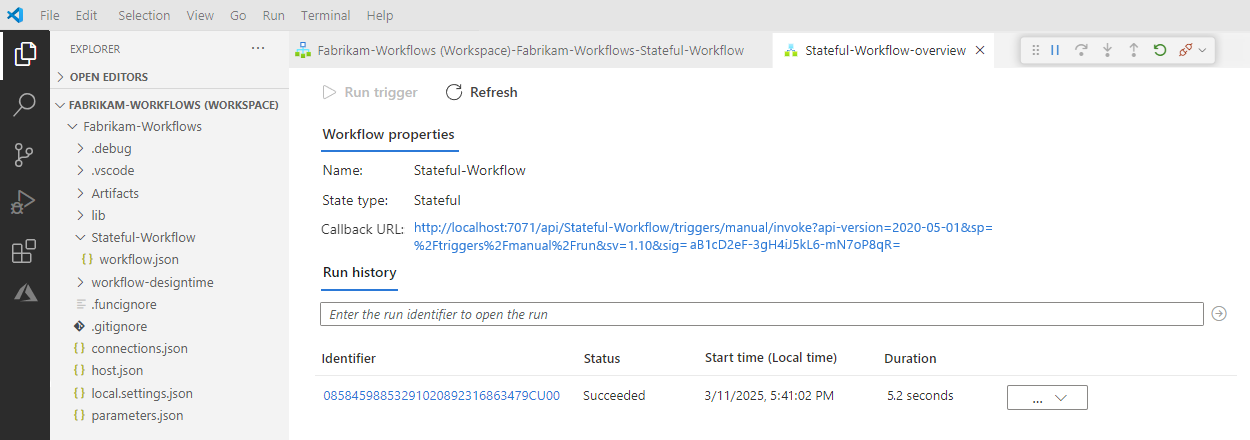
No Visual Studio Code, retorne à página de visão geral do fluxo de trabalho. Em Histórico de execuções, verifique o status da execução do fluxo de trabalho.
Observação
Se o status de execução não for exibido, tente atualizar a página visão geral selecionando Atualizar. Uma execução não acontece para um gatilho ignorado devido a critérios não atendidos ou por não encontrar dados.
Importante
No Histórico de execução, nenhum dado de histórico de execução do fluxo de trabalho será exibido se o aplicativo lógico for interrompido. Verifique se o aplicativo lógico ainda está em execução para exibir os dados do histórico de execução do fluxo de trabalho.
A seguinte tabela mostra os possíveis status finais que cada execução de fluxo de trabalho pode ter e mostrar no Visual Studio Code:
Status da execução Descrição Anulado A execução foi interrompida ou não foi concluída devido a problemas externos, como uma interrupção do sistema ou uma assinatura do Azure vencida. Cancelado A execução foi disparada e iniciada, mas recebeu uma solicitação de cancelamento. Com falha Falha em pelo menos uma ação na execução. Não foi configurada nenhuma ação subsequente no fluxo de trabalho para lidar com a falha. Executando A execução foi disparada e está em andamento, mas esse status também pode aparecer para uma execução restrita devido a limites de ação ou ao plano de preços atual.
Dica: ao configurar o log de diagnósticos, é possível receber informações sobre os eventos de restrição que ocorrerem.Êxito A execução foi bem-sucedida. Se alguma ação falhou, uma ação subsequente no fluxo de trabalho lidou com essa falha. Tempo Limite A execução atingiu o tempo limite porque a duração atual excedeu o limite de duração da execução, que é controlado pela configuração chamada Retenção do histórico de execução em dias. A duração de uma execução é calculada usando a hora de início e o limite de runtime na hora de início. Observação: se o runtime também exceder o limite de retenção do histórico de execução atual, que também é controlado pela configuração Retenção do histórico de execução em dias, a execução será desmarcada do histórico de execuções por um trabalho de limpeza diário. Se a execução atingir o tempo limite ou for concluída, o período de retenção será calculado usando a hora de início e o limite de retenção atual da execução. Assim, ao reduzir o limite de duração de uma execução em andamento, a execução atingirá o tempo limite. No entanto, a execução permanecerá ou será limpa do histórico de execuções com base em se a duração da execução excedeu o limite de retenção.
Aguardando A execução ainda não foi iniciada ou está em pausa, por exemplo, devido a uma instância de fluxo de trabalho anterior que ainda está em execução. Para exibir o status, as entradas e as saídas de cada etapa para uma execução de fluxo de trabalho específica, escolha uma das etapas:
Na coluna Identificador , selecione a ID de execução do fluxo de trabalho.
Ao lado da coluna Duração, abra o menu de reticências (...) para uma execução de fluxo de trabalho e selecione Mostrar execução, por exemplo:
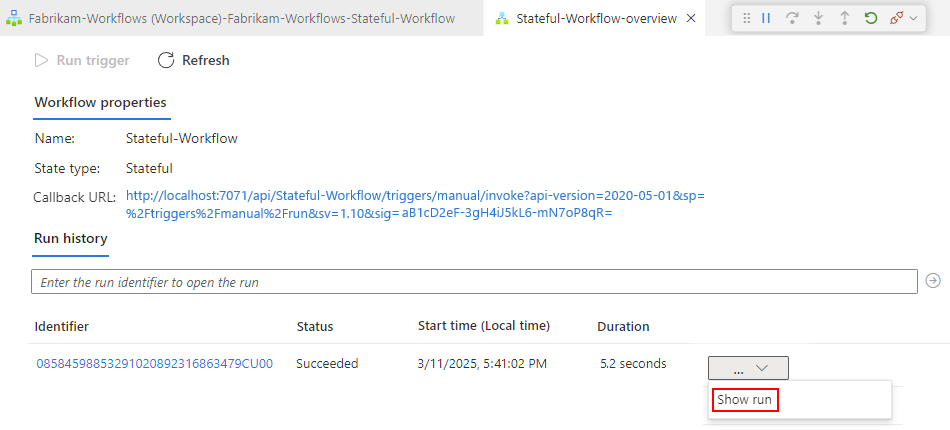
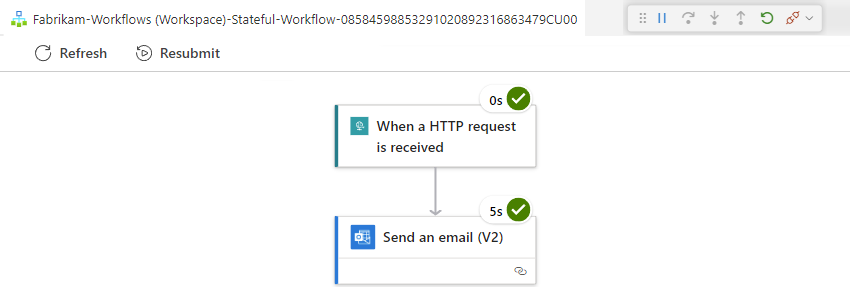
O Visual Studio Code abre a exibição de detalhes da execução e mostra o status de cada etapa na execução do fluxo de trabalho.
Observação
Se uma execução falhar e uma etapa na exibição de detalhes da execução mostrar o erro 400 Solicitação Inválida, esse problema poderá resultar de um nome de gatilho ou nome de ação mais longo que faz com que o URI (Uniform Resource Identifier) subjacente exceda o limite de caracteres padrão. Para saber mais, confira "400 Solicitação Incorreta".
A seguinte tabela mostra os possíveis status que cada execução de fluxo de trabalho pode ter e mostrar no Visual Studio Code:
Status da ação Descrição Anulado A ação foi interrompida ou não foi concluída devido a problemas externos, como uma interrupção do sistema ou uma assinatura do Azure vencida. Cancelado A ação estava em execução, mas recebeu uma solicitação para cancelar. Com falha Falha na ação. Executando A ação está em execução no momento. Ignorado A ação foi ignorada porque a ação imediatamente anterior falhou. Uma ação tem uma condição runAfterque requer que a ação anterior seja concluída com êxito antes que a ação atual possa ser executada.Êxito A ação foi bem-sucedida. Êxito com novas tentativas A ação foi concluída, mas somente após uma ou mais tentativas. Para examinar o histórico de novas tentativas na exibição de informações do histórico de execuções, selecione essa ação para exibir as entradas e saídas. Tempo Limite A ação foi interrompida devido ao tempo limite especificado pelas configurações dessa ação. Aguardando Aplica-se a uma ação de webhook aguardando uma solicitação de entrada de um chamador. Para exibir as entradas e saídas de cada etapa, selecione a etapa desejada, por exemplo:
Para exibir as entradas e saídas brutas, selecione Mostrar entradas brutas ou Mostrar saídas brutas.
Para interromper a sessão de depuração, no menu Executar, selecione Parar Depuração (Shift+F5).
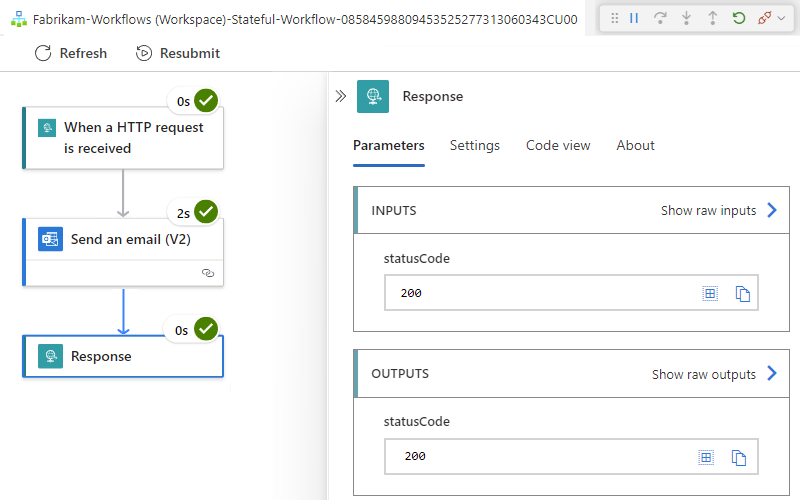
Retornar uma resposta
Quando você tem um fluxo de trabalho que começa com o gatilho Quando uma solicitação HTTP é recebida, seu fluxo de trabalho pode retornar uma resposta ao chamador que enviou a solicitação inicial usando a ação Solicitação chamada Resposta.
No designer de fluxo de trabalho, na ação Enviar um email , siga estas etapas gerais para adicionar a ação Solicitação chamada Resposta.
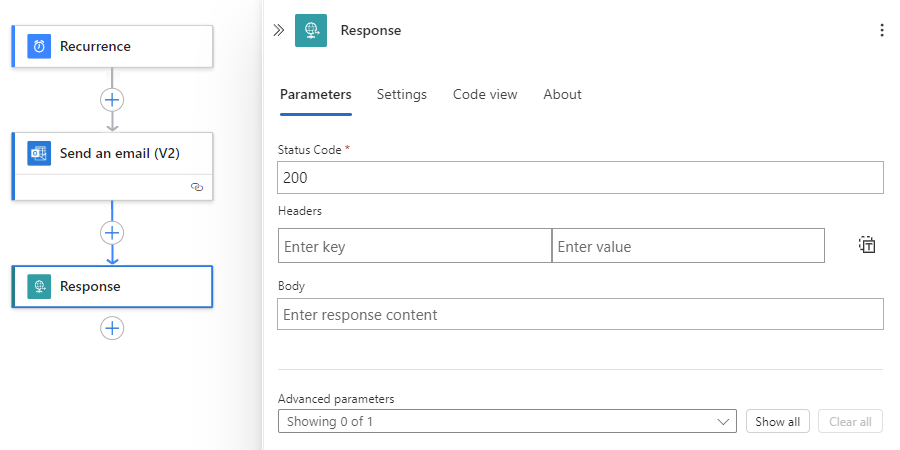
No painel de informações da ação Resposta , na guia Parâmetros, forneça as informações necessárias para resposta ao chamador.
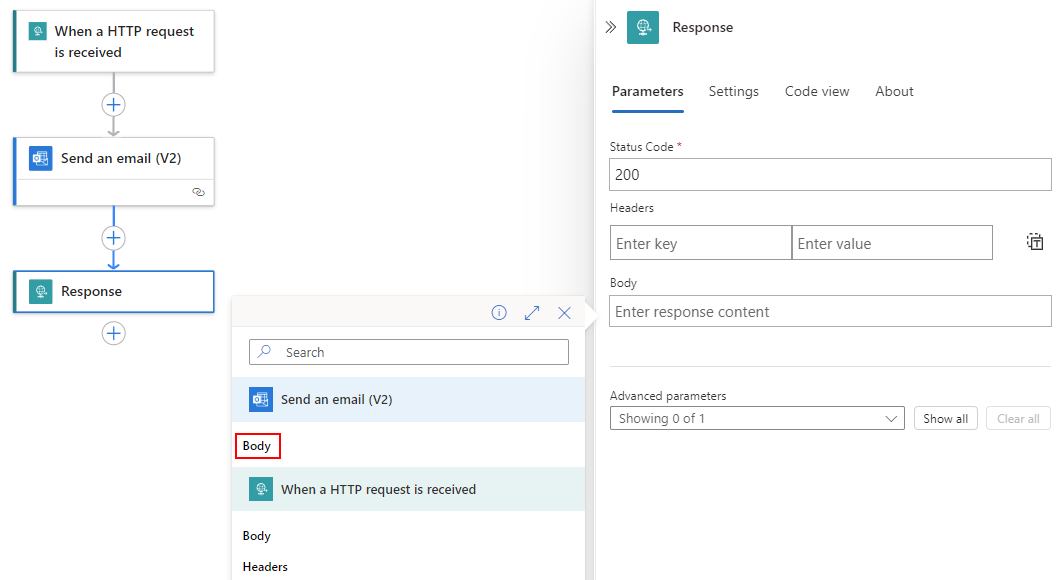
Este exemplo retorna o valor do parâmetro Corpo, que é a saída da ação de Enviar um email.
Para o parâmetro Corpo, selecione dentro da caixa de edição e selecione o ícone de relâmpago, que abre a lista de conteúdo dinâmico. Esta lista mostra os valores de saída disponíveis do gatilho e ações anteriores no fluxo de trabalho.
Na lista conteúdo dinâmico, em Enviar um email, selecione Corpo.
Quando terminar, a propriedade Corpo da Ação de Resposta agora está definida como o valor de saída Corpo da Ação Enviar um email, por exemplo:
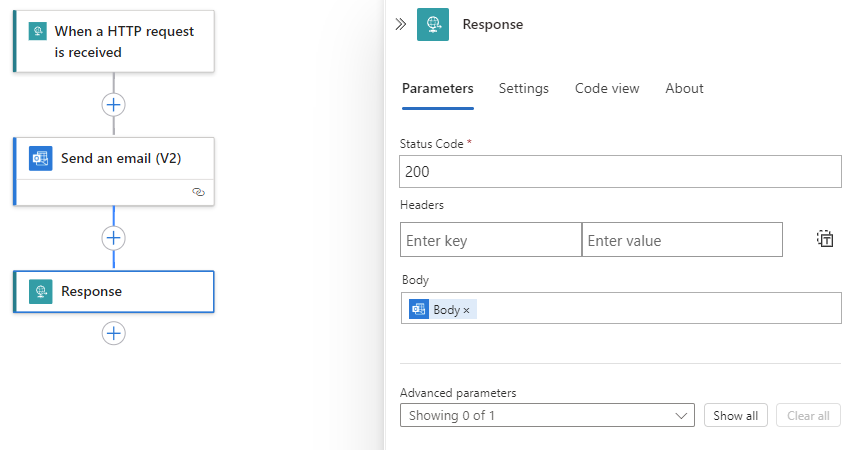
Salve seu fluxo de trabalho.
Reteste seu fluxo de trabalho
Para testar suas atualizações, você pode executar novamente o depurador e enviar outra solicitação que dispara seu fluxo de trabalho, semelhante às etapas em Executar, depurar e testar fluxos de trabalho localmente.
Na barra de ferramentas do Visual Studio Code, no menu Executar e selecione Iniciar Depuração (F5).
Em sua ferramenta para criar e enviar solicitação, envie outra solicitação para disparar seu fluxo de trabalho.
Na página de visão geral do fluxo de trabalho, em Histórico de execuções, verifique o status da execução mais recente e abra a exibição de detalhes da execução.
Por exemplo, aqui está o status passo a passo para uma execução depois que o fluxo de trabalho de exemplo foi atualizado com a ação Resposta .
Para interromper a sessão de depuração, no menu Executar, selecione Parar Depuração (Shift+F5).
Preparar para a implantação
Antes de implantar seu aplicativo lógico Standard no portal do Azure, examine esta seção para obter qualquer preparação que você precise fazer.
Configurar o acesso ao firewall
Se o ambiente tiver requisitos de rede estritos ou firewalls que limitem o tráfego, você precisará configurar permissões para todas as conexões criadas pelos conectores gerenciados, hospedados e compartilhados do Azure e usadas em seu fluxo de trabalho.
Para localizar os FQDNs (nomes de domínio totalmente qualificados) dessas conexões, siga estas etapas:
Em seu projeto de aplicativo lógico, abra o arquivo local.settings.json .
Para cada conexão que você criou, localize a propriedade nomeada
<connection-name>-ConnectionRuntimeUrl, que usa a seguinte sintaxe:"<connection-name>-ConnectionRuntimeUrl": <connection-runtime-URL>Por exemplo, suponha que você tenha um arquivo delocal.settings.json de exemplo que contenha essas conexões: uma conexão do Office 365 e uma conexão AS2. Essas conexões usam os seguintes valores de exemplo para as
<connection-name>-ConnectionRuntimeUrlpropriedades:Office 365:
"office365-ConnectionRuntimeUrl": https://A1bC2dE3fH4iJ5kL6mN7oP8qR9sT0u.00.common.logic-<Azure-region>.azure-apihub.net/apim/office365/a0a0a0a0-bbbb-cccc-dddd-e1e1e1e1e1e1"AS2:
"as2-ConnectionRuntimeUrl": https://A1bC2dE3fH4iJ5kL6mN7oP8qR9sT0u.00.common.logic-<Azure-region>.azure-apihub.net/apim/as2/b1b1b1b1-cccc-dddd-eeee-f2f2f2f2f2f2
O arquivo local.settings.json de exemplo é parecido com a versão seguinte:
{
   "IsEncrypted": false,
   "Values": {
      "AzureWebJobsStorage": "UseDevelopmentStorage=true",
      "FUNCTIONS_WORKER_RUNTIME": "node",
      "APP_KIND": "workflowapp",
      "ProjectDirectoryPath": "c:\\Users\\<local-username>\\Desktop\\Visual Studio Code projects\\Azure Logic Apps\fabrikam-workflows\\Fabrikam-Workflows\\Fabrikam-Workflows",
      "WORKFLOWS_TENANT_ID": "<Microsoft-Entra-tenant-ID>",
      "WORKFLOWS_SUBSCRIPTION_ID": "<Azure-subscription-ID>",
      "WORKFLOWS_RESOURCE_GROUP_NAME": "Fabrikam-Workflows-RG",
      "WORKFLOWS_LOCATION_NAME": "westcentralus",
      "WORKFLOWS_MANAGEMENT_BASE_URI": "https://management.azure.com/",
      "as2-connectionKey": "<connection-key>",
      "as2-ConnectionRuntimeUrl": "https://A1bC2dE3fH4iJ5kL6mN7oP8qR9sT0u.00.common.logic-<Azure-region>.azure-apihub.net/apim/as2/b1b1b1b1-cccc-dddd-eeee-f2f2f2f2f2f2",
      "office365-connectionKey": "<connection-key>",
      "office365-ConnectionRuntimeUrl": "https://A1bC2dE3fH4iJ5kL6mN7oP8qR9sT0u.00.common.logic-<Azure-region>.azure-apihub.net/apim/office365/a0a0a0a0-bbbb-cccc-dddd-e1e1e1e1e1e1",
   }
}
Copie e salve essas URLs de runtime de conexão em algum lugar seguro para que você possa configurar o firewall com essas informações.
Quando estiver pronto, configure o firewall usando as URLs salvas. Para saber mais, confira a seguinte documentação:
Publicar no Azure
Para implantar seu aplicativo lógico Standard do Visual Studio Code, você pode publicar diretamente seu projeto no Azure. Você pode publicar seu aplicativo lógico como um novo recurso, que cria automaticamente todos os recursos necessários, como uma conta de armazenamento do Azure, semelhante aos requisitos do aplicativo de funções. Ou você pode publicar seu aplicativo lógico em um recurso de aplicativo lógico Standard implantado anteriormente, que substitui a versão implantada.
A implantação para o recurso de aplicativo lógico (Standard) requer um plano de hospedagem e um tipo de preço, que você seleciona durante a implantação. Para obter mais informações, confira Planos de hospedagem e tipos de preços.
Publicar em um novo recurso de aplicativo lógico Standard
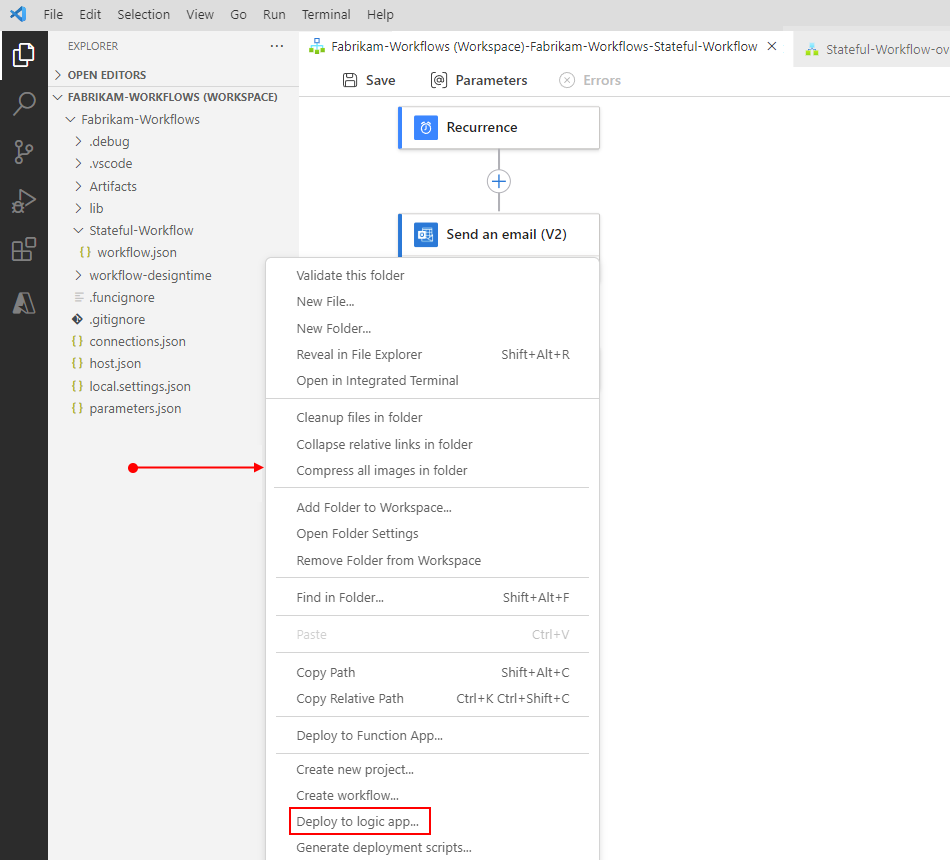
No painel Do Explorer, mova o ponteiro do mouse sobre qualquer área em branco abaixo das pastas e arquivos do projeto, abra o menu de atalho e selecione Implantar no aplicativo lógico.
Embora você não precise ter arquivos abertos para implantar, salve tudo o que planeja implantar.
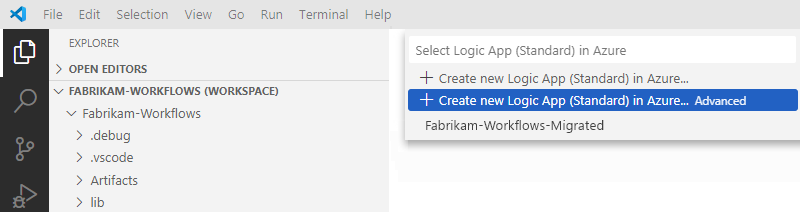
Você será solicitado com as seguintes opções para o recurso de aplicativo lógico Standard de destino. Você pode criar um novo aplicativo lógico Standard ou selecionar um aplicativo lógico Standard implantado existente no Azure:
- Criar Aplicativo Lógico (Standard) no Azure (rápido)
- Criar Aplicativo Lógico (Standard) no Azure Avançado
- Selecione entre os recursos do aplicativo lógico Standard implantados anteriormente, se houver algum.
Para as opções de implantação, selecione se deseja criar ou usar um recurso de aplicativo lógico de destino existente.
Este exemplo continua em Criar Aplicativo Lógico (Standard) no Azure Avançado.
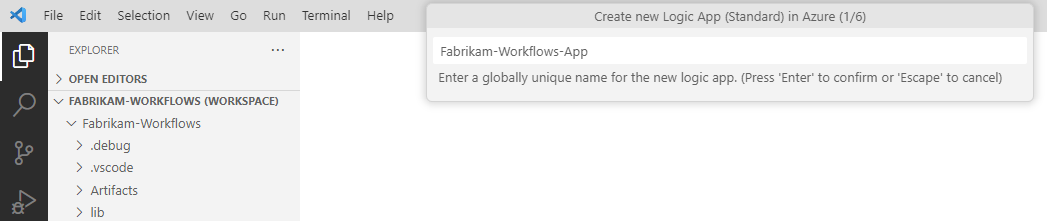
Siga estas etapas para criar o novo recurso de aplicativo lógico de destino:
Insira um nome global exclusivo para o aplicativo lógico de destino.
Este exemplo usa Fabrikam-Workflows-App.
Para o local onde implantar, selecione a região do Azure.
Este exemplo usa Centro-Oeste dos EUA.
Para o plano de hospedagem, escolha entre as seguintes opções:
Plano de hospedagem Descrição Fluxo de trabalho Standard Implantar como um novo recurso de aplicativo lógico Standard hospedado nos Aplicativos Lógicos do Azure de locatário único. Híbridos Implante como um aplicativo lógico Standard hospedado em sua própria infraestrutura.
Observação: antes de selecionar essa opção, verifique se você configurou a infraestrutura necessária. Para obter mais informações, consulte Configurar sua própria infraestrutura para aplicativos lógicos Standard usando a implantação híbrida.Para o plano do Serviço de Aplicativo do Windows, escolha uma das seguintes opções:
- Criar um novo plano do Serviço de Aplicativo
- Selecione entre os planos existentes do Serviço de Aplicativo na região do Azure selecionada (somente planos baseados no Windows), se houver algum.
Este exemplo seleciona Criar novo plano do Serviço de Aplicativo.
Para o novo plano, forneça um nome global exclusivo e selecione um tipo de preço.
Este exemplo usa Fabrikam-Workflows-App-Service-Plan e seleciona a camada Padrão do Fluxo de Trabalho WS1 .
Para obter mais informações, confira Planos de hospedagem e tipos de preços.
Para o grupo de recursos do Azure de destino, selecione o mesmo grupo de recursos que o projeto para obter um desempenho ideal.
Este exemplo usa o mesmo grupo criado anteriormente chamado Fabrikam-Workflows-RG.
Observação
Embora você possa criar ou usar um grupo de recursos diferente, isso pode afetar o desempenho. Se você criar ou escolher um grupo de recursos diferente, mas cancelar após aparecer o prompt de confirmação, sua implantação também será cancelada.
Para que a conta de armazenamento do Azure use com fluxos de trabalho que permitem salvar informações de histórico de execução, escolha entre as seguintes opções:
- Criar uma nova conta de armazenamento
- Selecione entre as contas de armazenamento existentes do Azure, se houver.
Este exemplo seleciona Criar nova conta de armazenamento.
Insira um nome global exclusivo para a conta de armazenamento. Você pode usar apenas letras minúsculas e números.
Este exemplo usa fabrikamstorageaccount<número>.
Para a opção de usar o armazenamento SQL neste exemplo, selecione Não.
Se você já configurou um banco de dados SQL a ser usado para armazenamento seguindo Configurar o armazenamento do banco de dados SQL para fluxos de trabalho do aplicativo lógico Standard, selecione Sim.
Para o recurso do Application Insights, que permite o registro em log de diagnóstico e rastreamento para seu aplicativo lógico, escolha entre as seguintes opções:
- Criar um novo recurso do Application Insights
- Ignorar por enquanto. Você pode configurar o Application Insights após a implantação.
- Selecione um recurso existente do Application Insights, se houver algum.
Este exemplo seleciona Ignorar por enquanto.
Observação
Se você tiver um recurso do Application Insights que deseja usar, poderá selecionar esse recurso.
Para criar um novo recurso do Application Insights neste momento para habilitar o registro em log e rastreamento de diagnóstico, consulte Habilitar o Application Insights durante a implantação.
Para obter mais informações sobre o Application Insights, consulte a seguinte documentação:
Depois de selecionar Ignorar por enquanto ou um recurso existente do Application Insights, o Visual Studio Code mostra uma mensagem de confirmação para iniciar a implantação. A mensagem também recomenda que, para obter o melhor desempenho, coloque os recursos de conexão para operações gerenciadas no mesmo grupo de recursos que o recurso de aplicativo lógico e os fluxos de trabalho. Nos Aplicativos Lógicos do Azure, as conexões de operação gerenciada existem como recursos individuais do Azure.
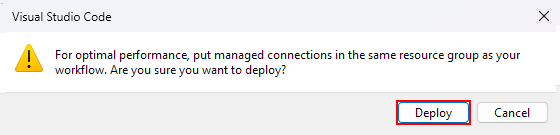
Quando estiver pronto para implantar, na mensagem de confirmação, selecione Implantar.
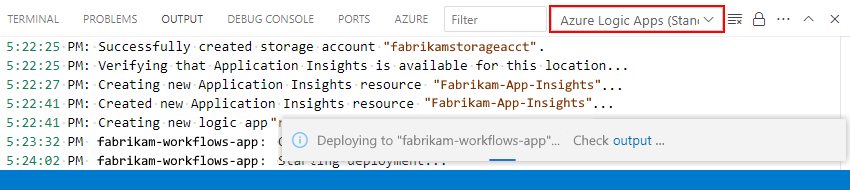
O Visual Studio Code começa a criar e implantar os recursos necessários para publicar seu aplicativo lógico no Azure.
Para exibir e monitorar o processo de implantação, no menu Exibir , selecione Saída.
Na barra de ferramentas da janela de Saída, na lista de escopos, selecione Azure Logic Apps (Standard).
Quando o Visual Studio Code termina de implantar seu aplicativo lógico no Azure, uma mensagem é exibida que a criação do aplicativo lógico foi concluída com êxito, por exemplo:
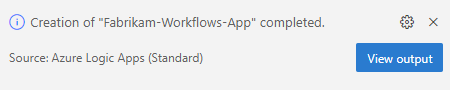
O recurso de aplicativo lógico e o fluxo de trabalho agora estão ativos, habilitados e em execução no Azure.
Habilitar o Application Insights durante a implantação
Para habilitar o log de diagnóstico e o rastreamento com o Application Insights durante a implantação do aplicativo lógico, siga estas etapas:
Selecione um recurso existente do Application Insights ou Criar um recurso do Application Insights.
No portal do Azure, vá para o recurso do Application Insights.
No menu de recursos, selecione Visão geral. Localize e copie o valor da Chave de Instrumentação.
No Visual Studio Code, na pasta raiz do projeto, abra o arquivo local.settings.json.
No objeto
Values, adicione a propriedadeAPPINSIGHTS_INSTRUMENTATIONKEYe defina o valor para a chave de instrumentação, por exemplo:{ "IsEncrypted": false, "Values": { "AzureWebJobsStorage": "UseDevelopmentStorage=true", "FUNCTIONS_WORKER_RUNTIME": "dotnet", "APPINSIGHTS_INSTRUMENTATIONKEY": <instrumentation-key> } }Verifique se o gatilho de fluxo de trabalho e os nomes de ação aparecem corretamente em sua instância do Application Insights.
No portal do Azure, vá para o recurso do Application Insights.
No menu de recursos, em Investigar, selecione Mapa de aplicativos.
Examine os nomes da operação que aparecem no mapa.
Algumas solicitações de entrada de gatilhos internos podem aparecer como duplicatas no Mapa do Aplicativo. Em vez de usar o formato
WorkflowName.ActionName, essas duplicatas usam o nome do fluxo de trabalho como o nome da operação e são originadas no host do Azure Functions.
Opcionalmente, ajuste o nível de severidade dos dados de rastreamento coletados e enviados pelo aplicativo lógico à instância do Application Insights.
Cada vez que ocorre um evento relacionado ao fluxo de trabalho, como quando um fluxo de trabalho é disparado ou quando uma ação é executada, o runtime emite vários rastreamentos. Esses rastreamentos cobrem o tempo de vida do fluxo de trabalho e incluem os seguintes tipos de evento, embora não se limitem a eles:
- Atividade de serviço, como iniciar, parar e erros.
- Atividade de trabalhos e dispatcher.
- Atividade de fluxo de trabalho, como gatilho, ação e execução.
- Atividade de solicitação de armazenamento, como êxito ou falha.
- Atividade de solicitação HTTP, como entrada, saída, êxito e falha.
- Qualquer rastreamento de desenvolvimento, como mensagens de depuração.
Cada tipo de evento é atribuído a um nível de severidade. Por exemplo, o nível
Tracecaptura as mensagens mais detalhadas, enquanto o nívelInformationcaptura a atividade geral no fluxo de trabalho, como quando o aplicativo lógico, o fluxo de trabalho, o gatilho e as ações são iniciados e interrompidos.A tabela a seguir descreve os níveis de severidade e seus tipos de rastreamento:
Nível de gravidade Tipo de rastreamento Crítico Logs que descrevem uma falha irrecuperável no fluxo de trabalho do aplicativo lógico. Depurar Logs que você pode usar para investigação durante o desenvolvimento, por exemplo, chamadas HTTP de entrada e saída. Erro Logs que indicam uma falha na execução do fluxo de trabalho, mas não uma falha geral em seu aplicativo lógico. Informações Logs que acompanham a atividade geral em seu aplicativo lógico ou fluxo de trabalho, por exemplo:
– Quando um gatilho, uma ação ou uma execução começa e termina.
– Quando o aplicativo lógico começa ou termina.Rastreamento Logs que contêm as mensagens mais detalhadas, por exemplo, solicitações de armazenamento ou atividade do dispatcher, além de todas as mensagens relacionadas à atividade de execução do fluxo de trabalho. Aviso Logs que realçam um estado anormal em seu aplicativo lógico, mas não impedem sua execução. Para definir o nível de severidade, no nível raiz do seu projeto, abra o arquivo host.json e localize o objeto
logging. Esse objeto controla a filtragem de log de todos os fluxos de trabalho em seu aplicativo lógico e segue o layout de ASP.NET Core para a filtragem de tipo de log.{ "version": "2.0", "logging": { "applicationInsights": { "samplingExcludedTypes": "Request", "samplingSettings": { "isEnabled": true } } } }Se o objeto
loggingnão contiver um objetologLevelque inclua a propriedadeHost.Triggers.Workflow, adicione esses itens. Defina a propriedade com o nível de severidade para o tipo de rastreamento desejado, por exemplo:{ "version": "2.0", "logging": { "applicationInsights": { "samplingExcludedTypes": "Request", "samplingSettings": { "isEnabled": true } }, "logLevel": { "Host.Triggers.Workflow": "Information" } } }
Tarefas pós-implantação
As seções a seguir descrevem as tarefas a serem executadas após a conclusão da implantação do aplicativo lógico.
Confirmar implantação no portal do Azure
Depois de implantar seu aplicativo lógico do Visual Studio Code no portal do Azure, confirme se seu aplicativo lógico aparece no portal. Os recursos do Azure são organizados e agrupados no portal com base em seu tipo de recurso. Para localizar aplicativos lógicos Standard, siga estas etapas:
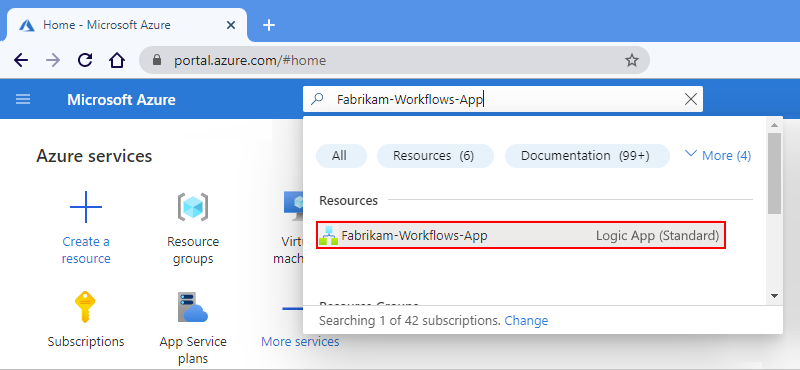
Entre no portal do Azure com sua conta do Azure.
Na caixa de pesquisa de título do Azure, insira o nome do aplicativo lógico, que deve aparecer como resultado na seção Recursos . Selecione seu aplicativo lógico para abrir o recurso.
No menu do aplicativo lógico, em Fluxos de trabalho, selecione Fluxos de trabalho.
Na página Fluxos de Trabalho , selecione seu fluxo de trabalho.
No menu de fluxo de trabalho, em Ferramentas, selecione Designer. Confirme se o fluxo de trabalho aparece conforme o esperado.
Agora você pode fazer alterações nesse fluxo de trabalho no portal do Azure.
Habilite a experiência de monitoramento para seu aplicativo lógico implantado para que você possa exibir o histórico de execução de fluxo de trabalho, entradas, saídas e outras informações relacionadas.
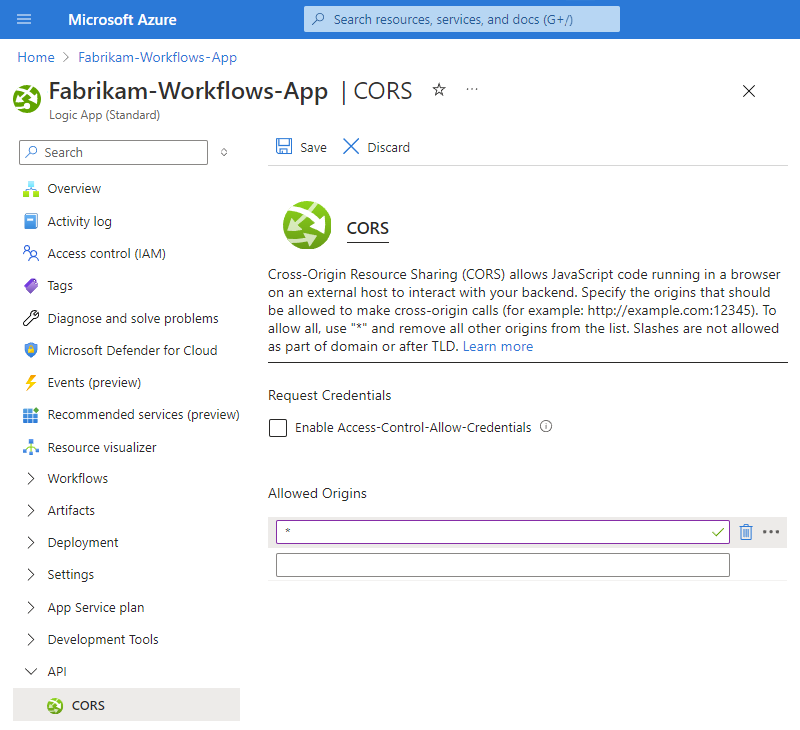
Habilitar a experiência de monitoramento para o aplicativo lógico implantado
Antes de examinar qualquer histórico de execução de fluxo de trabalho, entradas, saídas e informações relacionadas para um recurso de aplicativo lógico Standard implantado com a experiência de monitoramento no portal do Azure, você deve primeiro habilitar essa experiência no recurso de aplicativo lógico.
No portal do Azure, abra o recurso de aplicativo lógico Standard implantado.
No menu de recursos, em API, selecione CORS.
No painel CORS, em Origens Permitidas, adicione o caractere curinga (*).
Quando terminar, na barra de ferramentas CORS, selecione Salvar.
Após a implantação, habilite ou abra o Application Insights
Durante a execução do fluxo de trabalho, o fluxo de trabalho do aplicativo lógico emite telemetria junto com outros eventos. Você pode usar essa telemetria para obter melhor visibilidade sobre o quão bem seu fluxo de trabalho é executado e como o runtime dos Aplicativos Lógicos do Azure funciona. O Application Insights fornece a capacidade de habilitar o registro em log de diagnóstico, rastreamento e monitoramento para seu aplicativo lógico usando telemetria quase em tempo real (métricas dinâmicas). Essa funcionalidade ajuda você a investigar falhas e problemas de desempenho com mais facilidade ao usar os dados de telemetria para diagnosticar problemas, configurar alertas e criar gráficos.
Se você não tiver configurado anteriormente o Application Insights, poderá habilitar essa funcionalidade no portal do Azure após a implantação do aplicativo lógico do Visual Studio Code. Você precisa ter um recurso do Application Insights no Azure, mas pode criar esse recurso separadamente com antecedência ou quando habilitar essa funcionalidade após a implantação.
Se você configurou anteriormente o Application Insights durante a implantação do Visual Studio Code, basta abrir o recurso do Application Insights no seu aplicativo lógico no portal do Azure.
Habilitar o Application Insights para um aplicativo lógico implantado
No portal do Azure, localize e abra seu aplicativo lógico implantado.
No menu do aplicativo lógico, em Monitoramento, selecione Application Insights.
Na página Application Insights, selecione Ativar Application Insights.
Depois que a página do Application Insights for atualizada, na seção Alterar seu recurso , selecione entre as seguintes opções:
Criar novo recurso
O Azure cria recursos para o Application Insights e um workspace do Log Analytics usando a assinatura e o grupo de recursos atuais. Se você quiser usar uma assinatura e um grupo de recursos diferentes, consulte Criar um novo recurso do Application Insights e, em seguida, retorne a esta página.
Propriedade Descrição Novo nome do recurso Aceite o nome gerado ou forneça outro nome. Localidade Selecione uma região do Azure. Espaço de Trabalho do Log Analytics Selecione um workspace existente, se houver. Caso contrário, um workspace padrão será criado para você. Para obter mais informações, confira Visão geral do workspace do Log Analytics. Selecione o recurso existente:
Selecione a assinatura do Azure para seu recurso do Application Insights.
Selecione o seu recurso do Application Insights.
Quando terminar, na parte inferior da página, selecione Aplicar.
Abra o Application Insights em seu aplicativo lógico
No portal do Azure, localize e abra seu aplicativo lógico implantado.
No menu do aplicativo lógico, em Monitoramento, selecione Application Insights.
Na página do Application Insights, selecione o link para seu recurso do Application Insights.
Depois que o Application Insights for aberto, examine várias métricas para seu aplicativo lógico. Para obter mais informações, consulte estes artigos:
- Aplicativos Lógicos do Azure em Execução em Qualquer Lugar – Monitoramento com o Application Insights – parte 1
- Aplicativos Lógicos do Azure em Execução em Qualquer Lugar – Monitoramento com o Application Insights – parte 2
Solucionar problemas e erros
Falha ao abrir o designer
Ao tentar abrir o designer, você recebe esse erro "Não foi possível iniciar o tempo de design do fluxo de trabalho". Se você tentou abrir o designer anteriormente, mas descontinuou ou excluiu seu projeto, o pacote de extensão pode não ser baixado corretamente. Para verificar se esse motivo é a causa, siga estas etapas:
No Visual Studio Code, abra a janela Saída. No menu Exibir, selecione Saída.
Na lista da barra de título da janela de Saída, selecione Aplicativos Lógicos do Azure (Standard) para que você possa examinar a saída da extensão, por exemplo:

Examine a saída e verifique se esta mensagem de erro é exibida:
A host error has occurred during startup operation '<operation-ID>'.
System.Private.CoreLib: The file 'C:\Users\<user-name>\AppData\Local\Temp\Functions\
ExtensionBundles\Microsoft.Azure.Functions.ExtensionBundle.Workflows\1.1.7\bin\
DurableTask.AzureStorage.dll' already exists.
Value cannot be null. (Parameter 'provider')
Application is shutting down...
Initialization cancellation requested by runtime.
Stopping host...
Host shutdown completed.
Para resolver esse erro, exclua a pasta ExtensionBundles neste local ...\Users\<user-name>\AppData\Local\Temp\Functions\ExtensionBundles e tente abrir novamente o arquivo workflow.json no designer.
Os novos gatilhos e ações estão ausentes no seletor do designer para fluxos de trabalho criados anteriormente
Os Aplicativos Lógicos do Azure com locatário único dão suporte a ações internas para operações do Azure Functions, do Liquid e de XML, como Validação de XML e Transformação XML. No entanto, para aplicativos lógicos criados anteriormente, essas ações podem não aparecer no seletor do designer para que você selecione se o Visual Studio Code deve usar uma versão desatualizada do pacote de extensão, Microsoft.Azure.Functions.ExtensionBundle.Workflows.
Além disso, as ações e o conector Operações do Azure Function não aparecem no seletor de designer, a menos que você tenha habilitado ou selecionado Usar conectores do Azure quando criou seu aplicativo lógico. Se você não tiver habilitado os conectores implantados do Azure no momento da criação do aplicativo, poderá habilitá-los em seu projeto no Visual Studio Code. Abra o menu de atalho workflow.json e selecione Usar Conectores do Azure.
Para corrigir o pacote desatualizado, siga estas etapas para excluir o pacote desatualizado, que faz o Visual Studio Code atualizar automaticamente o pacote de extensão para a versão mais recente.
Observação
Essa solução se aplica apenas aos aplicativos lógicos que você cria e implanta usando o Visual Studio Code com a extensão dos Aplicativos Lógicos do Azure (Standard), não os aplicativos lógicos que você cria usando o portal do Azure. Confira Gatilhos e ações compatíveis ausentes do designer no portal do Azure.
Salve todos os trabalho que você não deseja perder e feche o Visual Studio Code.
No seu computador, navegue até a seguinte pasta, que contém pastas de versão para o pacote existente:
...\Users\<user-name>\.azure-functions-core-tools\Functions\ExtensionBundles\Microsoft.Azure.Functions.ExtensionBundle.WorkflowsExclua a pasta da versão do pacote anterior, por exemplo, se você tiver uma pasta da versão 1.1.3, exclua essa pasta.
Agora navegue até a seguinte pasta, que contém pastas de versão para o pacote NuGet existente:
...\Users\<user-name>\.nuget\packages\microsoft.azure.workflows.webjobs.extensionExclua a pasta de versão do pacote anterior.
Reabra o Visual Studio Code, seu projeto e o arquivo workflow.json no designer.
Os gatilhos e as ações ausentes agora aparecem no designer.
"400 Solicitação Incorreta" aparece em um gatilho ou em uma ação
Quando uma execução falha e você inspeciona a execução na exibição de monitoramento, esse erro pode aparecer em um gatilho ou ação que tenha um nome mais longo, o que faz com que o URI (Uniform Resource Identifier) subjacente exceda o limite de caracteres padrão.
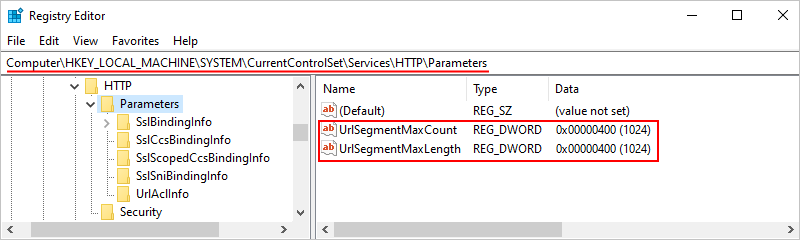
Para resolver esse problema e ajustar o URI para um comprimento maior, edite as chaves do Registro UrlSegmentMaxCount e UrlSegmentMaxLength em seu computador seguindo estas etapas. Os valores padrão dessas chaves são descritos neste artigo, Http.sys configurações do Registro para Windows.
Importante
Antes de começar, salve seu trabalho. Essa solução exige que você reinicie o computador depois de terminar para que as alterações entrem em vigor.
No computador, abra a janela Executar e execute o comando
regedit, que abre o editor do registro.Na caixa Controle de Conta de Usuário, selecione Sim para permitir suas alterações no computador.
No painel esquerdo, em Computador, expanda os nós ao longo do caminho, HKEY_LOCAL_MACHINE\SYSTEM\CurrentControlSet\Services\HTTP\Parameters e selecione Parâmetros.
No painel direito, localize as chaves do registro
UrlSegmentMaxCounteUrlSegmentMaxLength.Aumente esses valores de chave o suficiente para que os URIs possam acomodar os nomes que você deseja usar. Se essas chaves não existirem, adicione-as à pasta Parâmetros seguindo estas etapas:
No menu de atalho Parâmetros, selecione Novo>Valor DWORD (32 bits).
Na caixa de edição que aparece, insira
UrlSegmentMaxCountcomo o novo nome de chave.Abra o menu de atalho da nova chave e selecione Modificar.
Na caixa Editar Cadeia de Caracteres exibida, insira o valor da chave de Dados do valor desejado no formato hexadecimal ou decimal. Por exemplo,
400em hexadecimal é equivalente a1024em decimal.Para adicionar o valor da chave
UrlSegmentMaxLength, repita essas etapas.
Depois que você aumentar ou adicionar esses valores de chave, o editor do registro será semelhante a este exemplo:
Quando estiver pronto, reinicie o computador para que as alterações entrem em vigor.
Falha na inicialização da sessão de depuração
Ao tentar iniciar uma sessão de depuração, você obtém o erro "O erro existe depois de executar preLaunchTask "generateDebugSymbols"". Para resolver esse problema, edite o arquivo tasks.json em seu projeto para ignorar a geração de símbolos.
Em seu projeto, expanda a pasta.vscode** e abra o arquivo tasks.json .
Na seguinte tarefa, exclua a linha,
"dependsOn: "generateDebugSymbols", junto com a vírgula que termina a linha anterior, por exemplo:Antes:
 {
   "type": "func",
   "command": "host start",
   "problemMatcher": "$func-watch",
   "isBackground": true,
   "dependsOn": "generateDebugSymbols"
 }
Após:
 {
   "type": "func",
   "command": "host start",
   "problemMatcher": "$func-watch",
   "isBackground": true
 }