What is Azure Test Plans?
Azure DevOps Services | Azure DevOps Server 2022 - Azure DevOps Server 2019
Azure Test Plans offers powerful tools for driving quality and collaboration throughout the development process. This browser-based test management solution supports planned manual testing, user acceptance testing, exploratory testing, and stakeholder feedback.
Opomba
This article applies to Azure DevOps Services and Azure DevOps Server 2020 and later versions. Most of the information is valid for earlier on-premises versions, however, images show only examples for the latest version. Also, the user interface changed significantly with the release of Azure DevOps Server 2020. For an overview of the new interface and supported capabilities, see Navigate Test Plans.
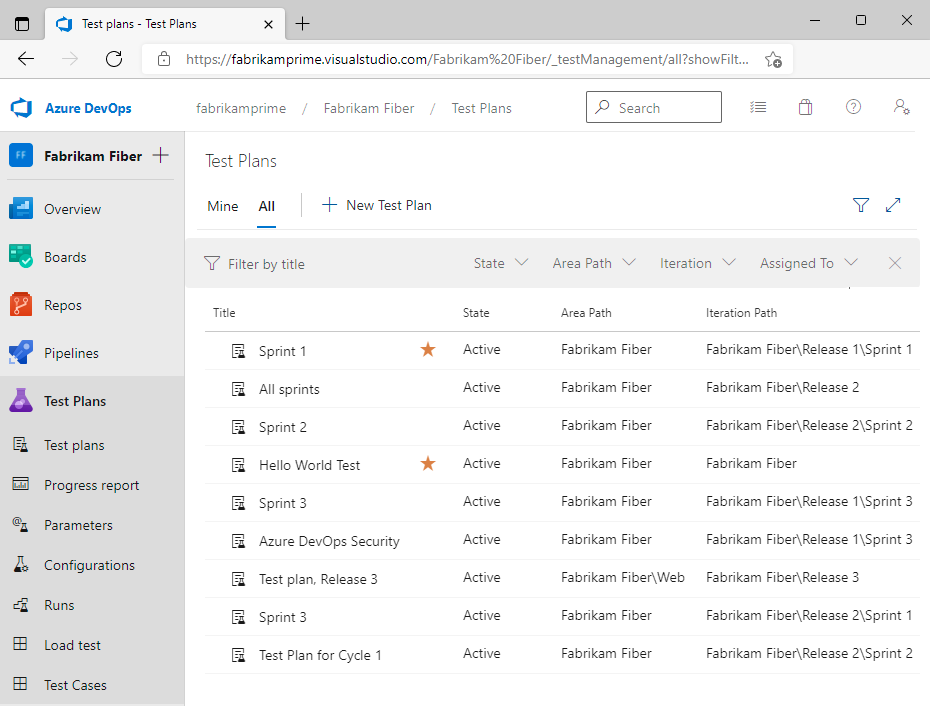
Through a combination of browser-based tools—Test plans, Progress report, Parameters, Configurations, Runs, and Test tools—and DevOps integration features, Azure Test Plans supports the following test objectives:
Perform manual and exploratory testing:
- Organize planned manual testing: Designate testers and test leads to organize tests into test plans and test suites.
- Conduct user acceptance testing: Designate user acceptance testers to verify that the delivered value meets customer requirements, reusing test artifacts created by engineering teams.
- Execute exploratory testing: Have developers, testers, UX teams, product owners, and others explore the software systems without using test plans or test suites.
- Gather stakeholder feedback: Engage stakeholders outside the development team, such as users from marketing and sales divisions, to carry out testing.
Automate testing: Integrate Azure Test Plans with Azure Pipelines to support testing within CI/CD. Associate test plans and test cases with build or release pipelines. Add pipeline tasks to capture and publish test results. Review test results via built-in progress reports and pipeline test reports.
Ensure traceability: Link test cases and test suites to user stories, features, or requirements for end-to-end traceability. Automatically link tests and defects to the requirements and builds being tested. Add and run tests from the board or use the Test plans hub for larger teams. Track testing of requirements with pipeline results and the Requirements widget.
Track reporting and analysis: Monitor test results and progress with configurable tracking charts, test-specific widgets for dashboards, and built-in reports such as Progress reports, pipeline test result reports, and the Analytics service.
Opomba
Load and performance testing: While Azure DevOps cloud-based load testing service is deprecated, Azure Load Testing is available. Azure Load Testing is a fully managed load testing service that enables you to use existing Apache JMeter scripts to generate high-scale load. For more information, see What is Azure Load Testing?. For more information about the deprecation of Azure DevOps load testing, see Changes to load test functionality in Visual Studio and cloud load testing in Azure DevOps.
Azure Test Plans provides software development teams the following benefits.
Test on any platform: With the Test Plans web portal, you can use any supported browser to access all the manual testing capabilities. It enables you to create and run manual tests through an easy-to-use, browser-based interface that users can access from all major browsers on any platform.
Rich diagnostic data collection: Using the web-based Test Runner and Test Runner client you can collect rich diagnostic data during your manual tests. This data includes screenshots, an image action log, screen recordings, code coverage, IntelliTrace traces, and test impact data for your apps under test. This data is automatically included in all the bugs you create during test, making it easy for developers to reproduce the issues.
End to End traceability: Azure DevOps provides end-to-end traceability of your requirements, builds, tests, and bugs with linking work items to other objects. Users can track their requirement quality from cards on the board. Bugs created while testing are automatically linked to the requirements and builds being tested, which helps you track the quality of the requirements or builds.
Integrated analytics: The Analytics service provides data that feeds into built-in reports, configurable dashboard widgets, and customizable reports using Power BI. Data tracks test plan progress and trends for both manual and automated tests. Test analytics provides near real-time visibility into test data for builds and releases. Teams can act on this data to improve test collateral to help maintain healthy pipelines.
Extensible platform. You can combine the tools and technologies you already know with the development tools that work best for you to integrate with and extend Azure DevOps. Use the REST APIs and contribution model available for the Test platform to create extensions that provide the experience you need for your test management lifecycle.
Access to Azure DevOps web portal features are managed through access levels assigned to users. The three main access levels are Stakeholder, Basic, and Basic+Test plans as described in About access levels. The following table indicates the access-level required to exercise the associated tasks with Azure Test Plans. In addition to access levels, select features require permissions to execute. For more information, see Manual test access and permissions.
Scenario and tasks
Stakeholder
Basic
Basic +Test Plans
Test planning
- Create test plans and test suites
- Manage test plan run settings
- Manage configurations
✔️
Test execution
- Run tests on any platform (Windows, Linux, Mac) with Test Runner
✔️
✔️
Perform exploratory testing with the Test & Feedback extension
✔️
✔️
✔️
Analyze and review tests
- Create charts with various pivots like priority, configuration, etc., to track test progress
- Browse test results
- Export test plans and test suites for review
- User Acceptance Testing – Assign tests and invite by email
✔️
✔️
To support manual and exploratory testing, Azure Test Plans uses test-specific work item types to plan and author tests. In addition, it provides two test tools to support running tests. The Test plans, Parameters, and Configurations hubs provide the tools to efficiently create and manage test items, their settings, and configurations. Test suites can be dynamic—requirements-based-suites and query-based-suites—to help you understand the quality of associated requirements under development, or static to help you cover regression tests.
The work item types—Test Plans, Test Suites, Test Cases, Shared Steps, and Shared Parameters—support several explicit links to support requirements tracking and sharing test steps and data across many test cases. Test cases can be assigned as manual or automated. For a description of each of these test items, see Test objects and terms.
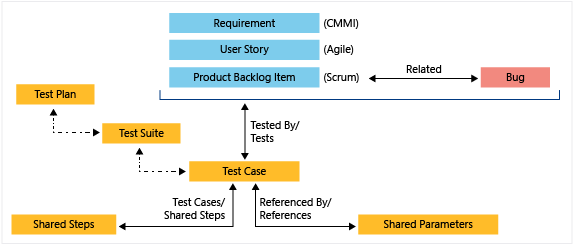
In Azure DevOps, the relationship between a test result, test run, and a test case can be understood as follows:
- Test case: A specific scenario or set of steps designed to validate a particular feature or functionality.
- Test run: An instance where one or more test cases are executed. Each test run can include multiple test cases.
- Test result: The outcome of a test run. Each test case within a test run has its own test result, indicating whether it passed or failed.
Opomba
With Azure DevOps Server 2020 and later versions, you can perform automated tests by adding test tasks to pipelines. Defining test plans, test cases, and test suites isn't required when test tasks are used.
You create and manage test plans and test suites from the Test plans hub. Add one or more test suites—static, requirement-based, or query-based—to the test plans. Export and share test plans and test suites with your teams. To learn how, see Create test plans and test suites and Copy or clone test plans, test suites, and test cases.
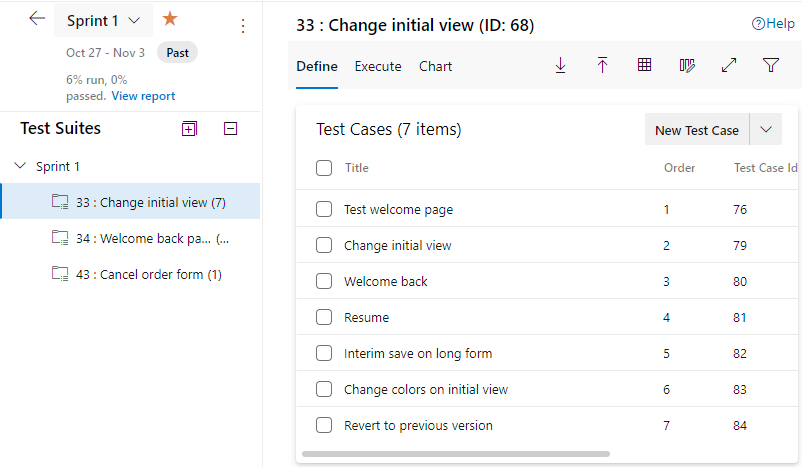
You define manual test cases by defining the test steps and optionally the test data to reference. Test suites consist of one or more test cases. You can share test cases within test suites. The Grid view for defining test cases supports copy, paste, insert, and delete operations. Quickly assign single or multiple testers to execute tests. View test results and references to a test case across test suites. To learn how, see Create test cases.
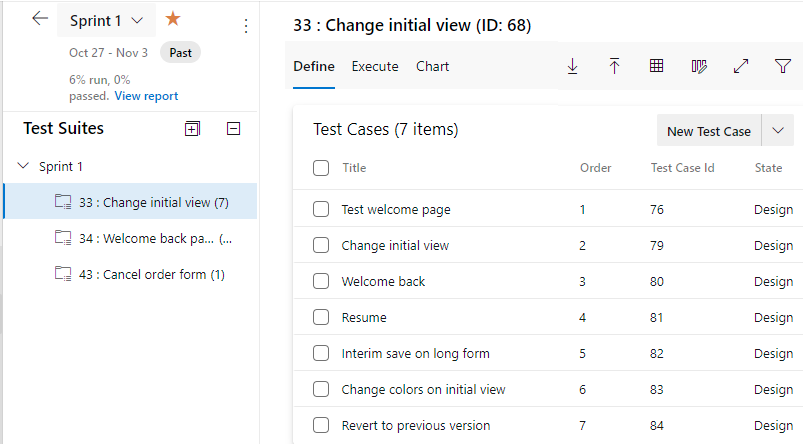
Within each test case, you specify a set of test steps with their expected outcomes. Optionally, you can add shared steps or shared parameters. For traceability, link test cases to the user stories, features, or bugs that they test.
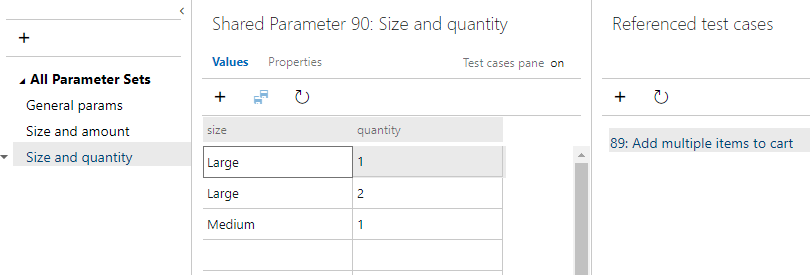
Use the Parameters hub, to define and manage parameters shared across test cases. Shared parameters provide support for repeating manual tests several times with different test data. For example, if your users can add different quantities of a product to a shopping cart, then you want to check that a quantity of 200 works and a quantity of 1.
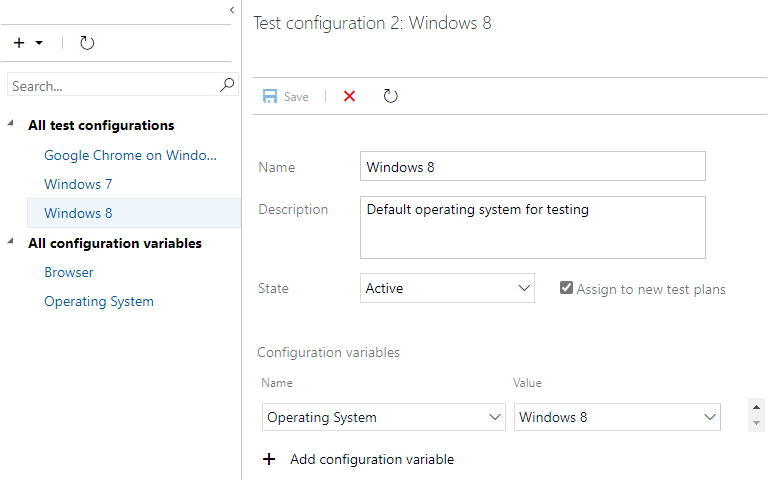
With the Configurations hub, teams can define, review, and manage test configurations and variables referenced by test plans. Test configurations provide support for testing your applications on different operating systems, web browsers, and versions. As with shared parameters, test configurations can be shared across multiple test plans.
With the following tools, developers, testers, and stakeholders can initiate tests and capture rich data as they execute tests and automatically log code defects linked to the tests. Test your application by executing tests across desktop or web apps.
- Test Runner: A browser-based tool for testing web applications and a desktop client version for testing desktop applications that you launch from the Test plans hub to run manual tests. Test Runner supports rich data collection while performing tests, such as image action log, video recording, code coverage, etc. It also allows users to create bugs and mark the status of tests.
- Test & Feedback extension: A free extension to support exploratory testing that you access from Chrome, Microsoft Edge, or Firefox browsers. The extension captures interactions with the application being explored through images or video and entering verbal or type-written comments. Information is captured in the Feedback Response work item type to help track response data.
You can perform the following tasks using the indicated tools.
| Task | Test plans hub | Test Runner | Test & Feedback extension |
|---|---|---|---|
| Bulk mark tests | ✔️ | ||
| Pass or fail tests or test steps | ✔️ | ✔️ | |
| Inline changes to tests during execution | ✔️ | ✔️ | |
| Pause and resume tests | ✔️ | ✔️ | |
| File bugs during test execution | ✔️ | ✔️ | |
| Capture screenshots, image action log, and screen recording during test execution | ✔️ | ✔️ | |
| Update existing bugs during test execution | ✔️ | ✔️ | |
| Verify bugs | ✔️ | ✔️ | |
| Assign a build for the test run | ✔️ | ||
| Assign test settings | ✔️ | ||
| Review test runs | ✔️ |
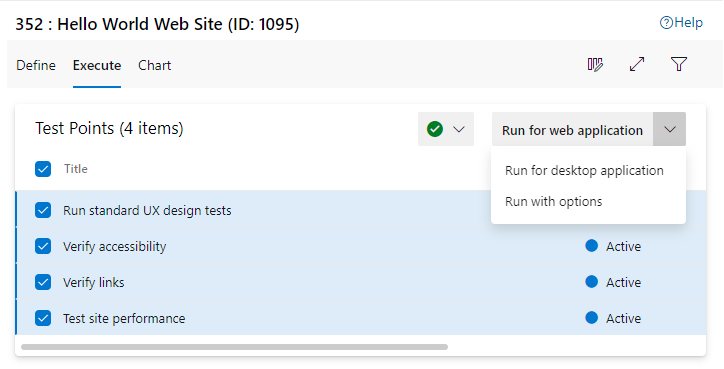
From the Test plans hub, Execute tab, team members can initiate test execution for one or more test cases defined for a test suite. Choices include running Test Runner for a web or desktop application. Optionally, team members can select Run with options to choose other supported clients for manual testing, or to select a build for automated testing. For more information, see Run manual tests.
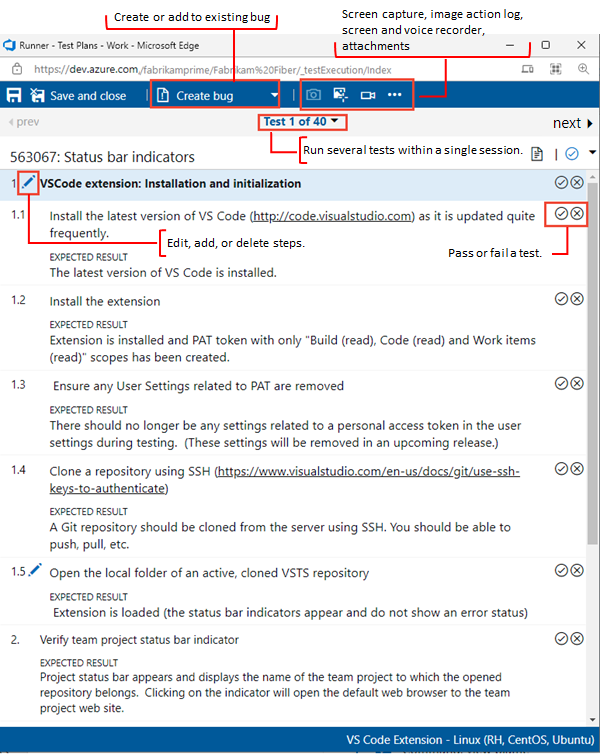
Test Runner runs tests for your web and desktop applications. Mark test steps and test outcomes as pass or fail, and collect diagnostic data such as system information, image action logs, screen recordings, and screen captures as you test. Bugs filed during the tests automatically include all captured diagnostic data to help your developers reproduce the issues. For more information, see Run tests for web apps and Run tests for desktop apps.
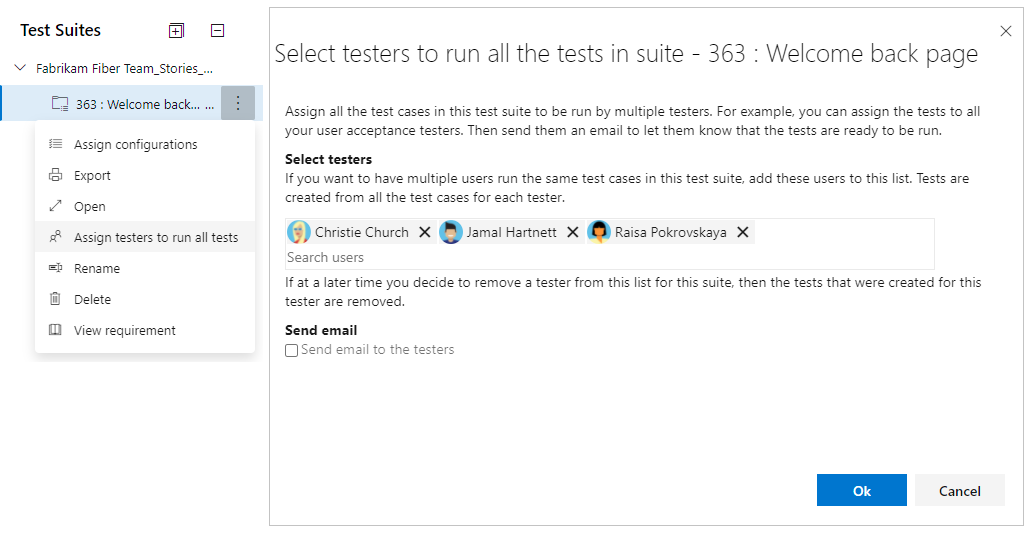
User acceptance testing (UAT) helps ensure teams deliver the value requested by customers. You can create UAT test plans and suites, invite several testers to execute these tests, and monitor test progress and results using lightweight charts. To learn how, see User acceptance testing.
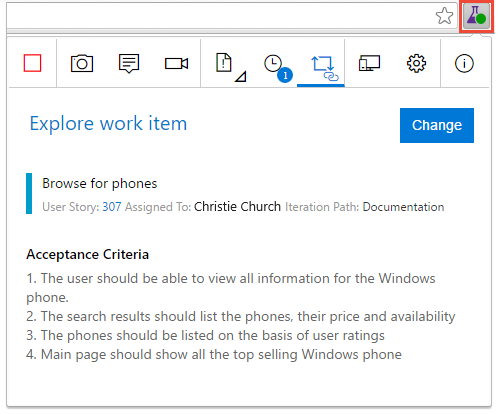
The Test & Feedback extension is a simple browser-based extension you can use to test web apps anytime and anywhere, and is simple enough for everyone in the team to use. It helps to improve productivity by allowing you to spend more time finding issues, and less time filing them.
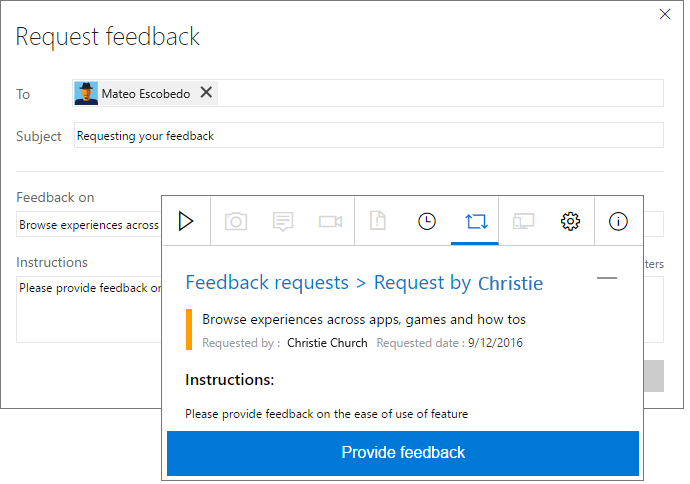
You should seek feedback from stakeholders outside the development team, such as marketing and sales teams, which is vital for developing good quality software. Developers can request feedback on their user stories and features. Stakeholders can respond to feedback requests using the browser-based Test & Feedback extension - not just to rate and send comments, but also by capturing rich diagnostic data and filing bugs and tasks directly. See more at Request stakeholder feedback and Provide stakeholder feedback.
Automated testing is facilitated by running tests within Azure Pipelines. Test analytics provides near real-time visibility into your test data for builds and releases. It helps improve pipeline efficiency by identifying repetitive, high impact quality issues.
Azure Test Plans supports automated testing in the following ways:
Associate test plans or test cases with build or release pipelines
Specify test-enable tasks within a pipeline definition. Azure Pipelines provides several tasks, including the following tasks that support a comprehensive test reporting and analytics experience.
- Publish Test Results task: Use to publish test results to Azure Pipelines.
- Visual Studio Test task: Use to run unit and functional tests (Selenium, Appium, Coded UI test, and more) using the Visual Studio Test Runner.
- .NET Core CLI task: Use to build, test, package, or publish a dotnet application.
For more tasks, see Publish Test Results task
Provide built-in reports and configurable dashboard widgets to display results of pipeline testing.
Collect test results and associated test data into the Analytics service.
Azure Test Plans supports linking bugs and requirements to test cases and test suites. In addition, the following web portal, test-related tools support traceability:
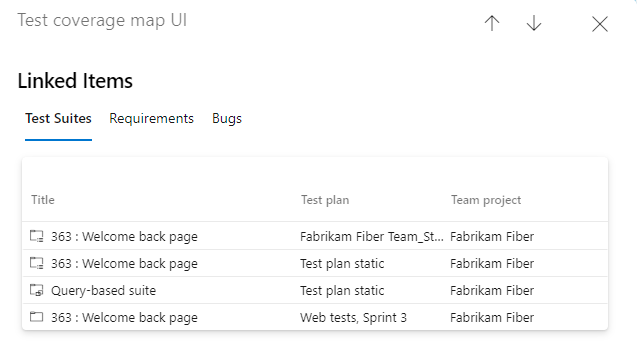
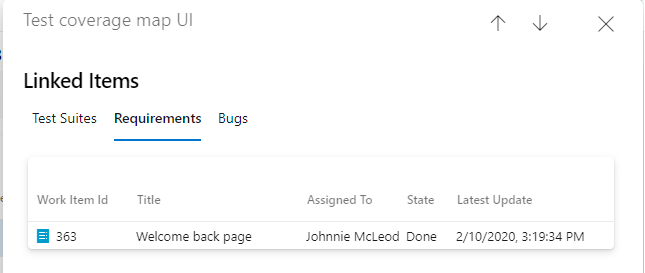
- View items linked to a test case: View the test plans, test suites, requirements, and bugs that a test case links to.
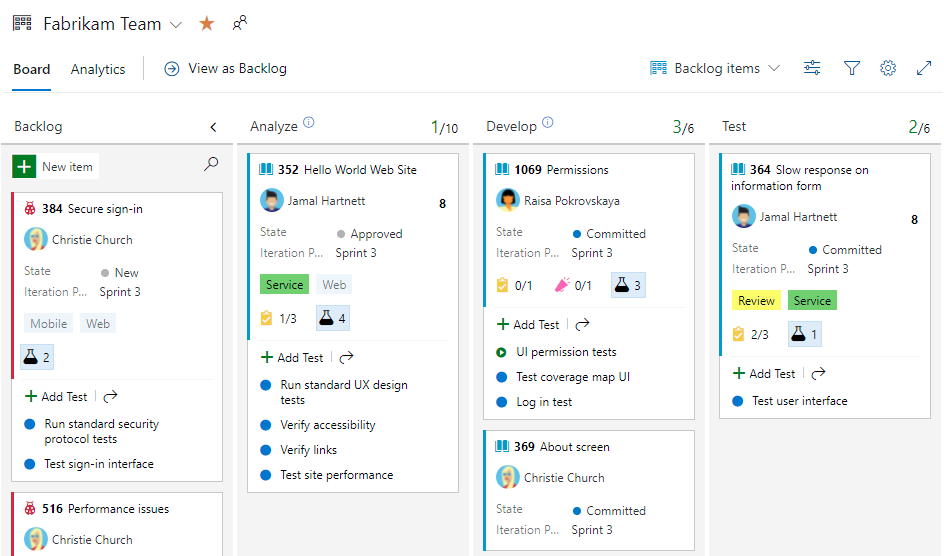
- Add and run tests from the board: An Azure Boards feature that supports defining test cases from the user stories, features, or bugs from the board. Also, you can launch the Test Runner or the Test & Feedback extension to run tests or perform exploratory testing.
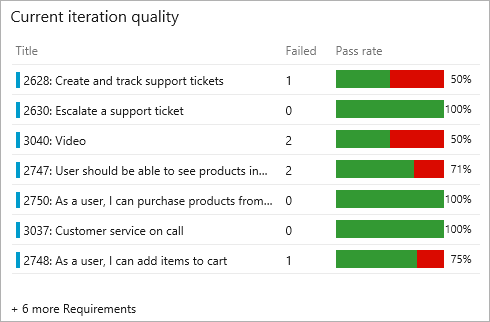
- Requirements quality widget: Configurable widget used to track quality continuously from a build or release pipeline. The widget shows the mapping between a requirement and latest test results executed against that requirement. It provides insights into requirements traceability. For example, requirements not meeting the quality, requirements not tested, and so on.
From the Test plans hub, you can view and open the test suites, requirements, and bugs linked to a test case. The Test Suites tab also indicates the test plans and projects that reference the test case. The Requirements tab lists work items linked to the test case that belong to the requirements category. In addition, you can create a direct-links query that lists items that link to test cases via the Tests/Tested by link type. For more information, see Create test cases and Use direct links to view dependencies.
From the Azure Boards boards, you can add tests from a user story or feature, automatically linking the test case to the user story or feature. You can view, run, and interact with test cases directly from the board, and progressively monitor status directly from the card. Learn more at Add, run, and update inline tests.
The Requirements quality widget displays a list of all the requirements in scope, along with the Pass Rate for the tests and count of Failed tests. Selecting a Failed test count opens the Tests tab for the selected build or release. The widget also helps to track the requirements without any associated tests. For more information, see Requirements traceability.
To support reporting and analysis, Azure Test Plans supports test tracking charts, a test Runs hub, several built-in pipeline test reports, dashboard widgets, and test-data stored in the Analytics service.
- Configurable test charts: You can gain insight into the test plan authoring and execution activity by creating test tracking charts.
- Progress report: Track progress of one or test plans or test suites.
- Test Runs: Review the results of manual and automated test runs.
- Dashboard widgets: Configurable widgets that display test results based on selected builds or releases. Widgets include the Deployment status widget and the Test Results Trend (Advanced) widget.
- Test Analytics: Gain detailed insights from built-in pipeline reports or create custom reports by querying the Analytics service.
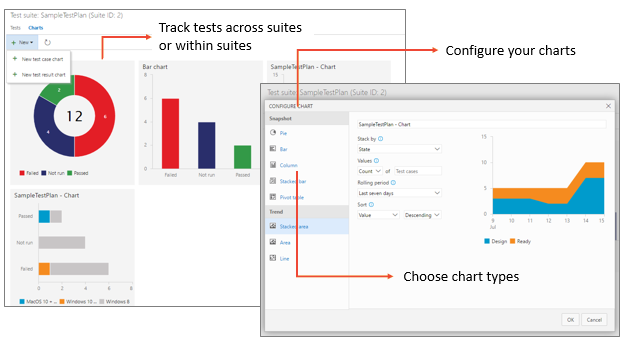
Quickly configure lightweight charts to track your manual test results using the chart types of your choice, and pin the charts to your dashboard to easily analyze these results. Choose a retention policy to control how long your manual testing results are retained. See more at Track test status.
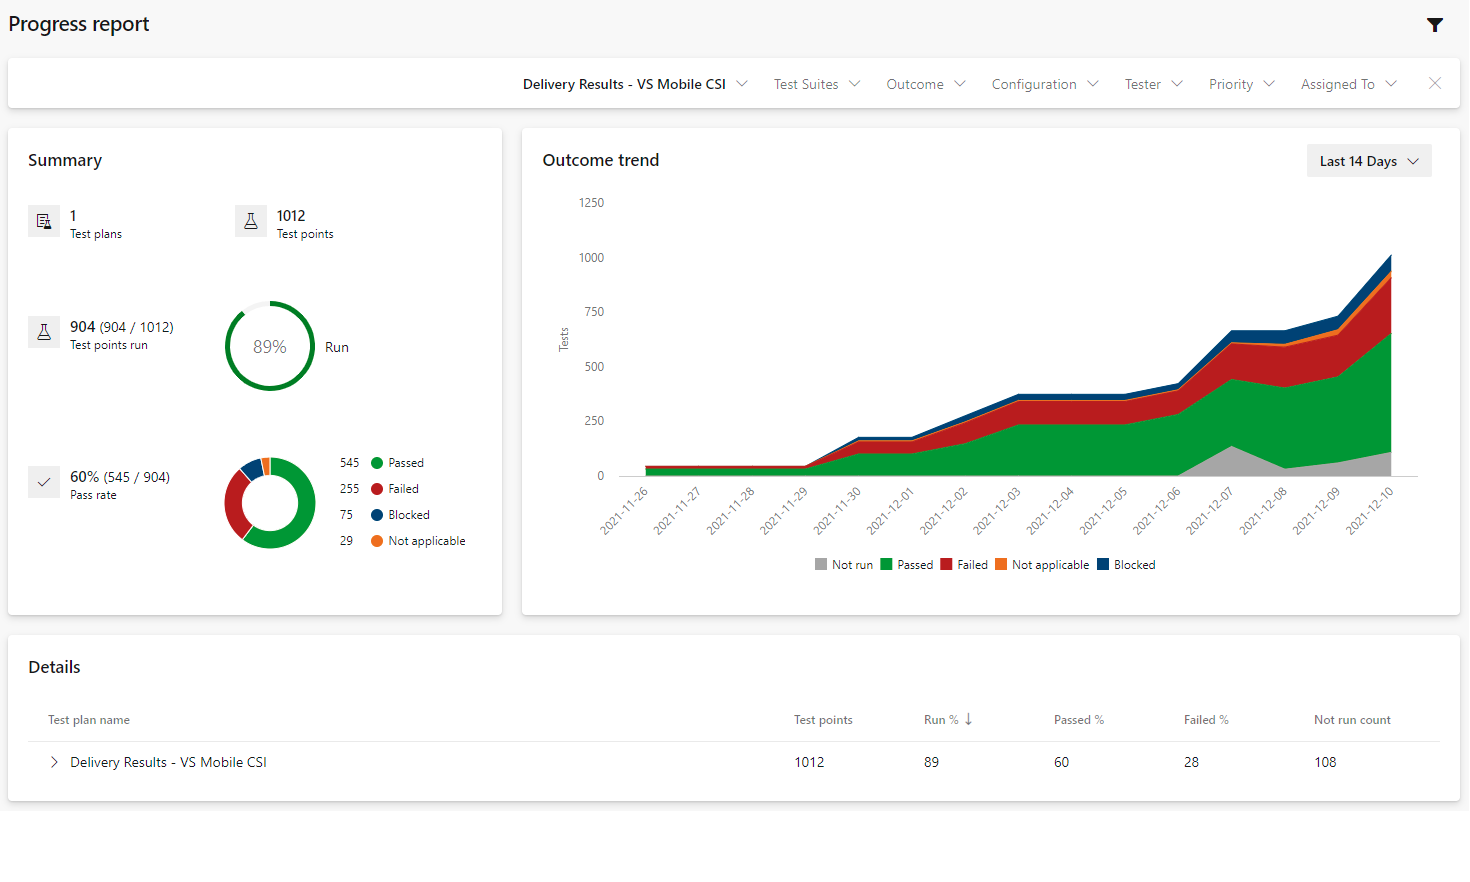
With the Progress report hub, teams can track progress of more than one test plan or test suite. This report helps answer the following questions:
- How much testing is complete?
- How many tests passed, failed, or are blocked?
- Is testing likely to complete in time?
- What is the daily rate of execution?
- Which test areas need attention?
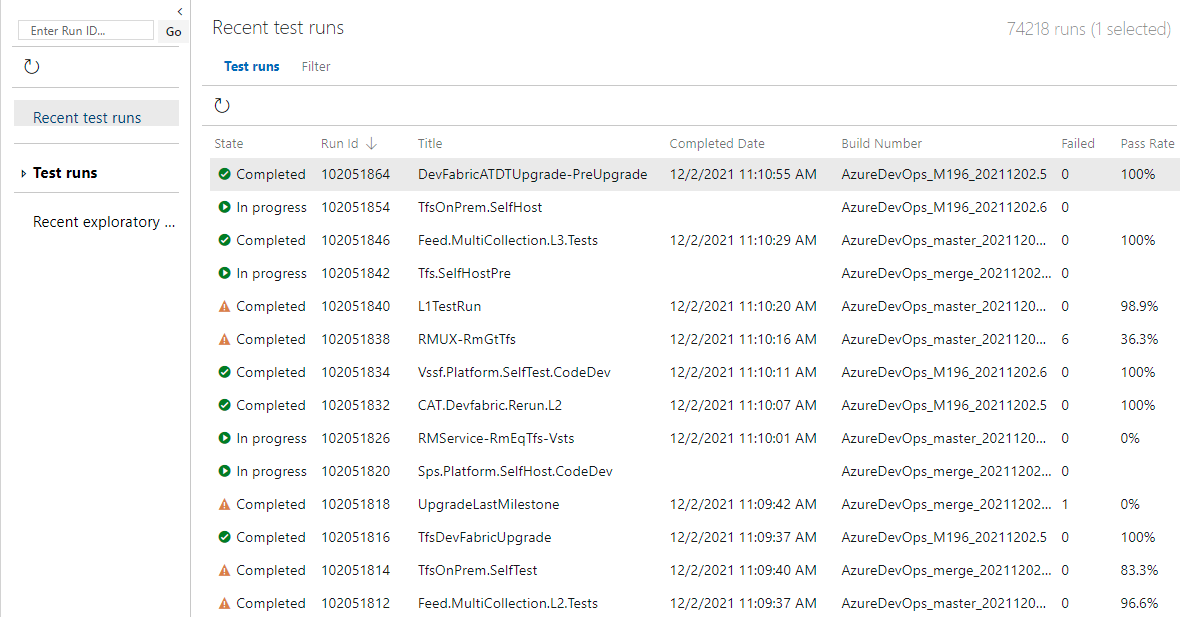
The Runs hub displays the results of test runs, which include all test runs, both manual and automated.
Opomba
The Runs hub is available with Azure DevOps Server 2020 and later versions. It requires enabling the Analytics service which is used to store and manage test run data. For more information about the service, see What is the Analytics service?
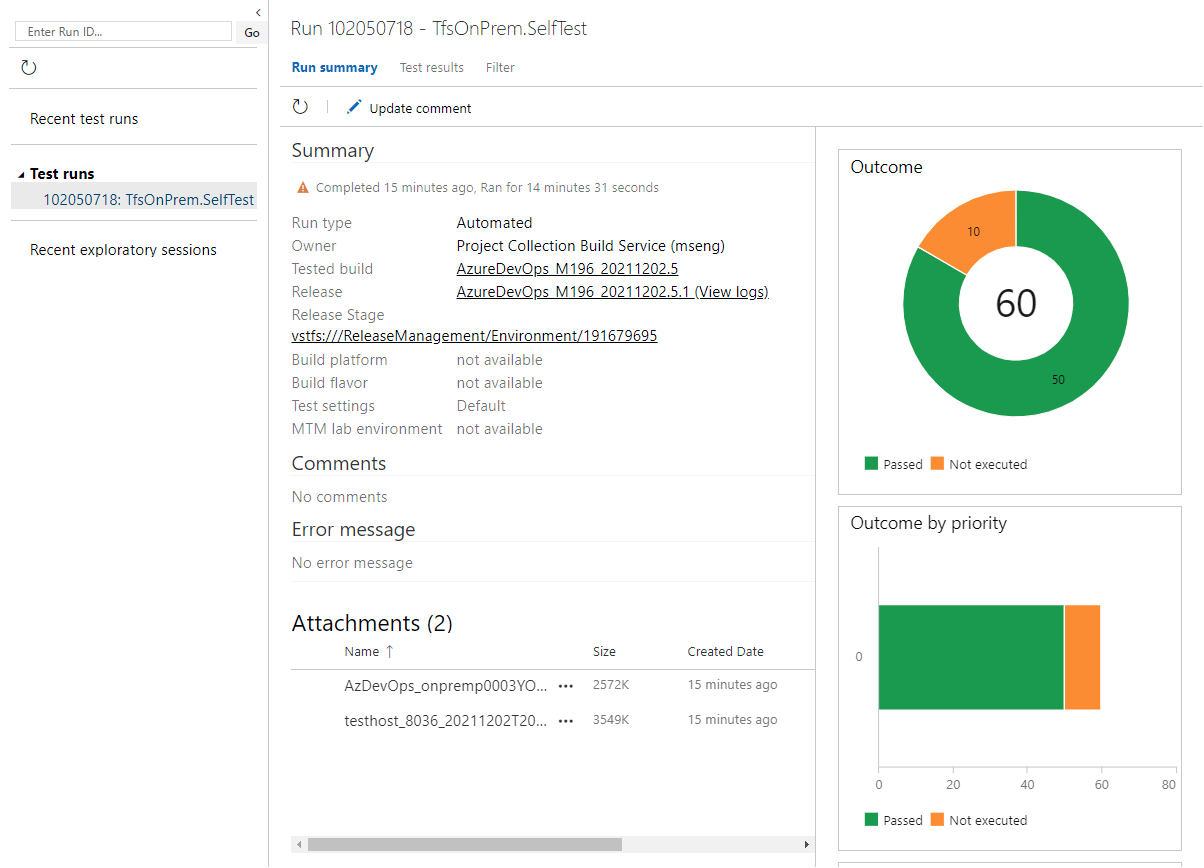
Choose any specific run to view a summary of the test run.
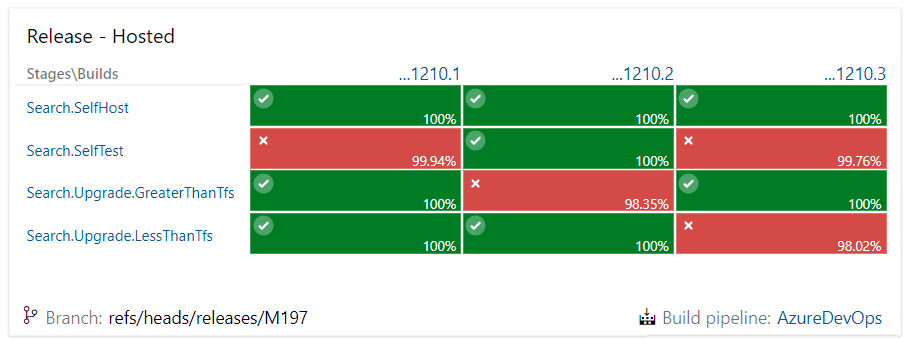
The Deployment status widget configurable widget shows a combined view of the deployment status and test pass rate across multiple environments for a recent set of builds. You configure the widget by specifying a build pipeline, branch, and linked release pipelines. To view the test summary across multiple environments in a release, the widget provides a matrix view of each environment and corresponding test pass rate.
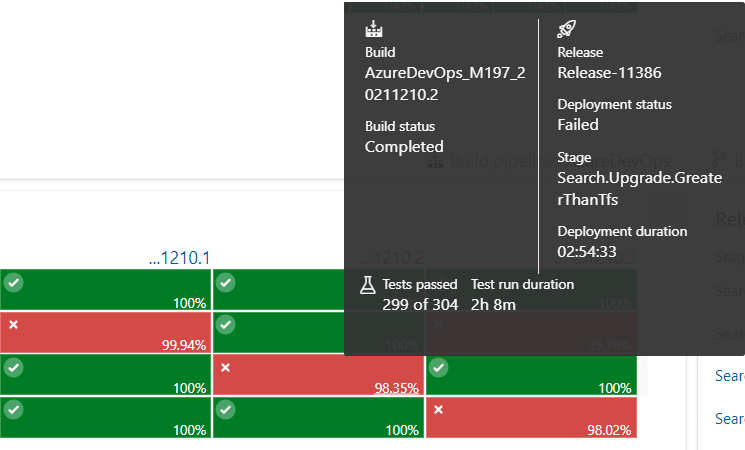
Hover over any build summary, and you can view more details, specifically the number of tests passed and failed.
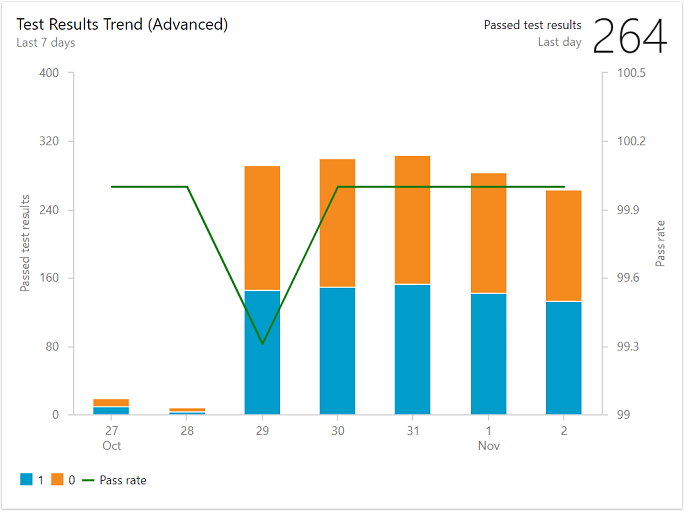
The Test Results Trend (Advanced) widget provides near real-time visibility into test data for multiple builds and releases. The widget shows a trend of your test results for selected pipelines. You can use it to track the daily count of test, pass rate, and test duration. Tracking test quality over time and improving test collateral is key to maintaining a healthy DevOps pipeline. The widget supports tracking advanced metrics for one or more build pipelines or release pipelines. The widget also allows filtering of test results by outcome, stacking metrics, and more. For more information, see Configure the Test Results Trend (Advanced) widget.
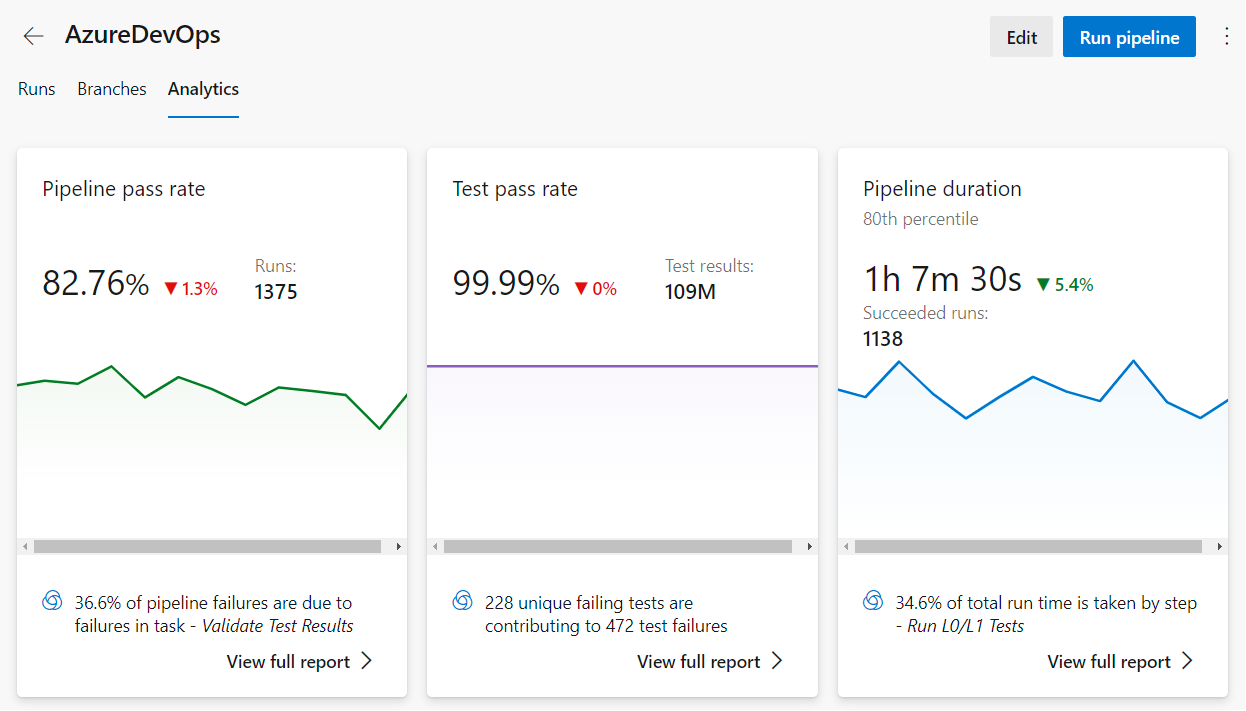
The built-in tests and test-supported widgets derive their data from the Analytics service. The Analytics service is the reporting platform for Azure DevOps and supports the Analytics and Tests tab and drill-down reports available from the Pipelines hub. The Test failure drill-down report provides a summary of passed and failing tests. For more information, see Test Analytics.
In addition, you can create custom reports by querying the Analytics service. For more information, see Overview of sample reports using OData queries.