opomba,
Dostop do te strani zahteva pooblastilo. Poskusite se vpisati alispremeniti imenike.
Dostop do te strani zahteva pooblastilo. Poskusite lahko spremeniti imenike.
Model-driven apps use JavaScript web resources to contain custom logic. These web resources provide the libraries that define functions developers register as event handlers.
When you view a model-driven app in a web browser, you can use developer tools that all modern browsers provide. By using these tools, you can locate the JavaScript libraries loaded in the model-driven application, set breakpoints, and debug your code by using common methods.
Model-driven apps viewed by using mobile apps on Android, or the Windows desktop app, require some more steps. See:
- Debug JavaScript in mobile apps on Android
- Debug JavaScript in mobile apps on iOS
- Debug JavaScript in the Windows desktop app
Note
Because of the way that the libraries are added to the page, you might not easily find the library representing the JavaScript web resource. These libraries might not appear in the file list or in the hierarchy of source files.
If you know the name of the JavaScript web resource you want to debug, for Microsoft Edge or Google Chrome sources, use the Ctrl+P Open file command to locate the file by name and start debugging. If you have an event handler that causes an error, but you don't know the name of the file, see Identify JavaScript web resource causing error.
More information:
Identify JavaScript web resource causing error
When an event handler causes a script error in a model-driven app, the following dialog appears:
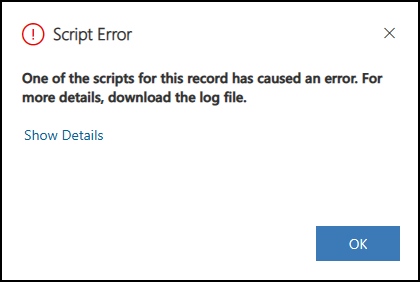
If you select the Show Details link, you can find the details that include: event name, function name, web resource name, solution name, and publisher name.
Xrm.Navigation.openalertDialog is not a function
Session Id: 53febd7c-3388-4ea5-a195-d84cf5883c30
Correlation Id: aaaa0000-bb11-2222-33cc-444444dddddd
Event Name: onsave
Function Name: Example.formOnSave
Web Resource Name: example_example-form-script
Solution Name: Active
Publisher Name: DefaultPublisherYourOrg
Time: Tue Jan 31 2023 13:36:34 GMT-0800 (Pacific Standard Time)
In this case, the name of the function was incorrect, openalertDialog should be openAlertDialog.
Note
You can get the same details on errors by using Monitor. For more information, see Custom script errors.
Debug JavaScript in mobile apps on Android
When you use JavaScript web resources for mobile scenarios, you can use your Android device to debug your mobile-specific code and ensure it works as expected.
To debug JavaScript in mobile apps on Android, complete the following three steps:
1. Configure your device
Refer to the Android documentation to enable Developer options and USB debugging on your device. For more information, see Android Developers: Configure on-device developer options.
In the Microsoft Edge or Chrome browser, discover your Android device. For more information, see Chrome Developers: Remote debug Android devices.
- On Microsoft Edge:
edge://inspect/#devices - On Chrome:
chrome://inspect/#devices
- On Microsoft Edge:
Note
Make sure that Discover USB devices is enabled.
2. Configure the mobile application
- In the mobile app, go to the list of Power Apps and select the menu button.
- Make sure that the toggle Enable remote debugging for model-driven apps is on.
- A confirmation dialog appears when you enable this option. Select Confirm.
3. Debug from your development machine
Plug your computer into your Android device.
Open any model-driven app from Power Apps or the Field Service Mobile application.
In the
edge://inspect/#devicespage in your browser, find your organization URL in the Remote Target section.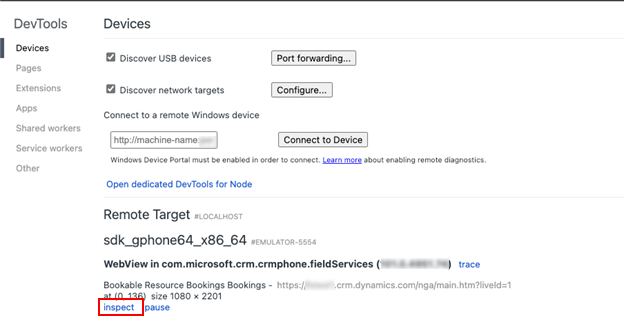
Select inspect.
For more information, see Microsoft Edge: Remotely debug Android devices.
Debug JavaScript in mobile apps on iOS
Use Safari on a Mac to debug JavaScript web resources on iOS.
To debug JavaScript in mobile apps on iOS, complete the following two steps:
1. Configure the mobile application
- In the mobile app, go to the list of Power Apps and select the menu button.
- Make sure that the toggle Enable remote debugging for model-driven apps is on.
2. Debug from your Mac
- Connect your iPhone or iPad to your Mac.
- Launch Safari on your Mac.
- In the Develop menu, find your connected iPhone or iPad, and then look for Power Apps or Field Service.
For more information, see Inspecting iOS and iPadOS | Apple Developer Documentation.
Debug JavaScript in the Windows desktop app
To debug JavaScript on Windows, first install the prerequisite applications.
- Install a WebView2 runtime on your machine with a minimum version of 111. Download the WebView2 Runtime.
- Install the Remote Tools for Microsoft Edge from the Microsoft Store: Remote Tools for Microsoft Edge - Microsoft Store Apps.
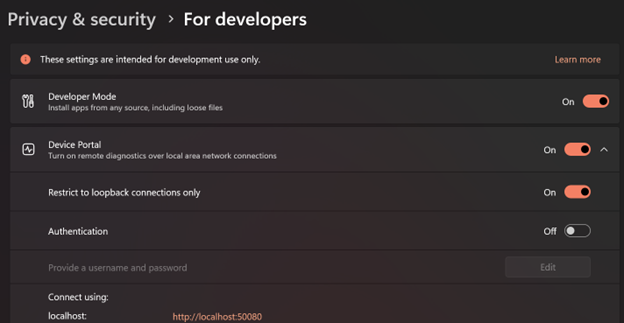
1. Configure your Windows device
Enable Developer Mode.
- Open Windows Settings > Privacy & security > For developers.
- Enable Developer Mode.
Enable Device Portal.
- Open Windows Settings > Privacy & security > For developers.
- Enable Device Portal.
- Select Yes to install Windows Developer Mode package when prompted.
- Once Device Portal is enabled, note the URL you use to connect through localhost. On most devices, it's
https://localhost:50080. - For debugging Power Apps or Field Service Mobile locally, you can continue with Restrict to loopback connections only enabled and Authentication disabled (otherwise you need to set a user password).
Here's a screenshot summary of the recommended developer settings:
2. Configure the Windows application
Configure the Power Apps or Field Service Windows desktop app for remote debugging.
Use the Run command (shortcut is Windows + R) and use the following deep link to launch the Windows app with special arguments.
- Power Apps:
ms-apps://?addWebView2AdditionalBrowserArgument=--enable-features=msEdgeDevToolsWdpRemoteDebugging - Field Service Mobile:
ms-apps-fs://?addWebView2AdditionalBrowserArgument=--enable-features=msEdgeDevToolsWdpRemoteDebugging
3. Debug from Windows
Launch Power Apps or Field Service for Windows.
Open the Microsoft Edge browser and go to
edge://inspect.Use the Connect to a remote Windows device section and connect to
http://localhost:50080. It takes a few seconds to connect, but you see the organization URL.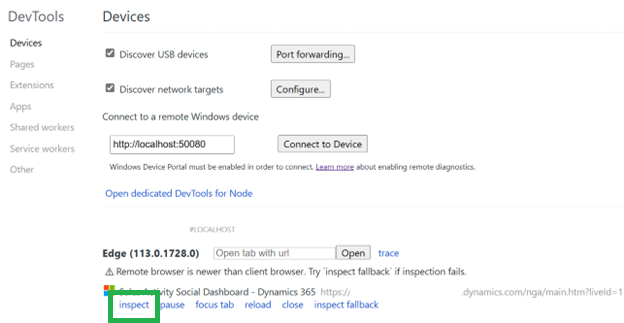
Select inspect and the DevTools opens.
Related articles
JavaScript web resources
Debug a model-driven app with Monitor
Troubleshoot issues in the Power Apps mobile app