Not
Åtkomst till den här sidan kräver auktorisering. Du kan prova att logga in eller ändra kataloger.
Åtkomst till den här sidan kräver auktorisering. Du kan prova att ändra kataloger.
This article shows how to debug the client-side code (JavaScript or TypeScript) of your add-in outside of your current IDE.
Debug a task pane add-in using Microsoft Edge developer tools
Note
If your add-in has an add-in command that executes a function, the function runs in a hidden browser runtime process that the Microsoft Edge developer tools can't be launched from, so the technique described in this article can't be used to debug code in the function.
Sideload and run the add-in.
Note
To sideload an add-in in Outlook, see Sideload Outlook add-ins for testing.
Run the Microsoft Edge developer tools by one of these methods:
- Be sure the add-in's task pane has focus and press Ctrl+Shift+I.
- Right-click (or select and hold) the task pane to open the context menu and select Inspect, or open the personality menu and select Attach Debugger. (The personality menu isn't supported in Outlook.)
Note
The new Outlook on Windows desktop client doesn't support the context menu or the keyboard shortcut to access the Microsoft Edge developer tools. Instead, you must run
olk.exe --devtoolsfrom a command prompt. For more information, see the "Debug your add-in" section of Develop Outlook add-ins for the new Outlook on Windows.Open the Sources tab.
Open the file that you want to debug with the following steps.
- On the far right of the tool's top menu bar, select the ... button and then select Search.
- Enter a line of code from the file you want to debug in the search box. It should be something that's not likely to be in any other file.
- Select the refresh button.
- In the search results, select the line to open the code file in the pane above the search results.
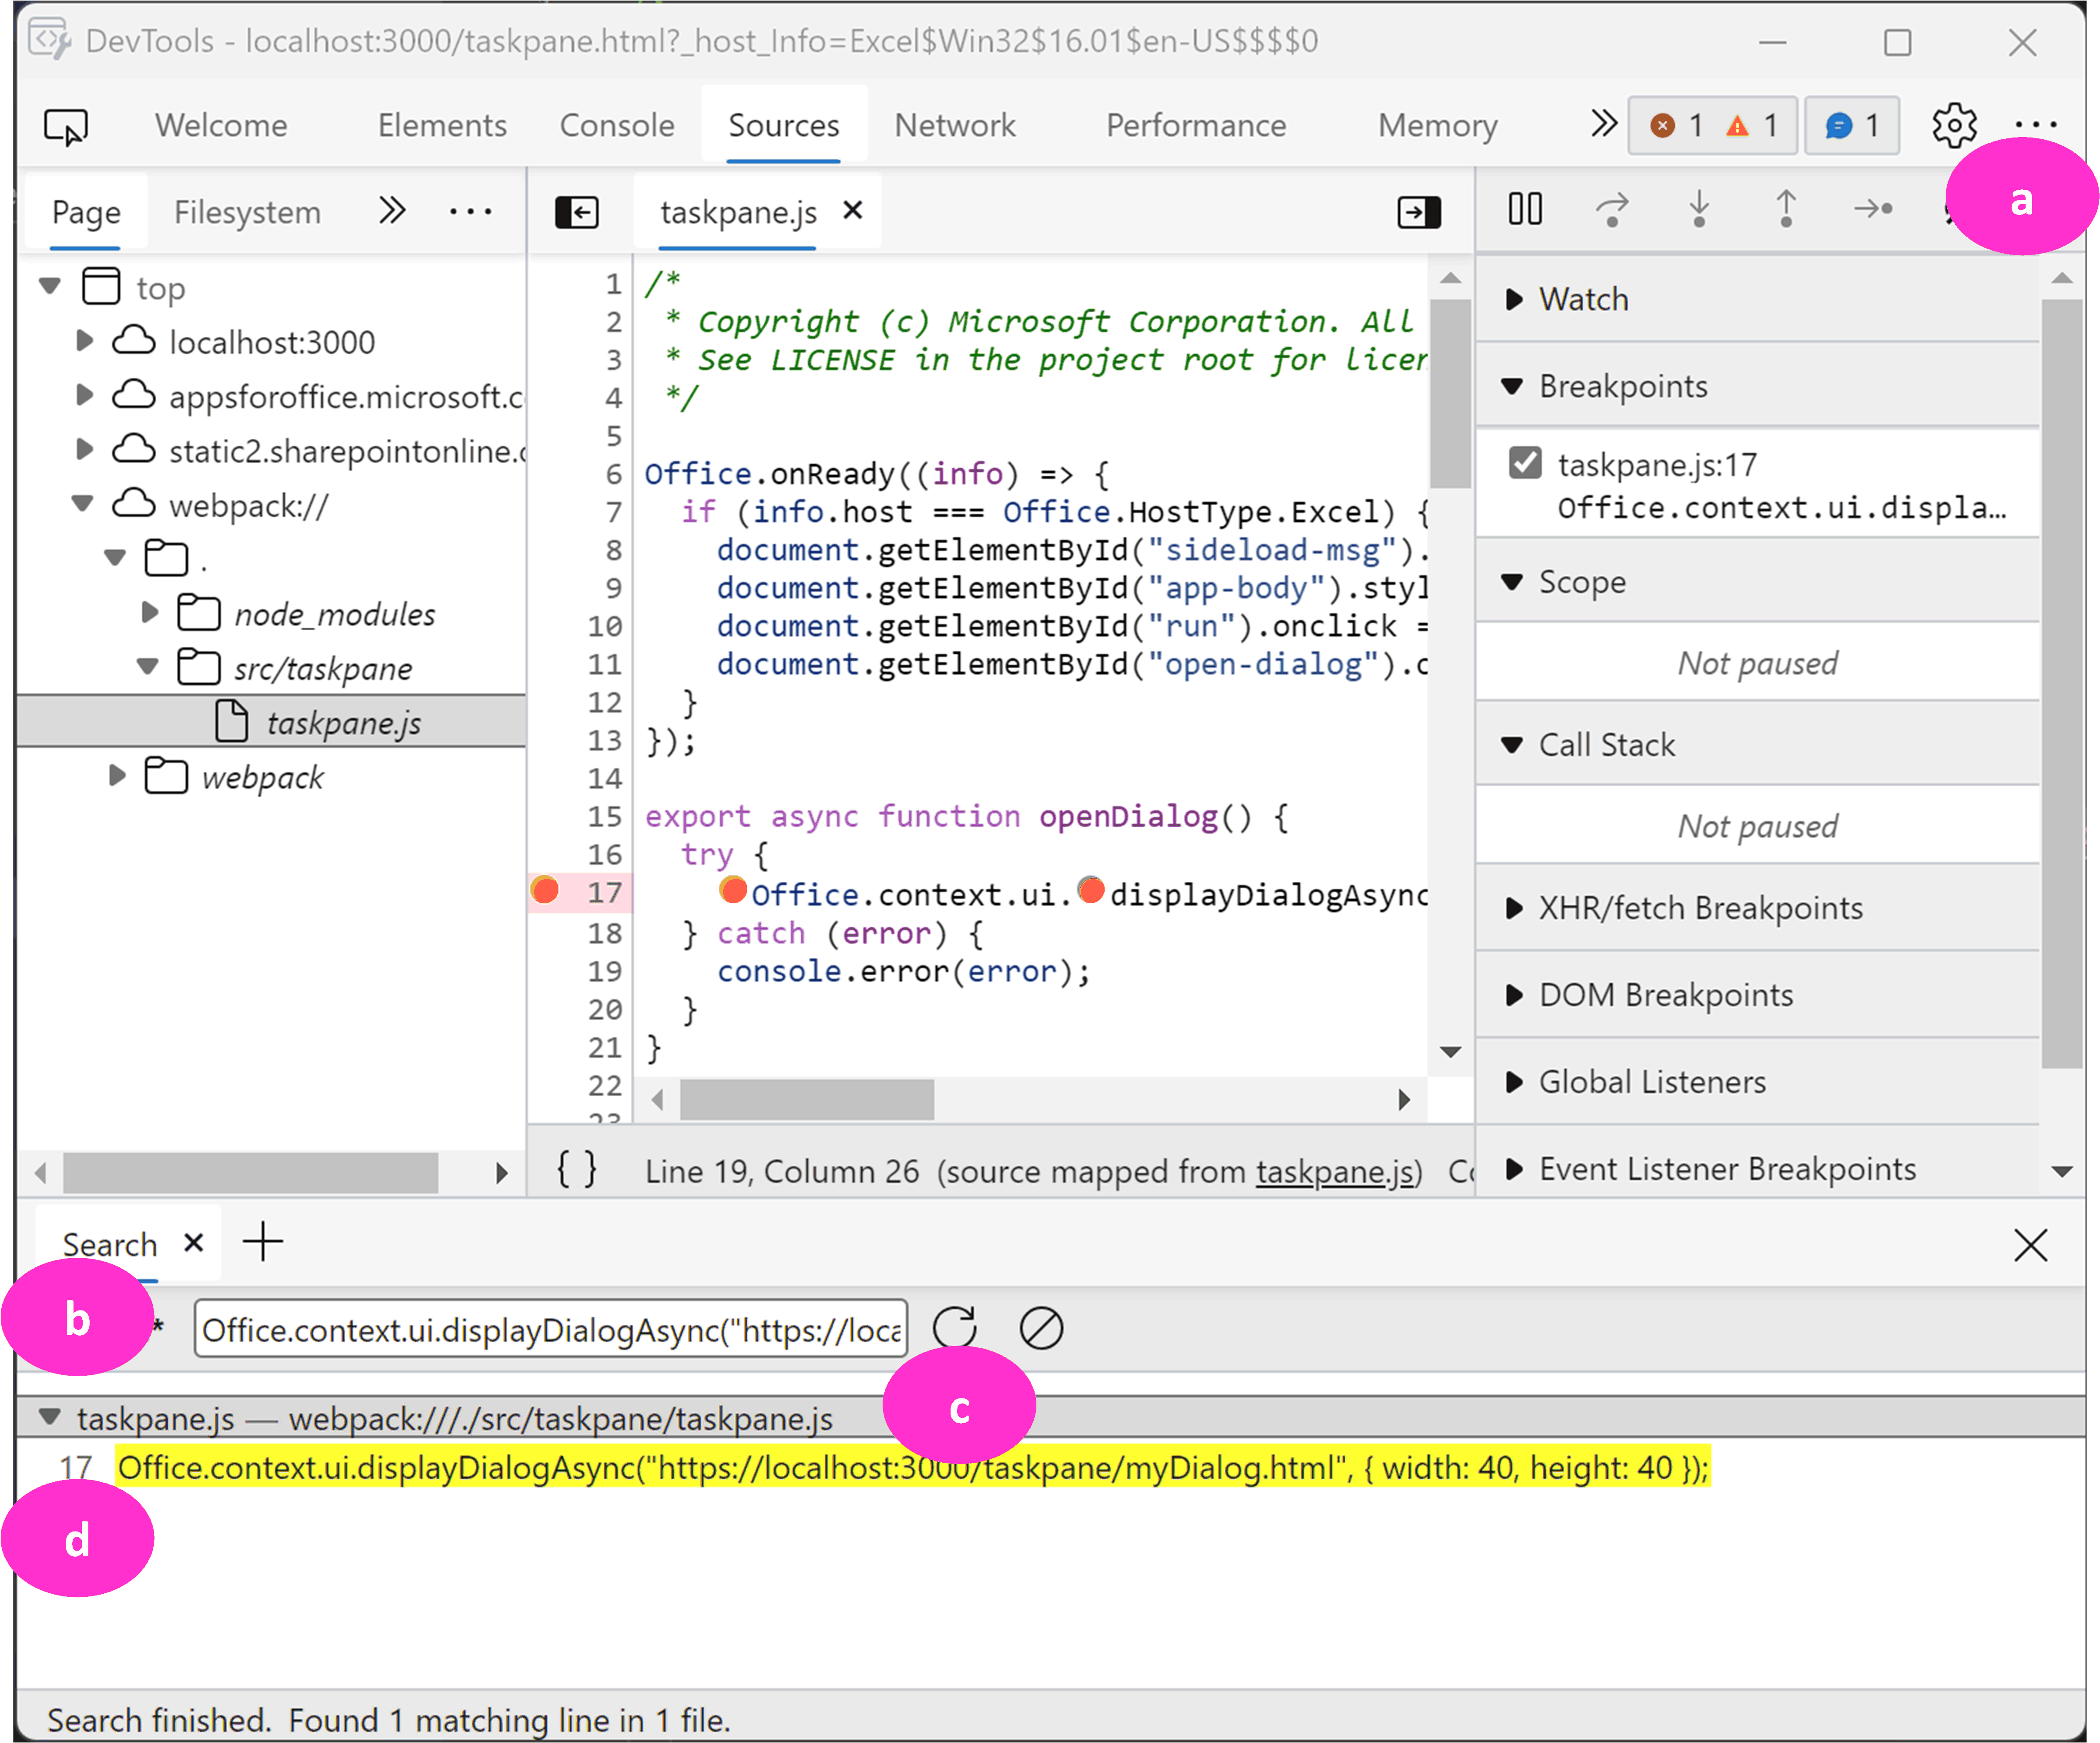
To set a breakpoint, select the line number of the line in the code file. A red dot appears by the line in the code file. In the debugger window to the right, the breakpoint is registered in the Breakpoints drop down.
Execute functions in the add-in as needed to trigger the breakpoint.
Tip
For more information about using the tools, see Microsoft Edge Developer Tools overview.
Debug a dialog in an add-in
If your add-in uses the Office Dialog API, the dialog runs in a separate process from the task pane (if any) and the tool must be started from that separate process. Follow these steps.
Run the add-in.
Open the dialog and be sure it has focus.
Open the Microsoft Edge developer tools by one of these methods:
- Press Ctrl+Shift+I or F12.
- Right-click (or select and hold) the dialog to open the context menu and select Inspect.
Use the tool the same as you would for code in a task pane. See Debug a task pane add-in using Microsoft Edge developer tools earlier in this article.
Automatically open the Microsoft Edge developer tools to debug initialization
To debug your add-in’s initialization sequence, configure your environment so that Microsoft WebView2 developer tools automatically open when the add-in launches.
- Close the Office application where you plan to debug the add-in.
- Set the
WEBVIEW2_ADDITIONAL_BROWSER_ARGUMENTSenvironment variable to include the value--auto-open-devtools-for-tabs. - Open the Office application.
- Run the add-in.
- The Microsoft Edge developer tools should automatically open. Use the tool the same as you would when debugging a task pane, as specified in Debug a task pane add-in using Microsoft Edge developer tools.
Note
You may see other instances of the Microsoft Edge developer tool auto-opening since this environment variable will affect all WebView2 instances in your system.
Samarbeta med oss på GitHub
Källan för det här innehållet finns på GitHub, där du också kan skapa och granska problem och pull-begäranden. Mer information finns i vår deltagarguide.
Office Add-ins