 Visual Studio 2019 version 16.3 Release Notes
Developer Community | System Requirements | Compatibility | Distributable Code | Release History | License Terms | Blogs | Whats New in Visual Studio Docs
Note
This is not the latest version of Visual Studio. To download the latest release, please visit the Visual Studio site.
What's New in Visual Studio 2019 version 16.3
Support Timeframe
This version is now out of support. For more information about Visual Studio support, please review the Support Policy for Visual Studio 2019.
Refer to the latest version of the release notes or visit the Visual Studio site to download the latest supported version of Visual Studio 2019.
Visual Studio 2019 version 16.3 Releases
- November 20, 2019 — Visual Studio 2019 version 16.3.10
- November 12, 2019 — Visual Studio 2019 version 16.3.9
- November 5, 2019 — Visual Studio 2019 version 16.3.8
- October 29, 2019 — Visual Studio 2019 version 16.3.7
- October 22, 2019 — Visual Studio 2019 version 16.3.6
- October 15, 2019 — Visual Studio 2019 version 16.3.5
- October 10, 2019 — Visual Studio 2019 version 16.3.4
- October 8, 2019 — Visual Studio 2019 version 16.3.3
- October 1, 2019 — Visual Studio 2019 version 16.3.2
- September 25, 2019 — Visual Studio 2019 version 16.3.1
- September 23, 2019 — Visual Studio 2019 version 16.3.0
Archived Release Notes
- Visual Studio 2019 version 16.2 Release Notes
- Visual Studio 2019 version 16.1 Release Notes
- Visual Studio 2019 version 16.0 Release Notes
Visual Studio 2019 Blog
The Visual Studio 2019 Blog is the official source of product insight from the Visual Studio Engineering Team. You can find in-depth information about the Visual Studio 2019 releases in the following posts:
- .NET Core Support and More in Visual Studio 2019 version 16.3 - Update Now!
- Visual Studio 2019 version 16.3 Preview 2 and Visual Studio 2019 for Mac version 8.3 Preview 2 Released!
- Visual Studio 2019 version 16.2 and 16.3 Preview 1 now available
- Visual Studio 2019 version 16.2 Preview 2
- Visual Studio 2019 version 16.1 and Preview 16.2 Preview
- Visual Studio 2019: Code faster. Work smarter. Create the future.
 Visual Studio 2019 version 16.3.10
released November 20, 2019
Top Issues Fixed in Visual Studio 2019 version 16.3.10
- Xamarin fastlane: "There was an error while syncing the developer information: 'Limit of requests to iTunes Connect is reached.'"
- MSIX Package Project with WPF App - Create App Packages no longer works.
 Visual Studio 2019 version 16.3.9
released November 12, 2019
Top Issues Fixed in Visual Studio 2019 version 16.3.9
- Edit Continue Crashes IDE
- Link.exe exited with code - 1073741819 when generating map files.
- ClickOnce installer prerequisite vcredist 14 (x64) is invalid after download
- Every time I hit a breakpoint and apply changes with edit & continue Visual Studio crashes to desktop
- Fixed crash when editing code while debugging ASP.NET applications.
 Visual Studio 2019 version 16.3.8
released November 5, 2019
Top Issues Fixed in Visual Studio 2019 version 16.3.8
- Added support for Xcode 11.2
- 'TypeConverter cannot convert from System.String' after upgrade to Visual Studio 2019.
- Fixed an issue where loading existing extensions (.design dll) in UWP crashes Visual Studio.
 Visual Studio 2019 version 16.3.7
released October 29, 2019
Top Issues Fixed in Visual Studio 2019 version 16.3.7
- C++ Linux project - Remote header sync is broken in Visual Studio 16.3
- Visual Studio 16.3 opens some files with notepad
- Fixed an issue with the Show Output window either closing too quickly.
- Fixed an issue where Visual Studio 2019 stops responding in several scenarios, including opening a solution, changing solution configuration, and closing a solution.
 Visual Studio 2019 version 16.3.6
released October 22, 2019
Top Issues Fixed in Visual Studio 2019 version 16.3.6
- Automatic ANSI .rc file conversion to UTF8 !!!! (not wanted !!!!)
- Fixed an inaccurate error message when developers try publishing .NET Core 3.0 apps to Azure.
- Stability improvement in msbuild/dotnet restore when plugins are used to restore against authenticated feeds.
 Visual Studio 2019 version 16.3.5
released October 15, 2019
Top Issues Fixed in Visual Studio 2019 version 16.3.5
- Updating VS 2019 corrupts installation
- Fixed an additional issue causing enterprise users building offline caches and offline users to fail an install.
 Visual Studio 2019 version 16.3.4
released October 10, 2019
Top Issues Fixed in Visual Studio 2019 version 16.3.4
- Xamarin.iOS Designer update to support for Xcode 11.1
- Publish doesn't work in Visual Studio 16.3.1
 Visual Studio 2019 version 16.3.3
released October 8, 2019
Top Issues Fixed in Visual Studio 2019 version 16.3.3
- InvalidOperationException Writing is not allowed after writer was completed
- ICE on valid code after upgrading to 16.2.0
- CPU Usage Tool context menu does not navigate
- Wrong assembly when result of conversion operator is converted to reference to base class.
- DockerUpdateComposeVsGeneratedFiles throws "Value cannot be null" ("Parameter name: path1") after updating to Visual Studio 16.3
- CPU Usage Tool context menu does not navigate.
- Publish doesn't work in Visual Studio 16.3.1.
- This fixes an issue with the Snapshot Debugger where customers are using MSA accounts.
- Fixed an issue where customers trying to install Microsoft.Visualstudio.Shell.15.0 NuGet package received a warning message of Framework not found.
- Fixes MSVC compiler bug involving implicit conversion from a lambda to function pointer.
- Fixed issue with Visual Studio crashing due to null reference exception.
- A fix is made to address a compiler internal error when the code has an out-of-line definition of a static data member of a nested class inside a partial specialization.
 Visual Studio 2019 version 16.3.2
released October 1, 2019
Top Issues Fixed in Visual Studio 2019 version 16.3.2
- Corrected an issue with Xcode 11 support.
 Visual Studio 2019 version 16.3.1
released September 25, 2019
Top Issues Fixed in Visual Studio 2019 version 16.3.1
- 16.3 - XAML designer not showing for .NET Core 3.0 apps
- Fixed an issue causing Visual Studio to stop responding.
 Visual Studio 2019 version 16.3.0
released September 23, 2019
Summary of What's New in Visual Studio 2019 version 16.3
- Support for adding new Open API & GRPC service references to .NET Core 3.0 projects.
- Support for F# 4.7 and various F# tooling improvements
- Improvements for C++ developers, including toggleable line comments and improved IntelliSense member list filtering.
- Search through recent projects, solutions, and folders within the start window.
- Search for templates in the New Project Dialog with advanced search capabilities.
- Publish .NET Core 3.0 worker projects to Azure Container Registry, DockerHub, etc.
- .NET Productivity additions in this release include the ability to rename the containing file when renaming a class as well as Edit and Continue enhancements within the debugger.
- Debug Azure Functions running in Linux containers.
- Search individual components while installing or modifying in the Visual Studio Installer.
- Streamlined Visual Studio update experience that integrates Visual Studio IDE and Installer updates.
- Differentiate workloads and components when adding them in the Visual Studio IDE.
- Code Search via VS Search (Ctrl+Q)
- Easily find newly installed project templates, view selected values on filters, and pin recently used templates in the New Project Dialog.
- Easily configure your applications' dependencies in publish profiles using the new Add Dependency wizard.
- The Visual Studio installer components for .NET Core 2.1 and 2.2 now also include templates (instead of just the runtime).
- Tooling support for serving static assets from within a Razor class library.
- Updated Python Testing Experience using the newly-added Python testing framework pytest as well as a modified unittest experience.
- Reduced time to index large folders and search for files in these folders.
- Added support for Xcode 11 and iOS 13.
- Added support for Android 10.
- Use XAML Hot Reload for Xamarin.Forms. to rapidly iterate on your Xamarin.Forms UI.
- Android Material Design in the XAML Previewer for Xamarin.Forms.
- New constraint editor in the Xamarin Designer for iOS.
- Enabled publishing iOS apps on Windows.
- There are new options for editing .plist files.
- Improved tasks view when debugging in Parallel Stacks Window.
- A variety of C++ productivity improvements, including new C++ Core checks, a new default semantic colorization scheme, and on-by-default IntelliCode
- Support for parallel builds in MSBuild-based Linux C++ projects that leverage the native WSL experience.
- .NET Productivity additions in this release include the ability to wrap chains of fluent calls, introduce a local variable immediately after writing its initializer, .NET Core tooling support for analyzers, and an option to expand the list of completions for unimported types.
- JavaScript/TypeScript syntax classifications and refactorings are more responsive in files.
- Updated the C++ IntelliCode base model to be on-by-default and included Repeated Edits for C#.
- Support for TypeScript 3.6 and more responsive JavaScript/TypeScript refactorings.
- The Performance Profiler via ALT-F2 now provides a database tool for .Net Core projects.
- Added a prompt to install Docker Desktop when adding Docker Support.
- Added the capability to load symbols manually for Azure Watson and .NET Core remote debugging.
- Restored certificate generation and improved the UWP Package signing experience.
Top Issues Fixed in Visual Studio 2019 version 16.3.0
- "Create Test Certificate" option missing from UWP SDK in VS2019
- VS2019 - Query designer stopped working
- Project Properties - Code Analysis - Text is WRONG
- Visual Studio 2019 freezes and crashes on creating new project
- Editor and productivity features are not fully localized in Visual Studio 2019 16.3 Preview 3
- Problem with command Tab order (in design mode)
- Error: Some or all identity references could not be translated.
- Visual Studio 16.2 hangs opening any dialog for editing
- error MSB6006: "CL.exe" exited with code 2.
- Blank code metrics result
- VS2019 is crashing during start of the debug session if "Enable Edit and Continue" is switched off.
- Visual Studio 2019(16.0.2) generator incorrect code with inline+/O2 in Qt 5.12.3 QBezier
- Error Signing into VS Feedback Tool
- Rename refactoring does not work in files included in Shared Projects - Rename operation was cancelled or is not valid
- Brace completion when member list is up does not put the character in the right position
- Problem with command Tab order (in design mode)
- error MSB6006: "CL.exe" exited with code 2.
- Error Signing into the VS Feedback Tool
- blank code metrics result
- Rename refactoring does not work in files included in Shared Projects - Rename operation was cancelled or is not valid
- C++/CLI bug with inline namespaces header
- Error: Some or all identity references could not be translated.
- rvalue-reference-to-array can bind to lvalue-reference-to-array
- Brace completion when member list is up does not put the character in the right position
- Secure Secrets with Azure Key Vault Not In Connected Services List
- VS file search is signficantly slower than VA file search
- Visual Studio crash when TFS is not found.
- Visual Studio error displaying .razor file.
- Increase AndroidClientHandler timeouts.
- "Create Test Certificate" option missing from UWP SDK in VS2019.
Details of What's new in Visual Studio 2019 version 16.3.0
.NET Framework 4.8
The .NET Framework 4.8 development tools have been added to support targeting .NET Framework 4.8. The .NET Framework 4.8 offers several new features and improvements as well as numerous reliability, stability, security, and performance fixes. Find more details about the .NET Framework 4.8 in the .NET Framework 4.8 blog announcement
.NET productivity
- Developers can now rename a file when renaming an interface, enum, or class. Place the cursor in the class name and type (Ctrl + R,R) to open the Rename dialogue and check the ‘Rename file’ box.

- You can now Edit and Continue support for multi-targeted projects which includes modules loaded multiple times in the same process on different domains or load contexts. In addition, developers can edit source files even when the containing project is not loaded or the application is running.
- You can now wrap chains of fluent calls with a refactoring. Place your cursor on a call chain and press (Ctrl+.) to trigger the Quick Actions and Refactorings menu. Select either Wrap call chain or Wrap and align call chain.
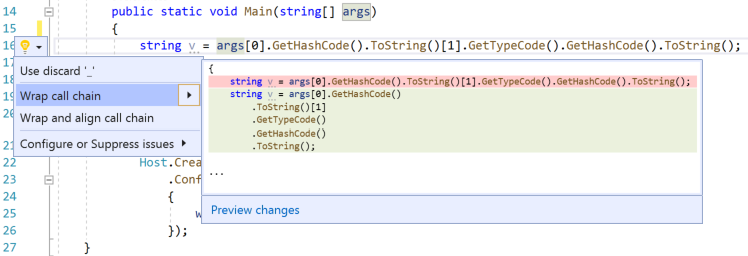
- Users can now introduce a local variable immediately after writing its initializer. First, write an expression. Then place the cursor in the expression name and press (Ctrl+.) to trigger the Quick Actions and Refactorings menu. Select the option to introduce a local variable.

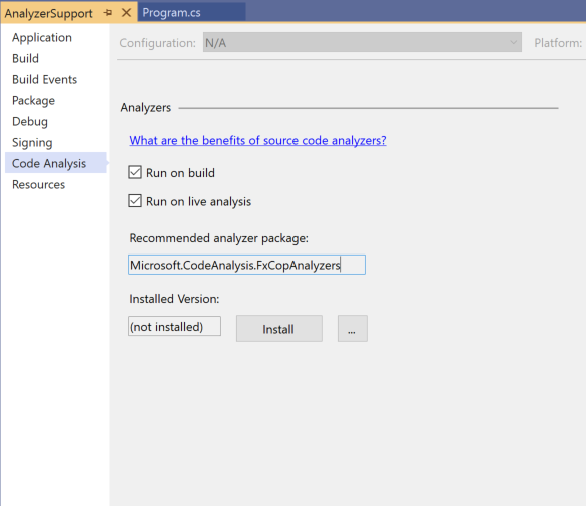
- There is now .NET Core tooling support for analyzers. Users can add the most recommended analyzer package by right clicking on the project name within the solution explorer and select properties. Select Code Analysis to install the analyzer package and to configure when to run code analysis.
- Previously, we added IntelliSense completion for unimported types. This feature came with the option to turn it off for users who did not want unimported types always populating their IntelliSense. Now, for users who turn off the completion for unimported types, it's much easier to get it back in the completion list with the new imported type filter added to the IntelliSense toggles.


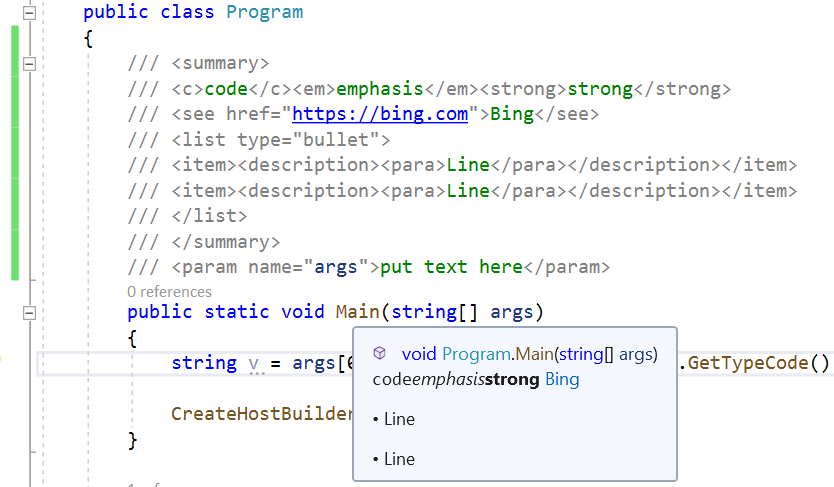
- There is now Quick Info style support for XML comments. Place the cursor over the method name. Quick Info will then display the supported styles from the XML comments above the code.
WPF/UWP Tooling
Customers building WPF/UWP applications will see the following improvements in Visual Studio XAML tooling:
Designer:
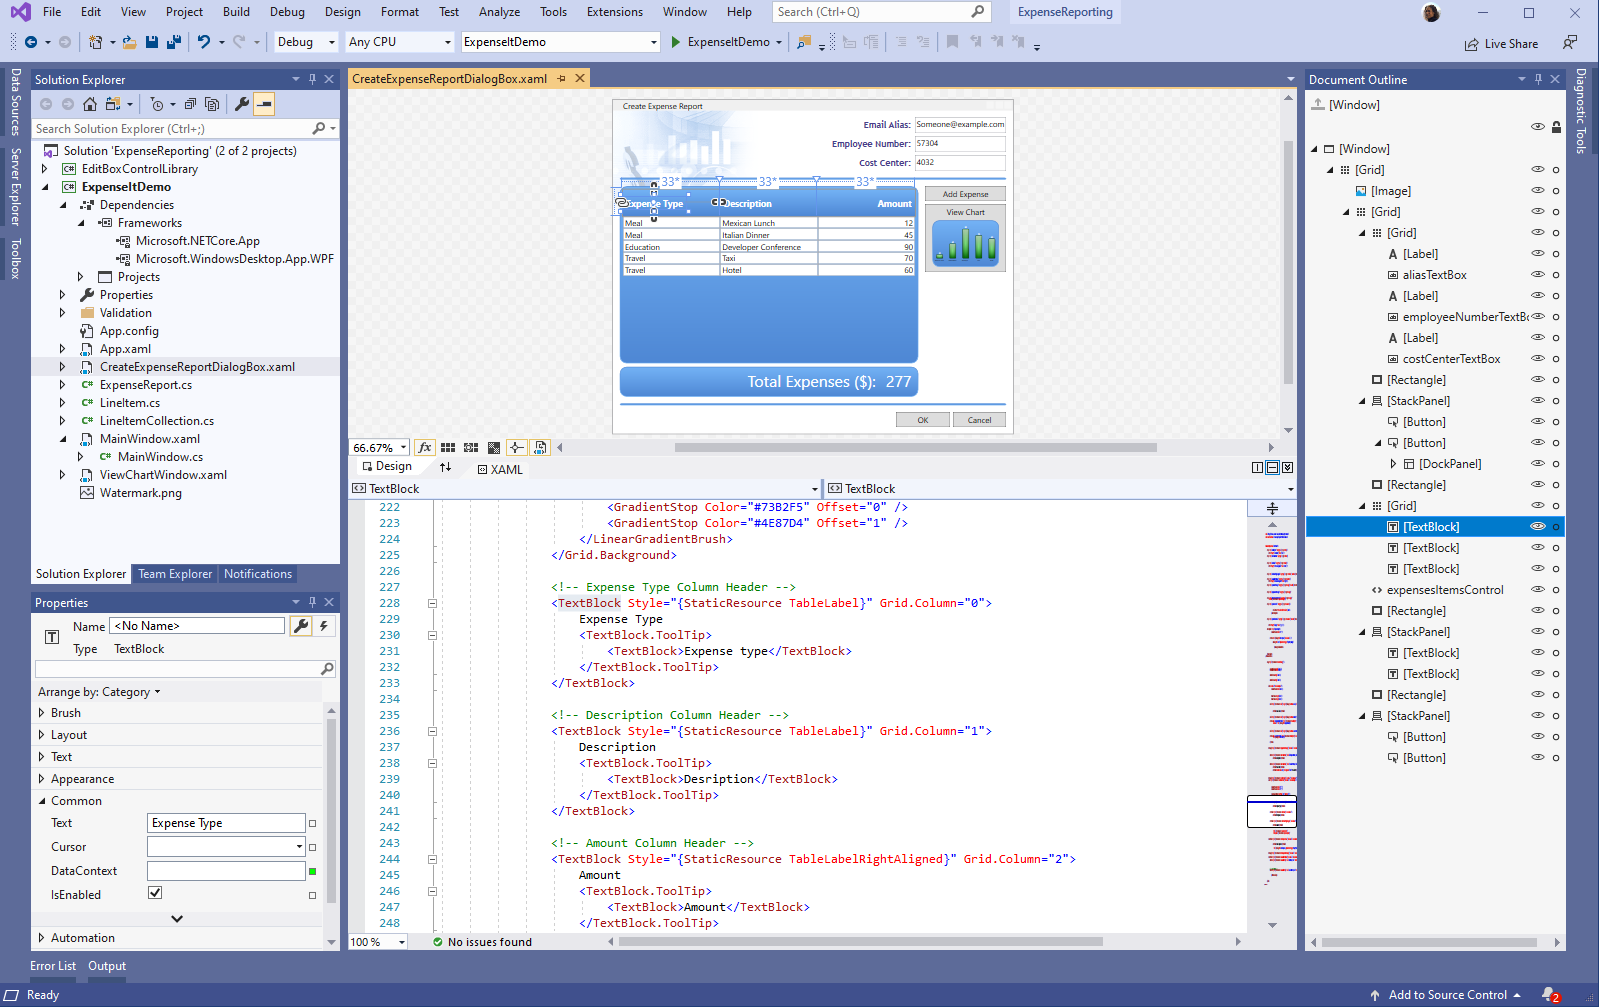
- WPF Designer now fully available (GA) for WPF .NET Core Projects: The XAML Designer for WPF .NET Core applications is now generally available (GA) to all customers without the need for preview feature flag. The XAML Designer for WPF .NET Core applications is slightly different in some behaviors and functionality then WPF .NET Framework Designer, please note this is by design. Given the difference we’d like to encourage customers to report any problems or limitations that you might be running into using Visual Studio feedback feature.
XAML Debugging Tools:
- XAML Hot Reload support added for WPF resource dictionaries changes: XAML Hot Reload now supports updating WPF Resource Dictionaries for real-time updates in the application. Previously this feature was only available to Universal Windows Platform (UWP), but is now supported for WPF .NET Framework, WPF .NET Core and UWP apps. Supported actions include adding a new Resources section definition and adding, deleting and updating resources new/existing sections.
- In-app toolbar now movable: The in-app toolbar has been enhanced so that it is movable within the running WPF/UWP application, enabling developers to drag it left or right within the app to unblock app UI. Note that position to which the toolbar is moved is not stored between sessions and will go back to the default position when your app is restarted.

UWP Package Signing.
- Brought back the ability to create and import signing certificate files (.pfx) through the Manifest Designer.
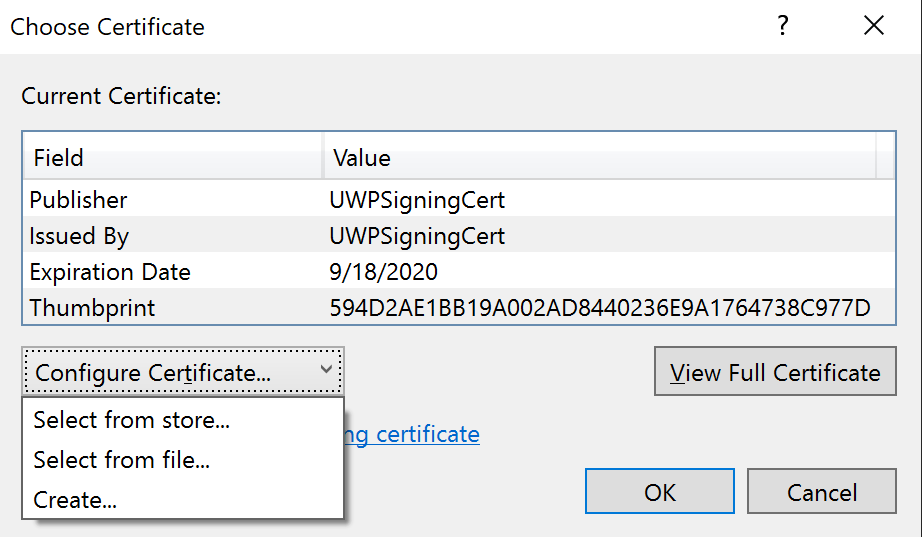
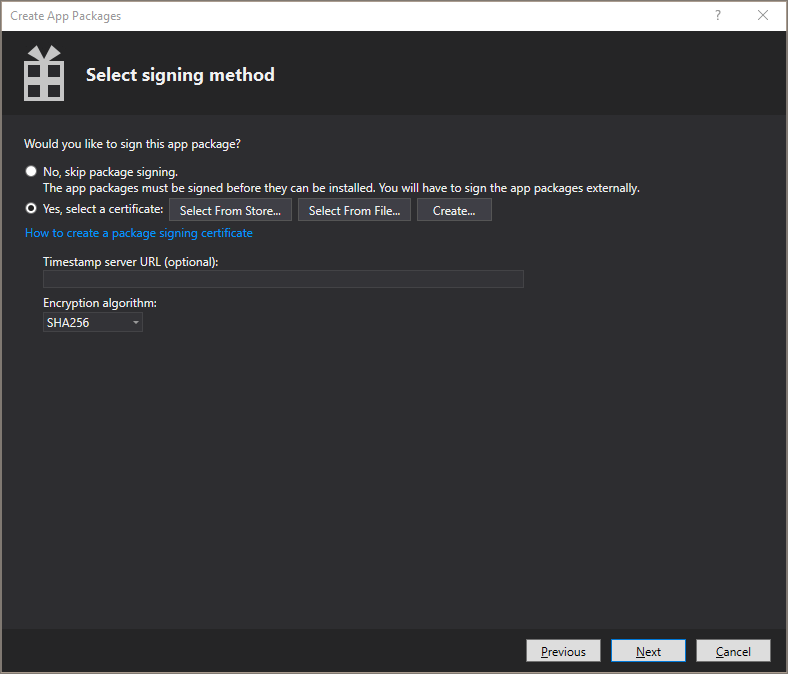
- Introduced the ability to create and import signing certificates through the Packaging Wizard to streamline the signing process.
.NET tools
- Support for adding new Open API & GRPC service references to .NET Core 3.0 projects.
- Publish .NET Core 3.0 worker projects Azure Container Registry, DockerHub, etc.
- .NET Core 3.0 templates for Worker, gRPC, Razor Class library & Blazor are surfaced in the New Project Dialog.
- Any updates made to the .NET Core 3.0 templates via the .NET CLI are also surfaced in Visual Studio.
C++
- C++ developers can now toggle line comments using the keyboard shortcut Ctrl + K, Ctrl + /.
- IntelliSense member lists are now filtered based on type qualifiers, e.g.
const std::vectorwill now filter out methods such aspush_back. - Added the following C++20 Standard Library preview features (with
/std:c++latest): - New C++ Core Guideline checks, including the new "Enum Rules" rule set, and additional const, enum, and type rules.
- A new default semantic colorization scheme allows users to better understand their code at a glance, the call-stack window can be configured to hide template arguments, and C++ IntelliCode is on-by-default.
- Configure debug targets and custom tasks with environment variables using CMakeSettings.json or CppProperties.json or the new "env" tag on individual targets and tasks in launch.vs.json and tasks.vs.json.
- Users can now use a quick action on missing vcpkg packages to automatically open a console and install to the default vcpkg installation.
- The remote header copy done by Linux projects (CMake and MSBuild) has been optimized and now runs in parallel.
- Visual Studio's native support for WSL now supports parallel builds for MSBuild-based Linux projects.
- Users can now specify a list of local build outputs to deploy to a remote system with Linux Makefile projects.
- Setting descriptions in the CMake Settings Editor now contain more context and links to helpful documentation.
Container Tools
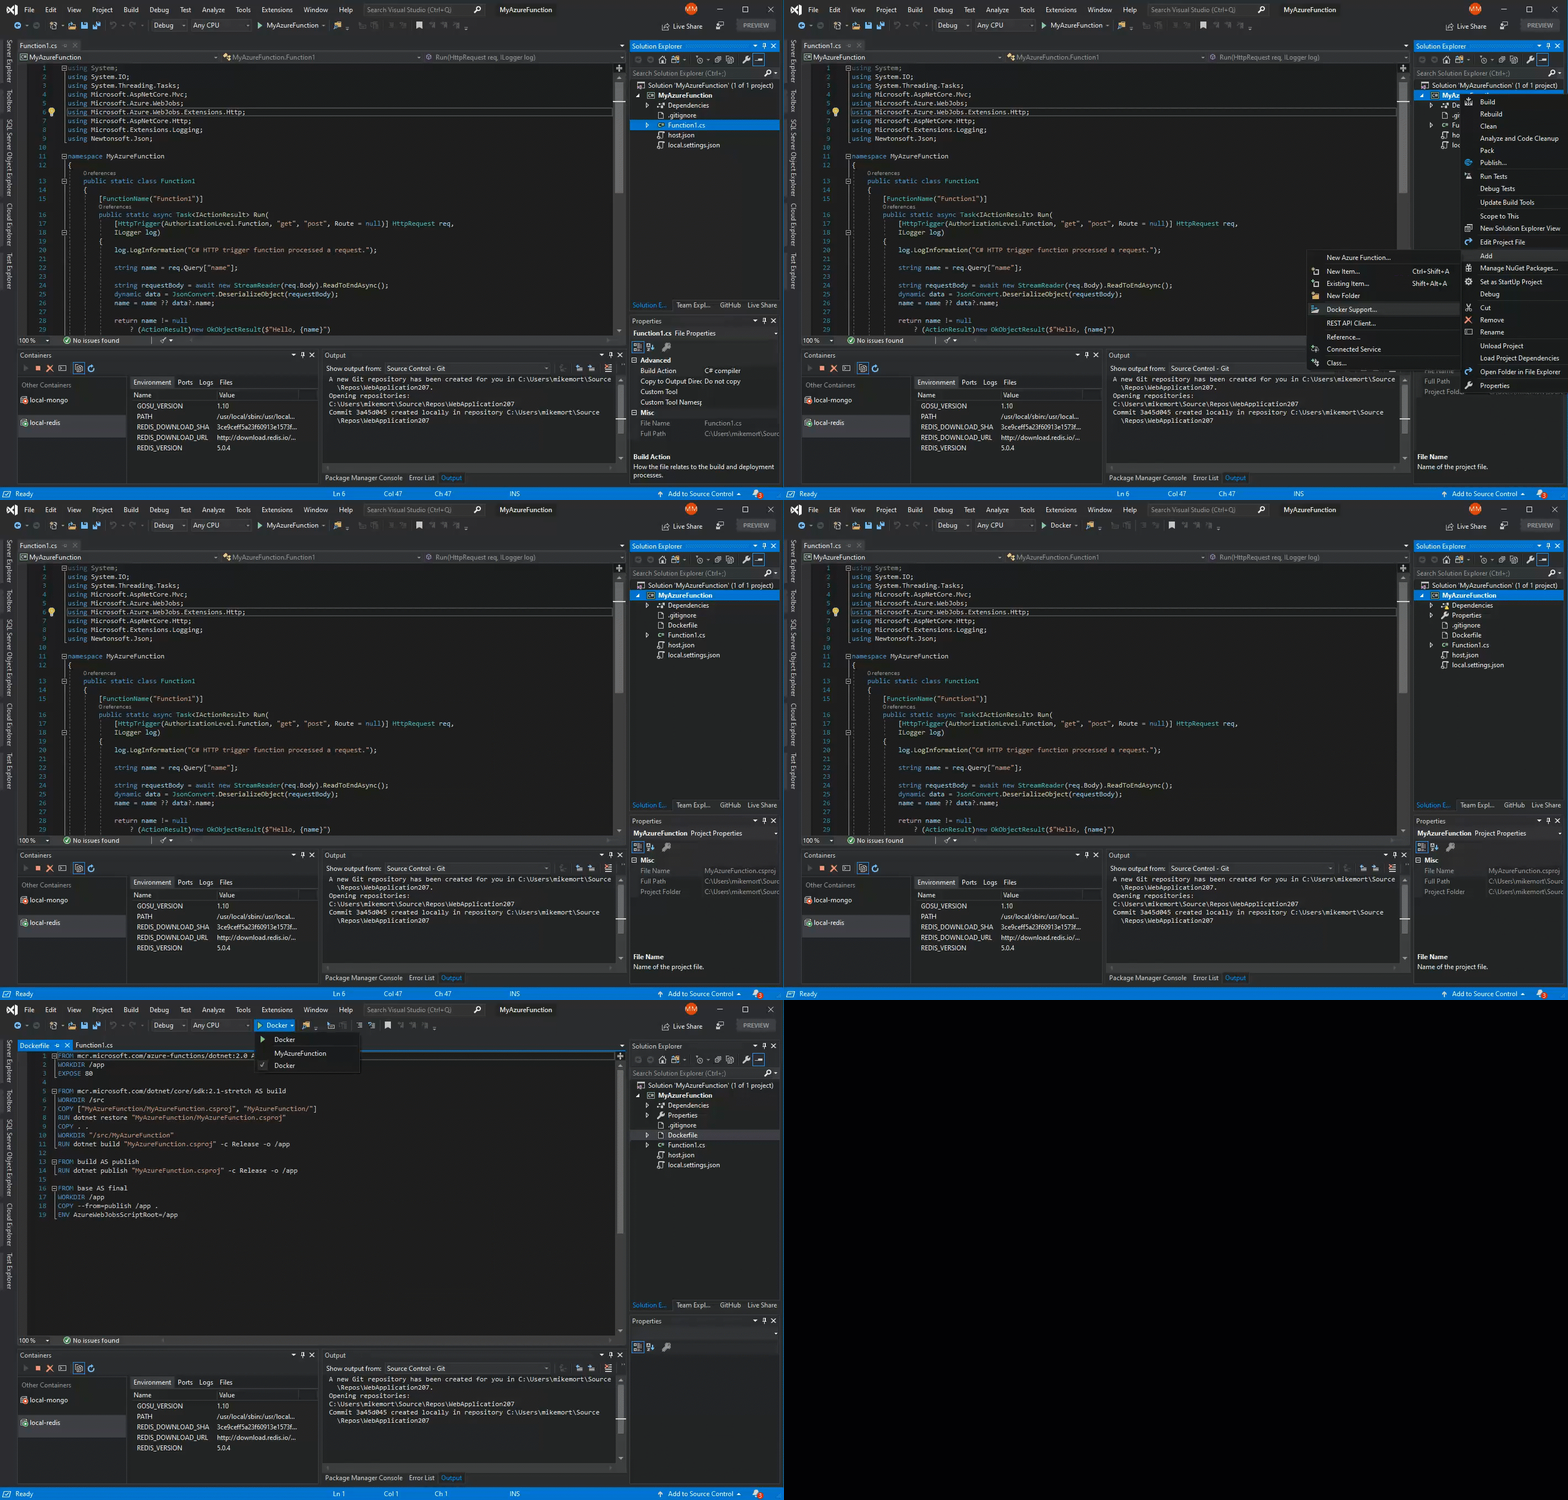
- Developers building Azure Functions (v2) can now add Docker container support (Linux only) to their C# projects. This can be done by right clicking the project name in Solution Explorer and selecting "Add" --> "Docker Support". In addition to adding a Dockerfile to your project the debug target will be set to "Docker". What this means is debugging of Functions code will happen inside of the running container. Users will be able to hit breakpoints, inspect variables, and use all the powerful debugging features Visual Studio provides.
Database Profiling for .Net Core projects
This release includes a new tool in the suite of performance and diagnostics tools available via the Performance Profiler (ALT-F2). The new database tool will provide details about queries from .Net Core projects which utilize ADO.Net or Entity Framework. The tool provides a "go to source" option for linking to source code and provides timing details for each query executed during a profiling session. This tool can work simultaneously with other tools in the Performance Profiler. When used in conjunction with the CPU Usage tool, one gains detailed information about the performance characteristics of .Net Core code which uses a database.
Debugger
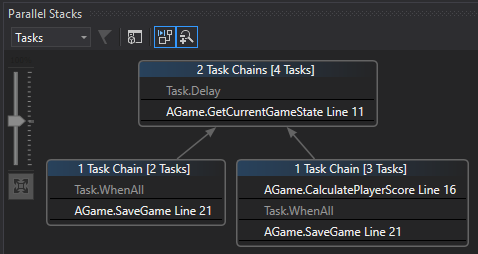
- The Parallel Stacks Window has improved the visualization of tasks and their dependencies in a process to make it easier to diagnose problems in asynchronous code.
F# and F# tools
This release includes support for F# 4.7, the newest version of the F# language!
Much of F# 4.7 was dedicated to underlying infrastructural changes that allow us to deliver preview of F# language functionality more effectively. That said, there are still some nice new features delivered as well.
F# language and core library
We added support for F# 4.7, a minor language release that comes with compiler infrastructure to enable preview features so that we can get feedback on feature designs earlier in the development process.
The full F# 4.7 feature set is:
- Support for the
LangVersionflag, which allows for configuring the F# language version used by the compiler to be F# 4.6 or higher - Support for implicit yields in array, list, and sequence expressions
- Indentation requirement relaxations for static members and constructors
- Relaxing the need for a double-underscore (
__) in member declarations andforloops, contributed by Gustavo Leon - FSharp.Core now targets
netstandard2.0instead ofnetstandard1.6, following the deprecation of support for .NET Core 1.x - FSharp.Core on .NET Core now supports
FSharpFunc.FromConverter,FSharpFunc.ToConverter, andFuncConvert.ToFSharpFunc - FSharp.Core now supports
Async.Sequentialand an optionalmaxDegreeOfParallelismparameter forAsync.Parallel, contributed by Fraser Waters
In addition to the F# 4.7 feature set, this release includes support for the following preview F# language features:
- Support for
nameofexpressions - Support for opening of static classes
You can enable this by seeting <LangVersion>preview</LangVersion> in your project file.
This release also contains the following bug fixes and improvements to the F# compiler:
- A longstanding issue where the F# compiler could stack overflow with massive records, structs, or other types has been resolved (#7070)
- An issue where specifying invalid inline IL could crash Visual Studio has been resolved (#7164
- Resolution of an issue where copying of a struct would not occur if it was defined in C# and mutated in a member call (#7406)
- A crypto hash of the portable PDB content created by the compiler is not included in the PE debug directory, with a configurable hash set to SHA-256 by default (#4259, #1223)
- A bug where
LeafExpressionConverterignoredValueTypeand assumedSystem.Tuplehas been fixed (#6515) by Kevin Malenfant - A bug where
List.transposediscaded data instead of throwing an exception has been resolved (#6908) by Patrick McDonald - A bug where
List.map3gave a misleading error when used on lists of different lengths has been resolved (#6897) by reacheight
F# tools
This release also includes a few improvements to the F# tools for Visual Studio:
- Records are formatted more to look more like canonical declarations and values in tooltips and F# interactive (#7163)
- Properties in tooltips now specify whether or not that are
get-only,set-only, orgetandset(#7007) - An issue where Go to Definition and other features could not always work across projects when files use forward slashes (#4446, #5521, #4016) has been fixed, with help from chadunit
- Issues with anonymous records and debugging have been resolved (#6728, #6512)
- A bug where empty hash directives in source could make source text coloring seem random has been resolved (#6400, #7000)
IDE
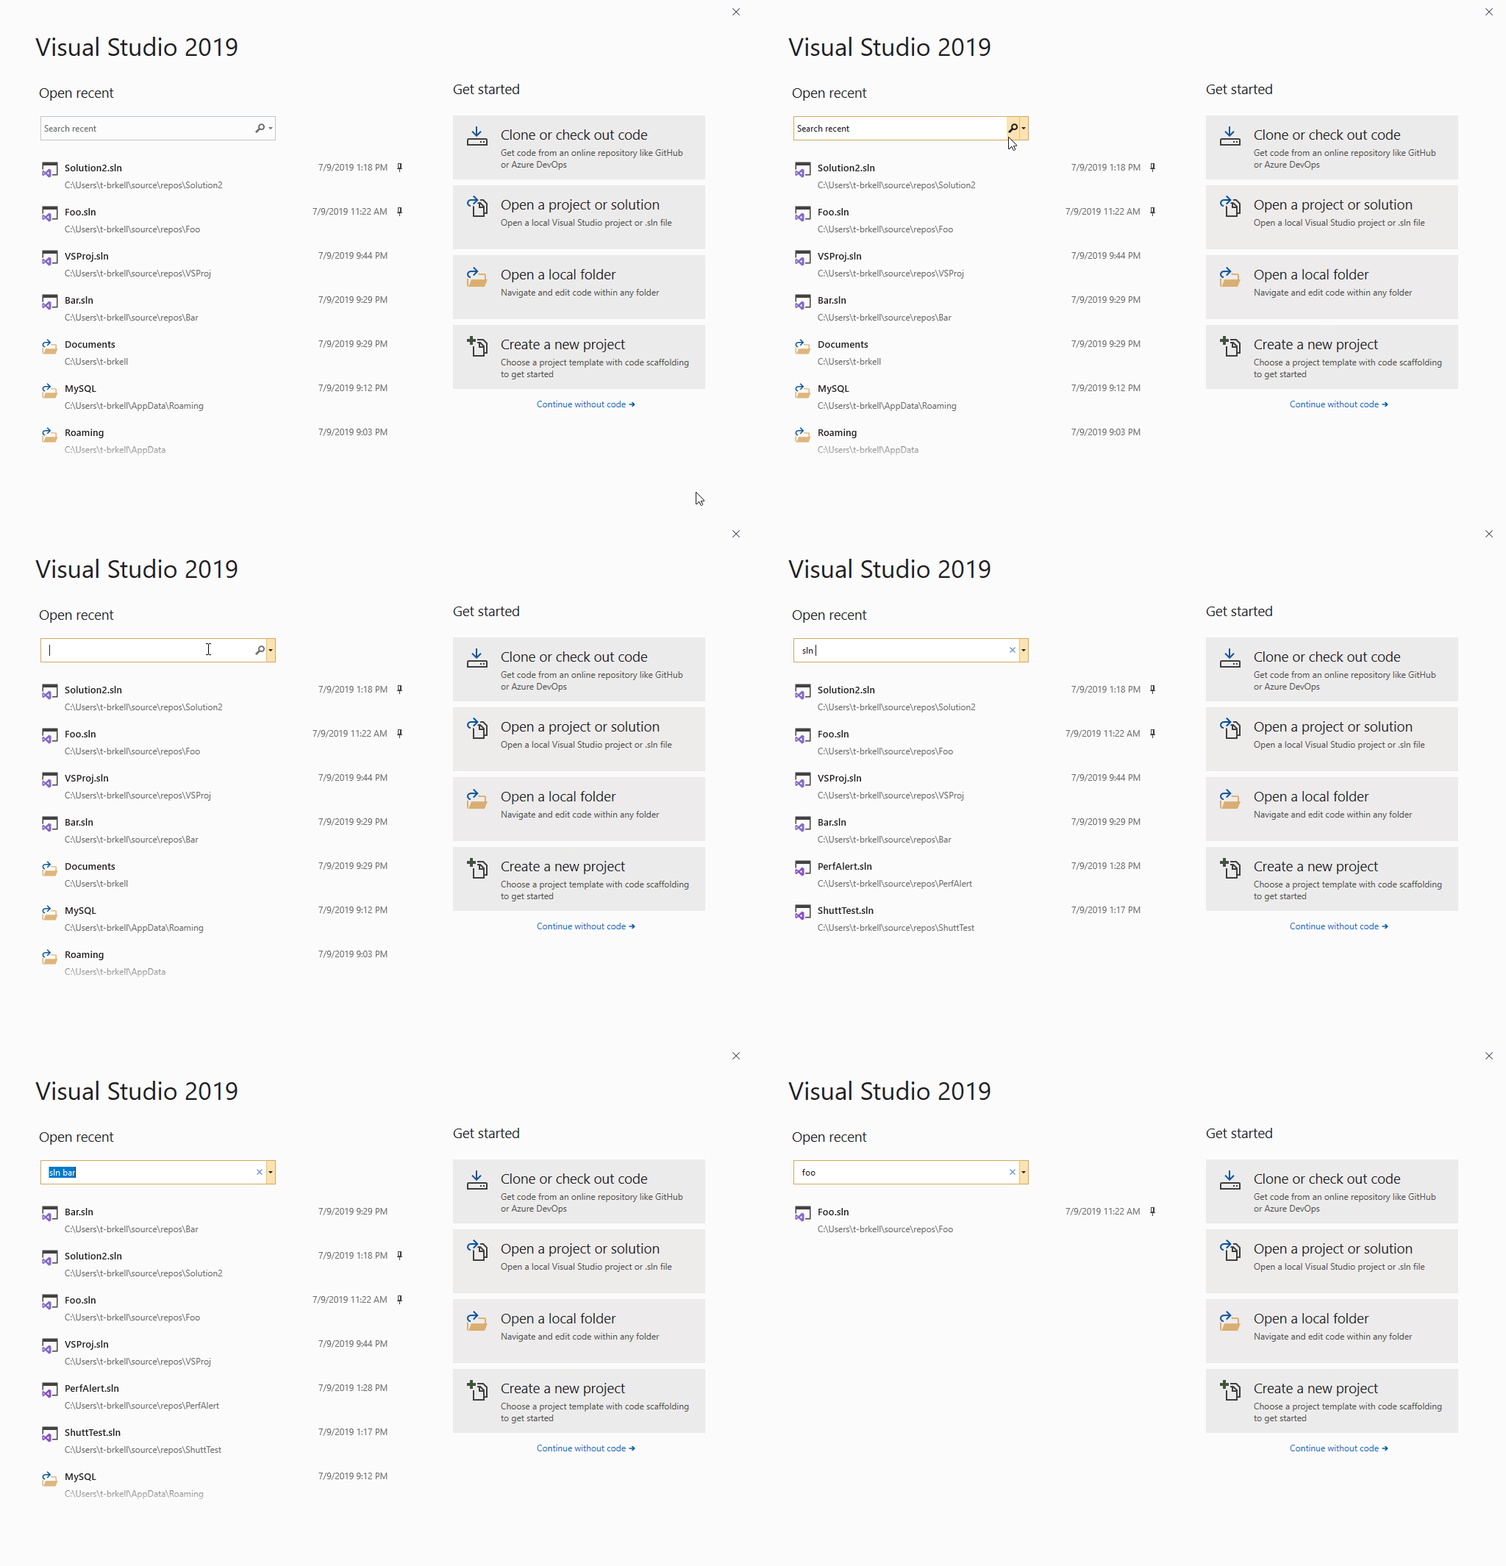
- A search box in the start window allows you quick location of recently used projects, solutions, and folders. In addition, these MRU code containers integrate with Visual Studio global search so developers can find them through the Visual Studio search box.
- Improvements to the Installer dialog interface within the Visual Studio IDE makes it easier to identify specific workloads being added to Visual Studio.
- VS Search will support the ability to search for types and members with C# and VB, as well as file search for all languages. Results will show up as users type their search query, as well as in a dedicated ‘Code’ group accessible via keyboard shortcut or mouse click.
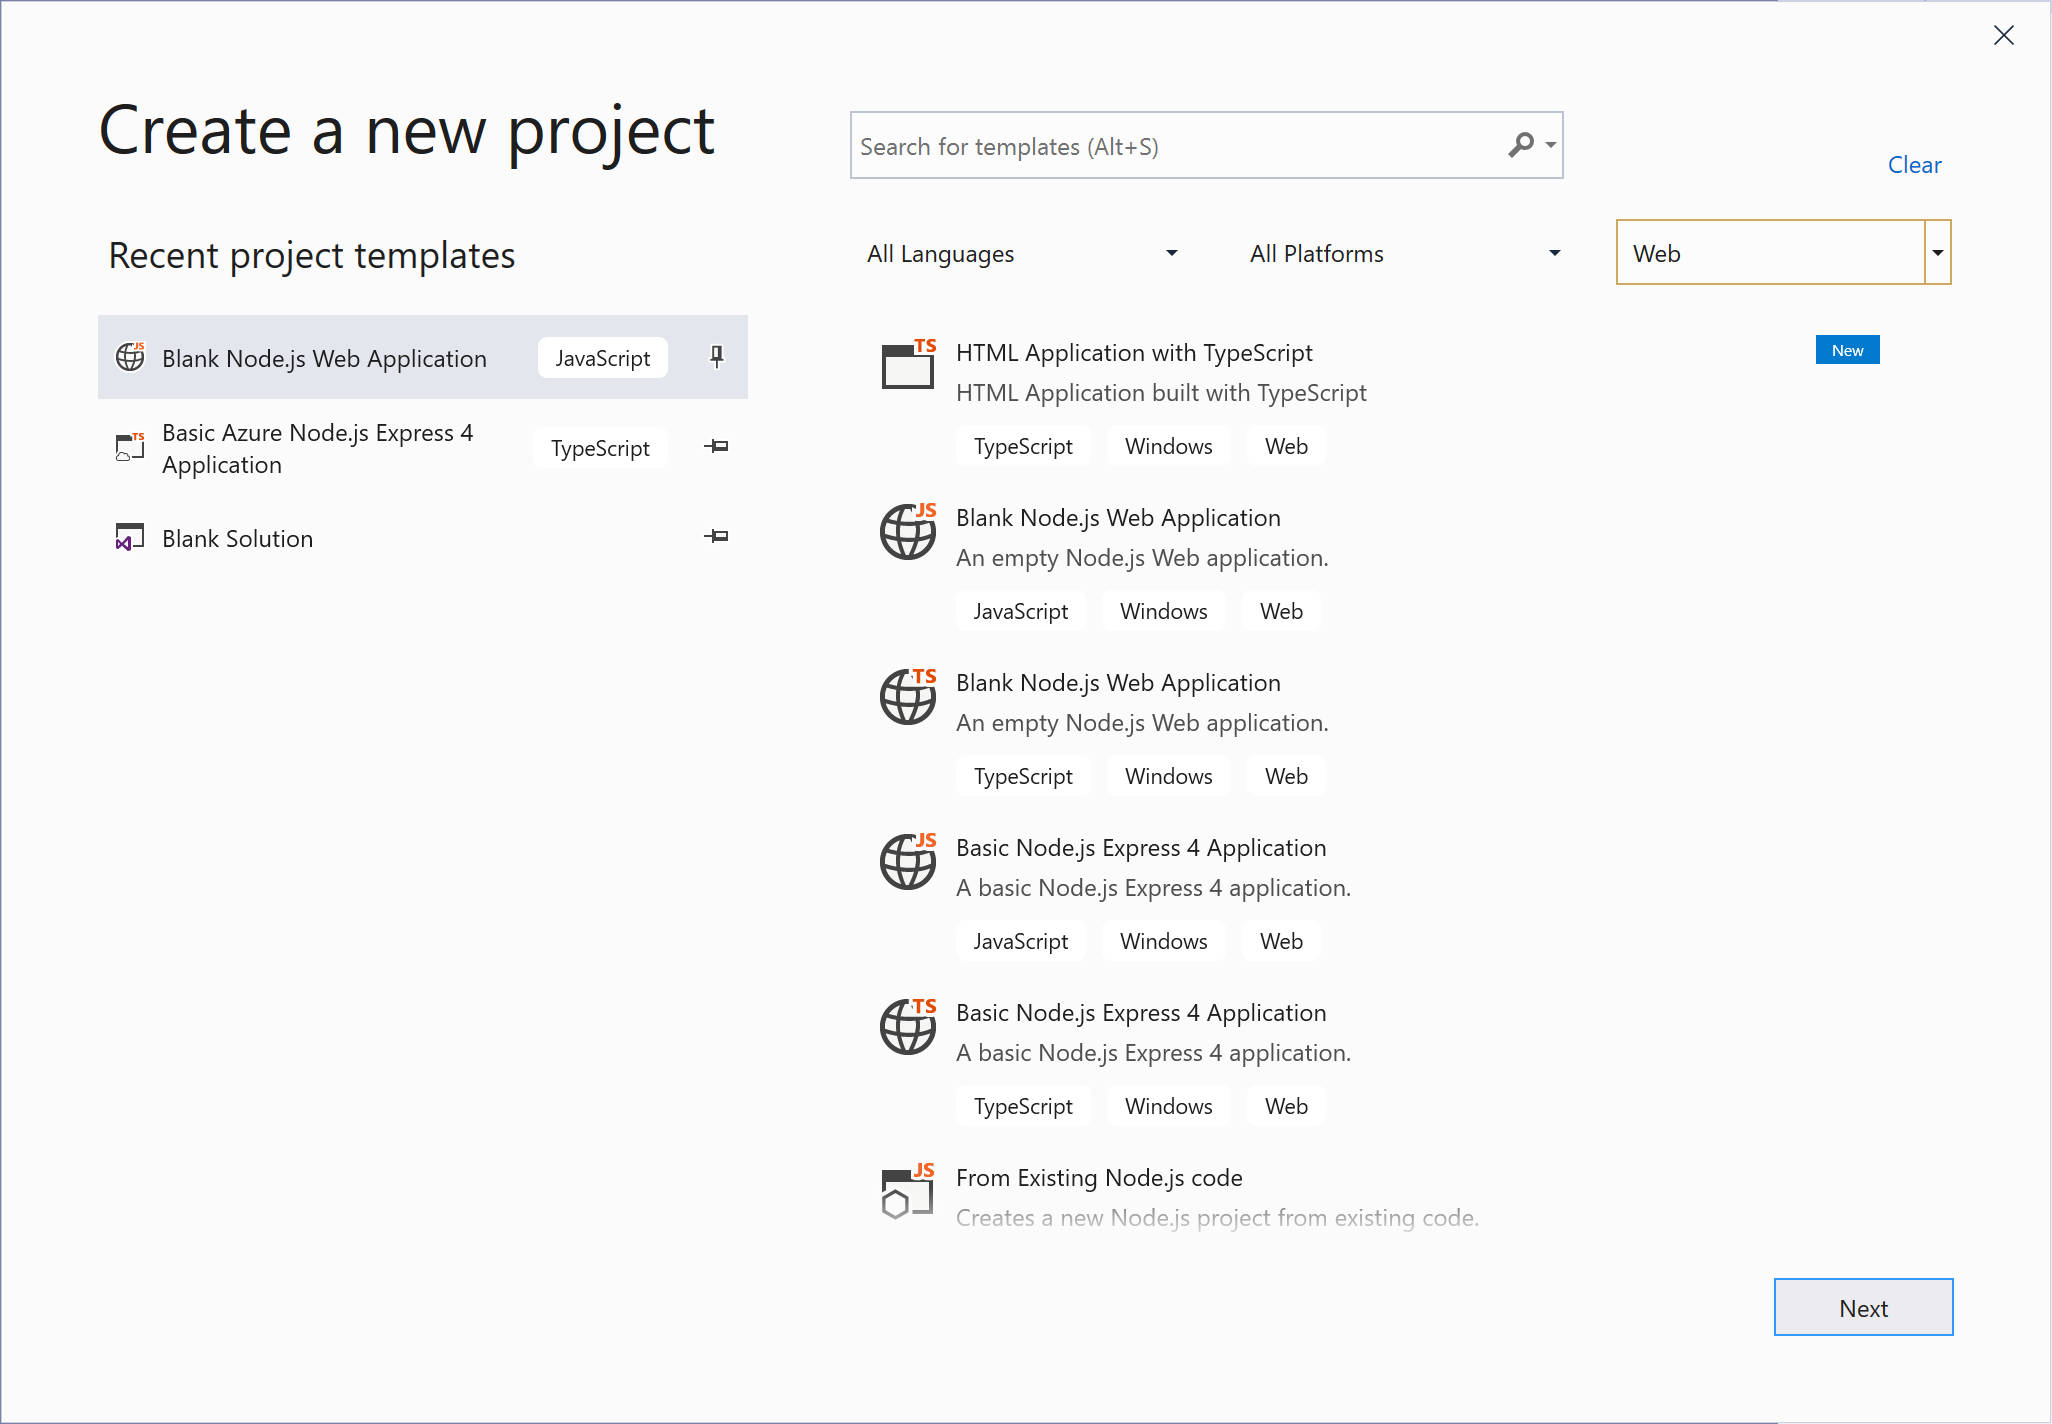
- Newly installed project templates are indicated with a "New" label to allow quick identification, and filters show selected values in the New Project Dialog. In addition, developers can organize recently used templates by pinning, unpinning, and removing them from the list.
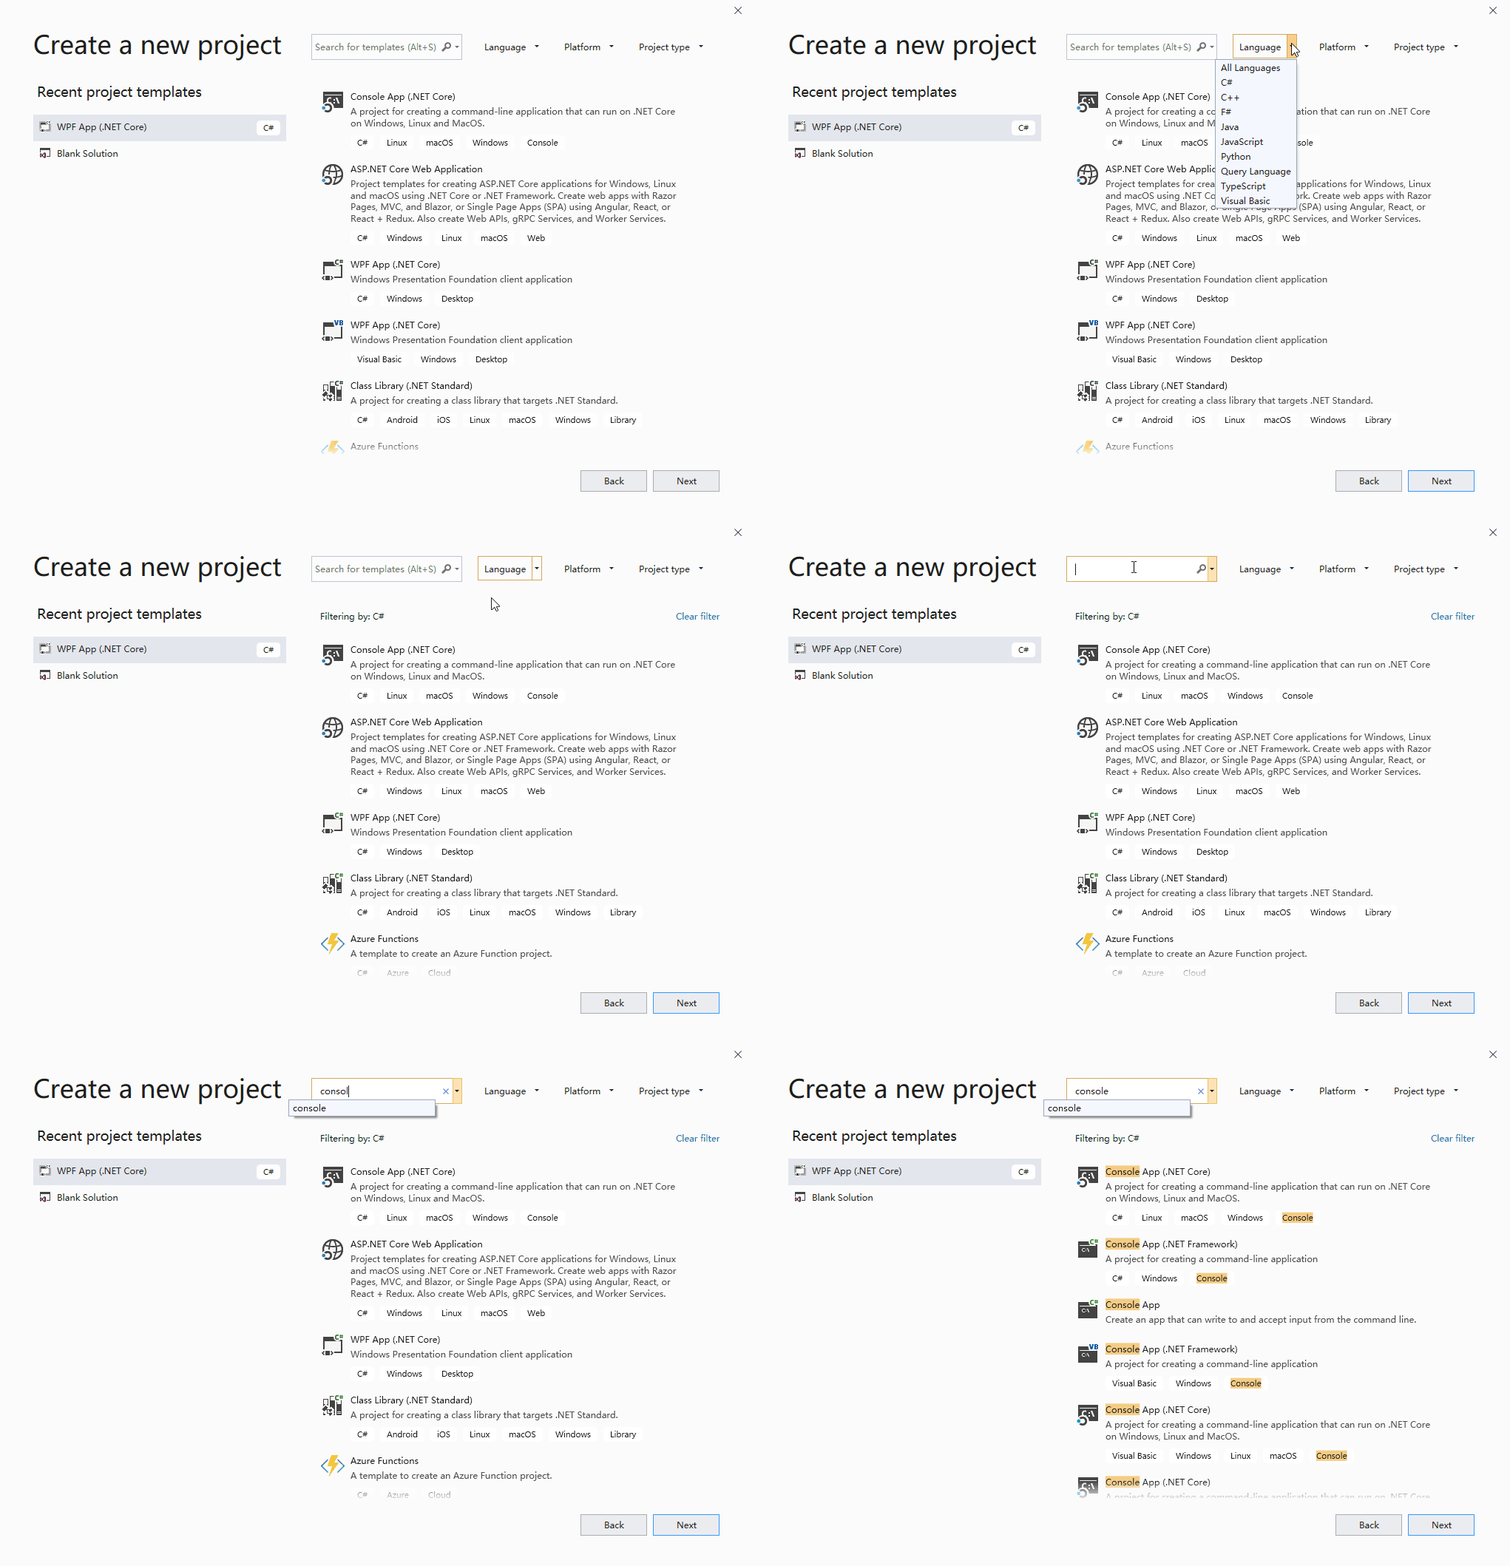
- Search for templates in the New Project Dialog through a more robust fuzzy search which adapts with typos and plurals to highlighting matching keyword and rank results based on search and filter relevance.
Installer
- Visual Studio now updates both the Visual Studio IDE and the Installer with a single click for increased productivity.
- The Visual Studio installer components for .NET Core 2.1 and 2.2 used to only carry the runtime. From this preview onwards the components will also carry the templates as well as the runtime.
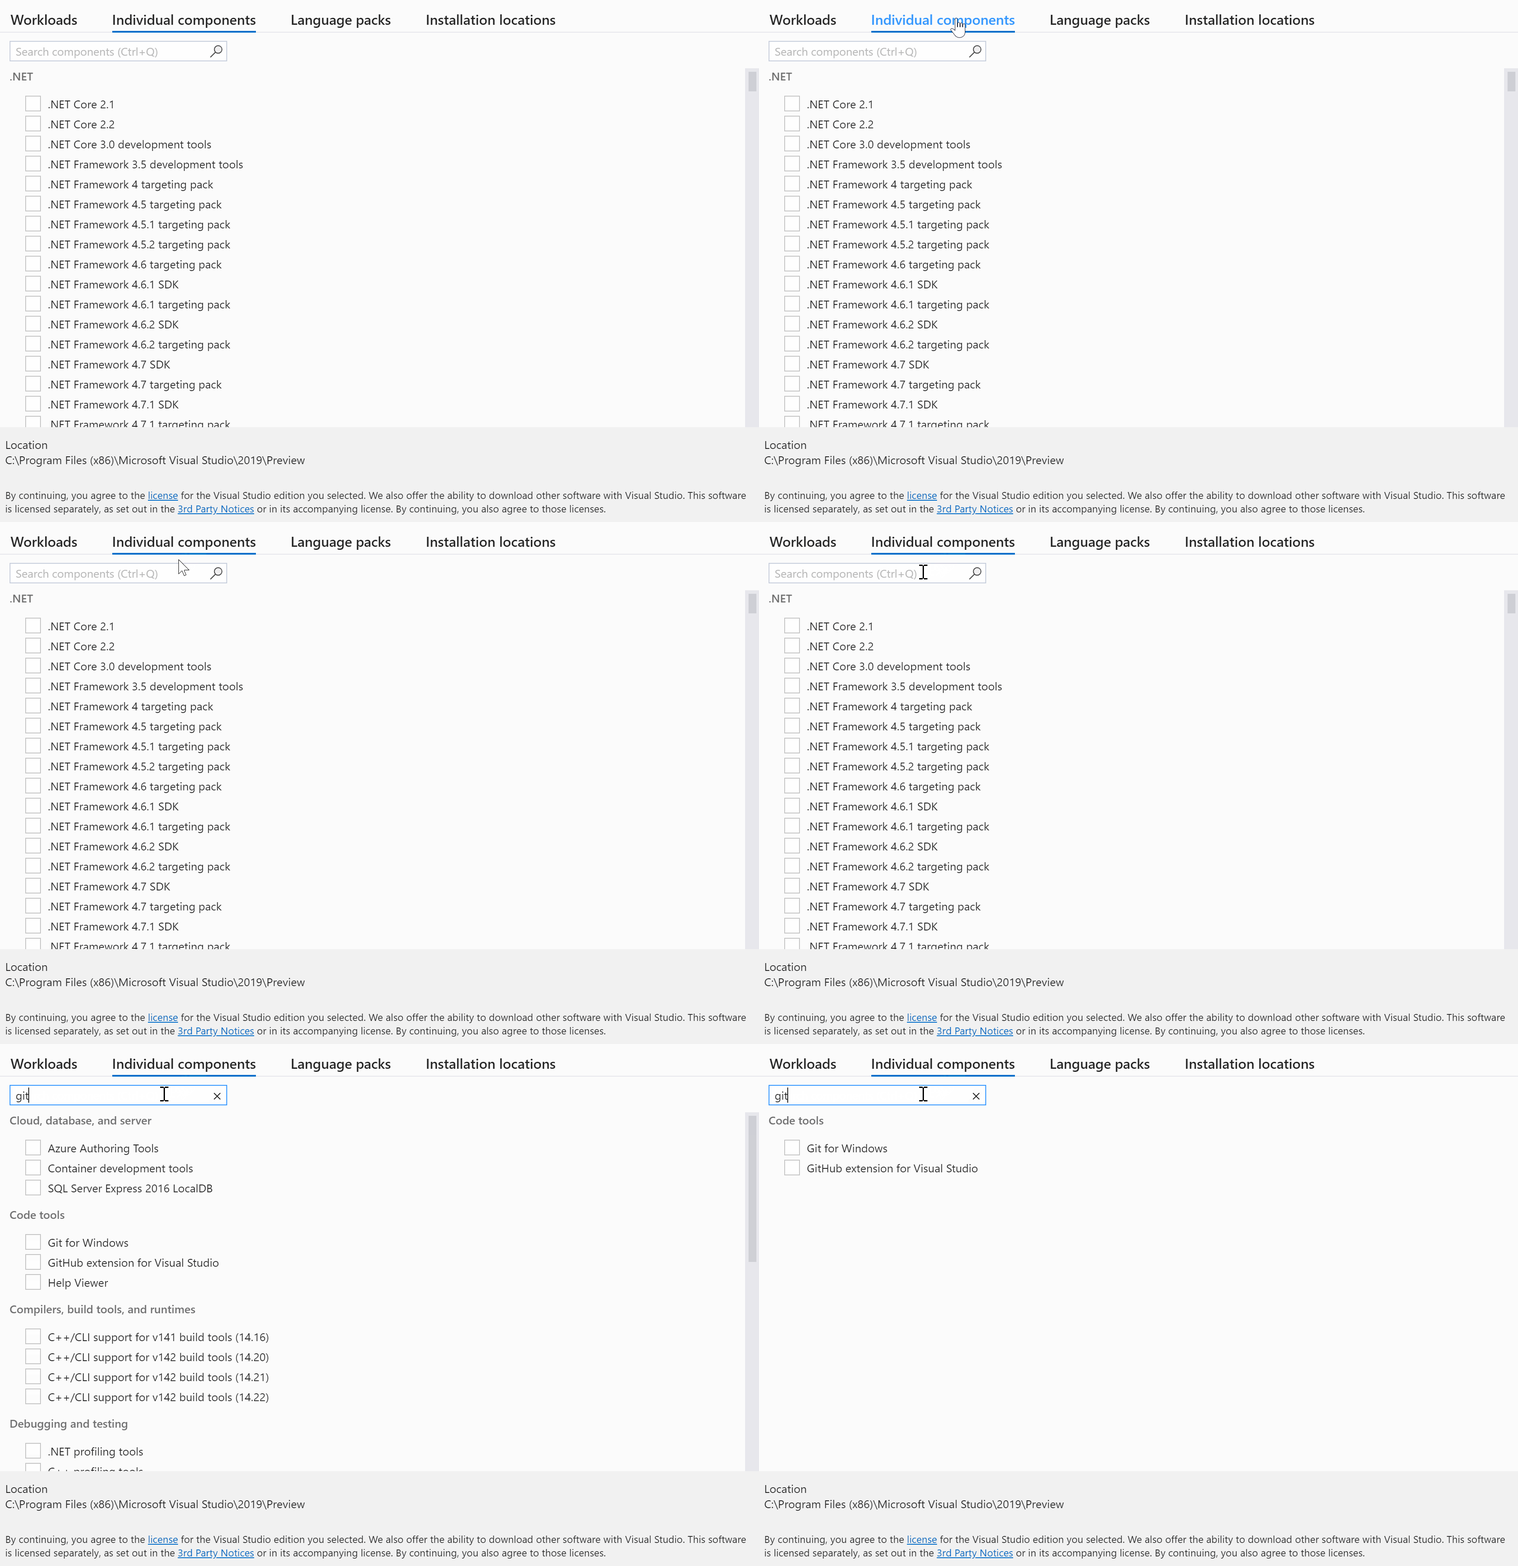
- A search box in the Visual Studio Installer's Individual components tab allows for quick location of all available components for installation.
IntelliCode
- The C++ base model has been turned on by default.
- You can change this setting by going to Tools > Options > IntelliCode.
- We've included Repeated Edits for C#, which analyzes local edits for repeatable changes and determines other places you may need this change within the same file.
- Suggested repeated edits will appear in the Error List and as warnings within the code file.
JavaScript/TypeScript
- JavaScript and TypeScript classification (commonly called “syntax coloring”) will be applied to large files more quickly. The list of JavaScript and TypeScript code fixes and refactorings (i.e. the lightbulb) will also be displayed more quickly.
- There is now editor support for TypeScript 3.6.
- When a tsconfig.json file is edited or changed, Visual Studio will now refresh the project more responsively.
Python Tests
- Python Developers can now run tests using the popular Python framework pytest in both Python projects and Open Folder workspace scenarios.
- To enable pytest and unittest for Python projects, right-click on the project solution name and select Properties. From there, select the Test tab to select testing options. Note that for unittest, you must specify the directory for the tests (root directory is the default) as well as the pattern for the test filenames. Test Discovery is intitiated as soon as changes are saved in the Test tab.
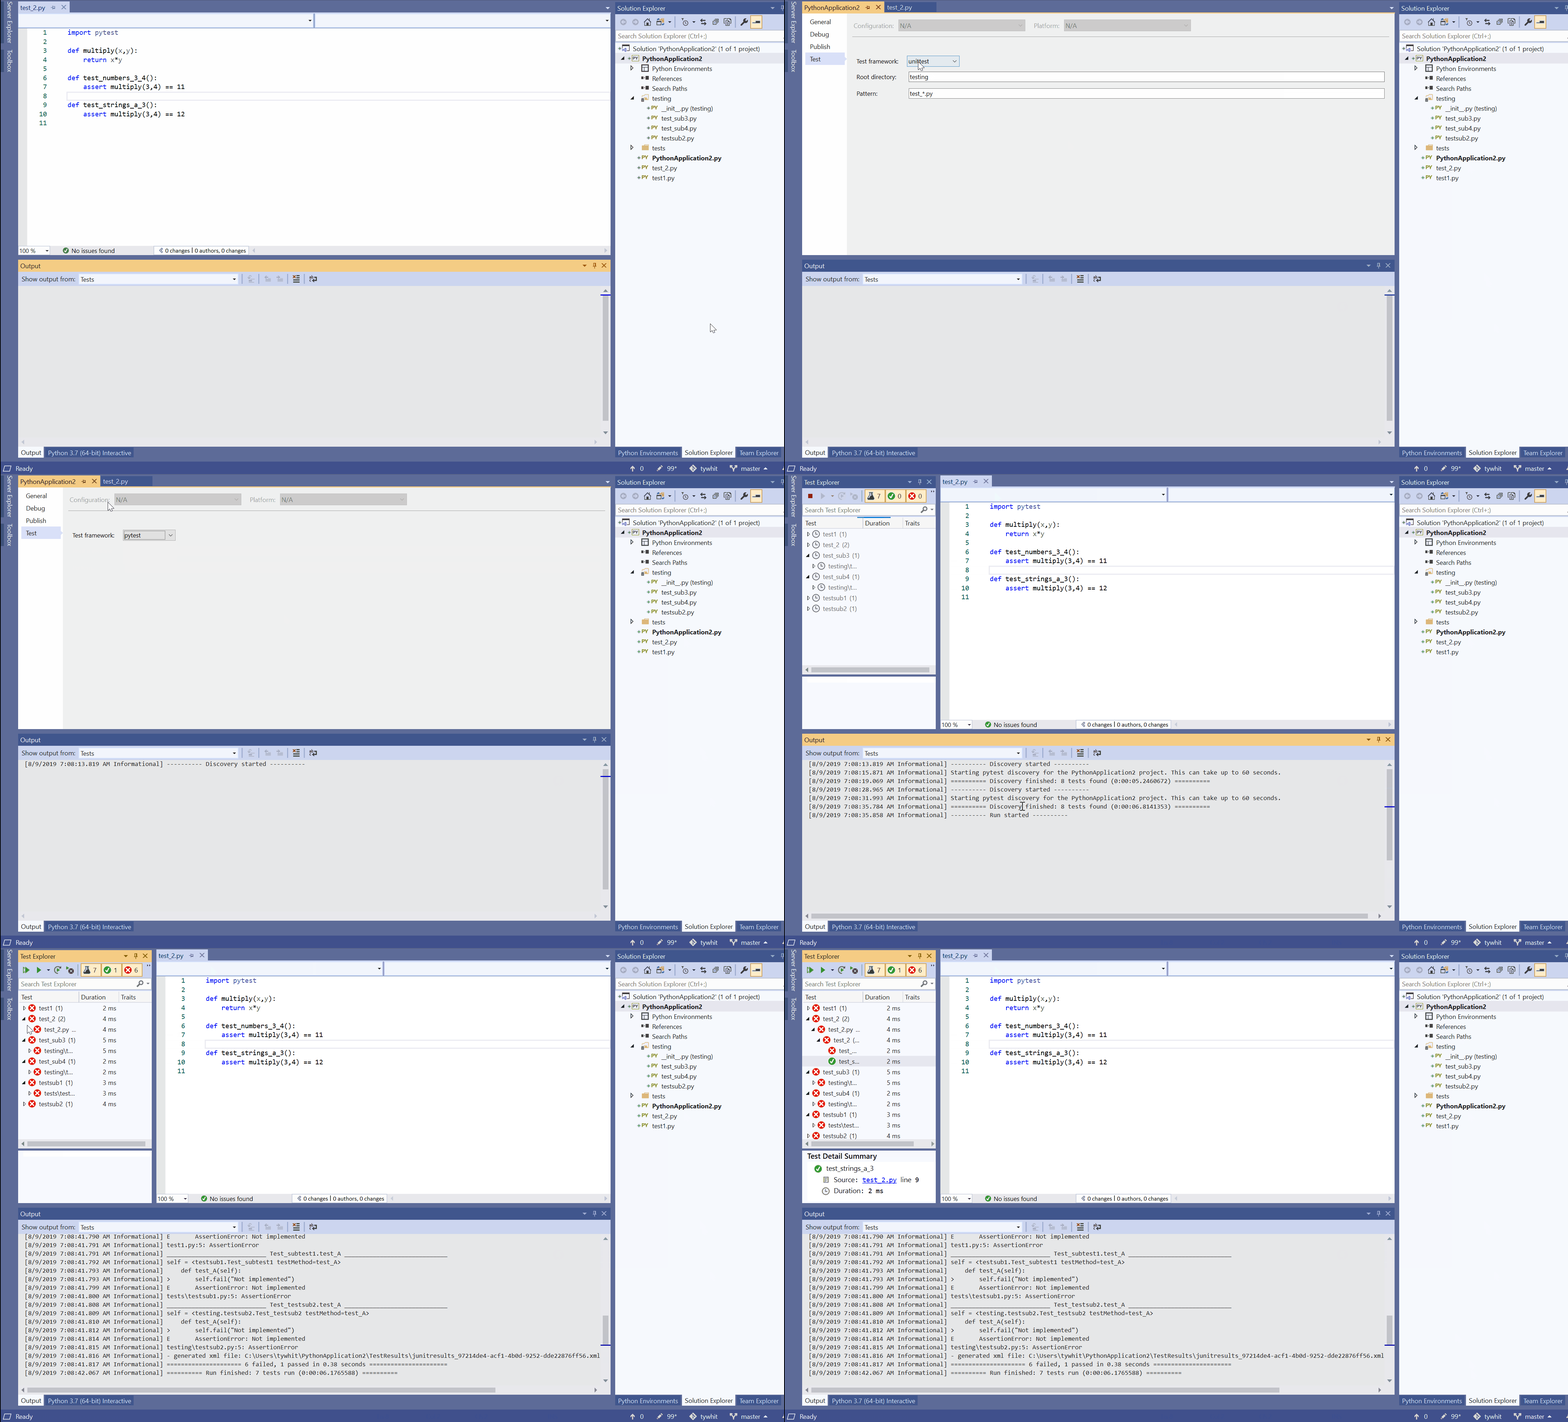
- The unittest testing experience has been reworked such that a user now needs to manually configure tests for both Python projects and Open Folder workspaces as these tests are no longer automatically discovered:
- To enable tests for Python folders, click on the
 icon to Show All Files in the Solution Explorer. From there, click on the PythonSettings.json file located within your 'Local Settings' folder (if there isn't a file there, create one). Within this file, you can specify the 'TestFramework' you wish to use as well as the test filename patterns and the directory that contains your tests (both options apply to unittest):

- Test debugging is updated to use PTVSD 4, but if users wish to continue using the 'Legacy Debugger' or run into any issues with using the new debugger, they can enable it by going to Tools > Options > Python > Debugging > Use Legacy Debugger and check the box to enable it.
- We have also made it simple for users with pre-existing projects and in open folder workspaces that contain test files to quickly continue working with their code in Visual Studio 2019. When users open a project that contains testing configuration files (e.g. a .ini file for pytest), but they have not installed or enabled pytest, they will be prompted to install the necessary packages and configure them for the Python environment they are working:

- Similarly for unittest test files within a project or open folder workspace, users will be prompted to install and/or enable the testing framework. For both scenarios, developers have the option to ignore the message and to manually configure the framework.
Visual Studio Performance Profiler
- The CPU Usage tool in the Performance Profiler automatically displays the "hot path" indicator with a red flame icon when displaying the Call Tree. This saves a click on common CPU Usage performance investigations. The CPU Usage tools is accessible by using Alt-F2 or from the Debug menu.
- The Performance Profiler now participates in forward/backward navigation in the Visual Studio IDE. As developers navigate to various views of tools in the Performance Profiler, navigation points are saved along with other navigation items. They can be employed by clicking the navigation buttons or using navigation commands in Visual Studio.

Web Tools
- Easily configure applications' dependencies in publish profiles using the new Add Dependency wizard. It currently supports adding dependencies to Azure SignalR Service, Azure SQL Server, Azure Storage allowing users to either provision new instances or select existing ones without leaving the IDE.
- The ASP.NET runtime team has enabled support for serving static content from within Razor class libraries due to popular demand. In this preview of Visual Studio, the team has added tooling support for this scenario.
Xamarin
This release includes the following Xamarin SDK updates:
- Xamarin.iOS 13
- Adds support for Xcode 11 to build and debug apps for iOS 13, tvOS 13, and watchOS 6. See our Introduction to iOS 13 for more details on the new features available.
- Xamarin.Android 10
- Android apps can now target Android 10 by setting Compile using Android version: (Target Framework) to Android 10.0 (Q) under the Application tab of the project property page. Android 10 introduces features such as dark theme, gestural navigation, and optimizations for foldable devices. See our Android 10 with Xamarin page for more information on these new features.

This release also includes several new tooling features and enhancements:
- A public preview of XAML Hot Reload for Xamarin.Forms is available in this release. XAML Hot Reload lets you rapidly iterate on your UI while debugging your app on an emulator, simulator, or physical device. Simply edit your XAML then save the file to see the changes immediately reflected on the running app. To enable XAML Hot Reload, go to Tools > Options > Xamarin > Hot Reload.
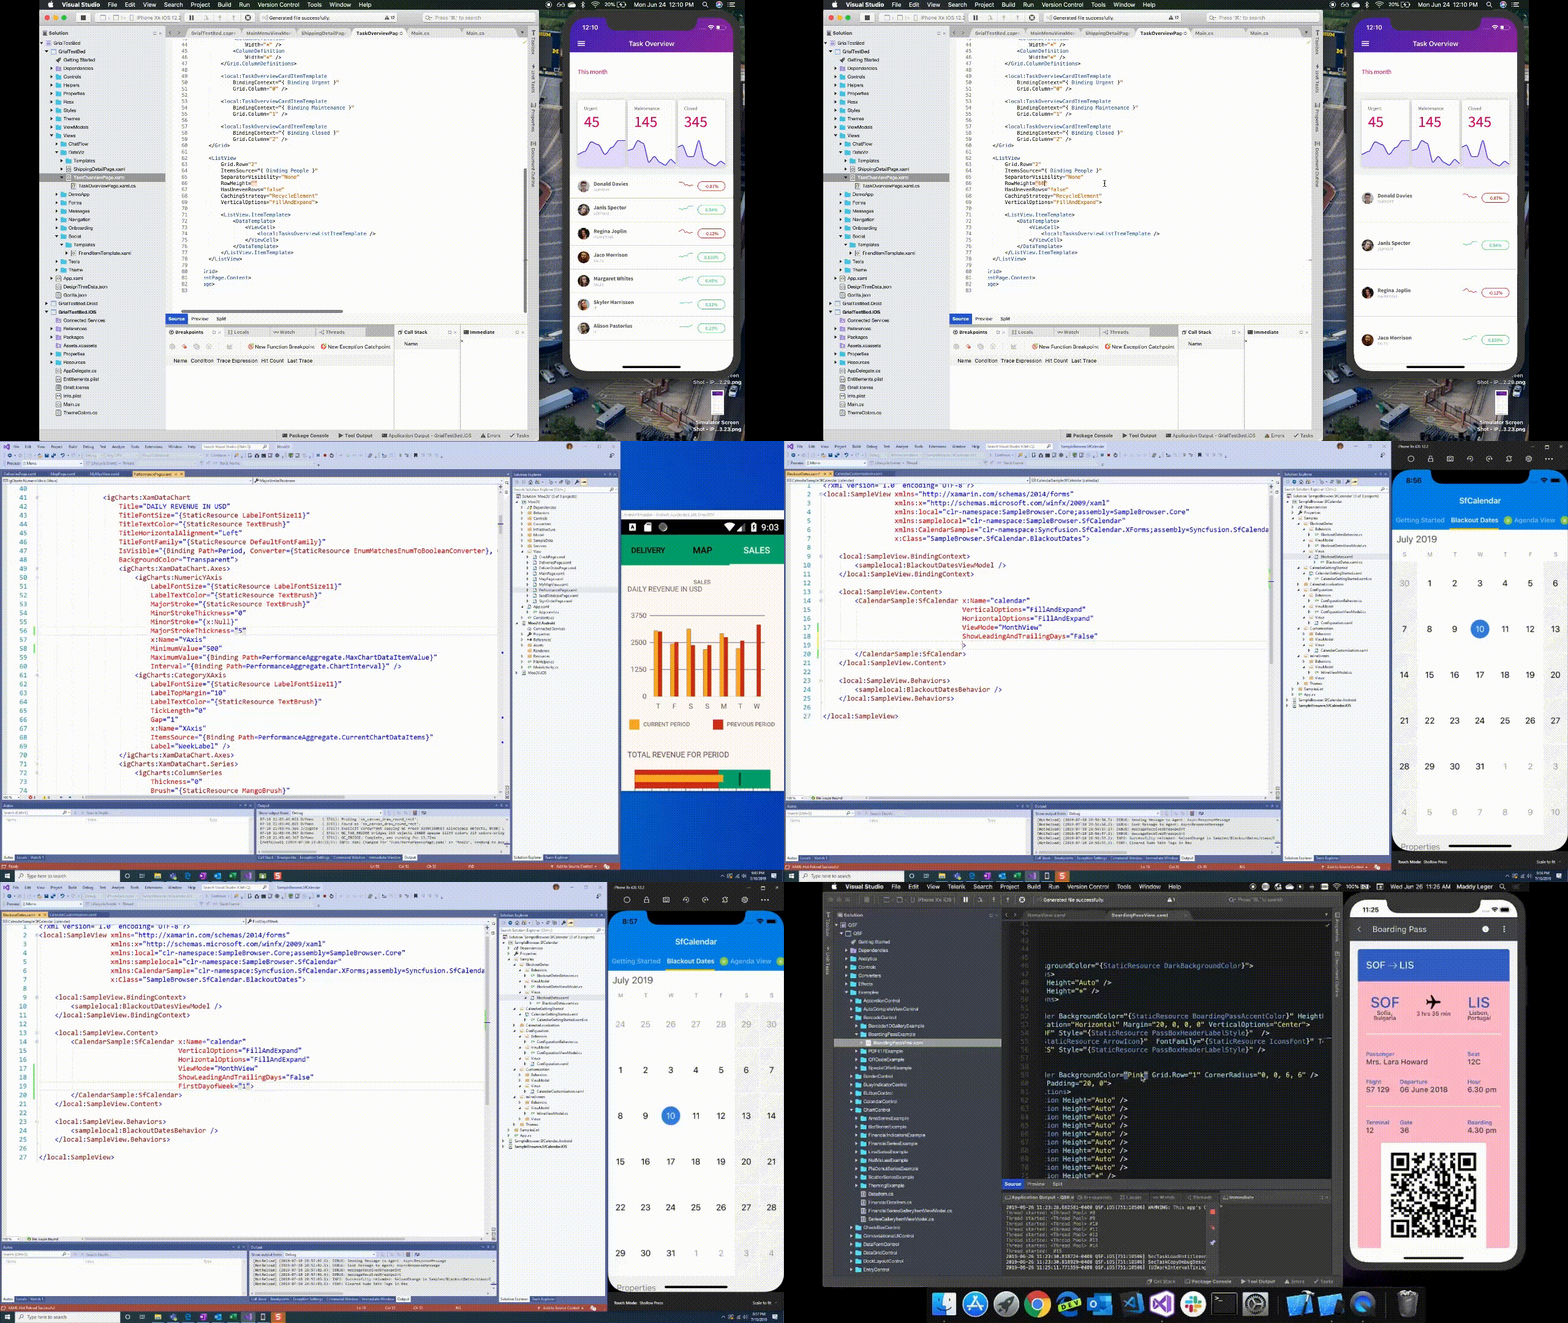
- The XAML Previewer for Xamarin.Forms now renders Material design for both iOS and Android when using Xamarin.Forms Visual.
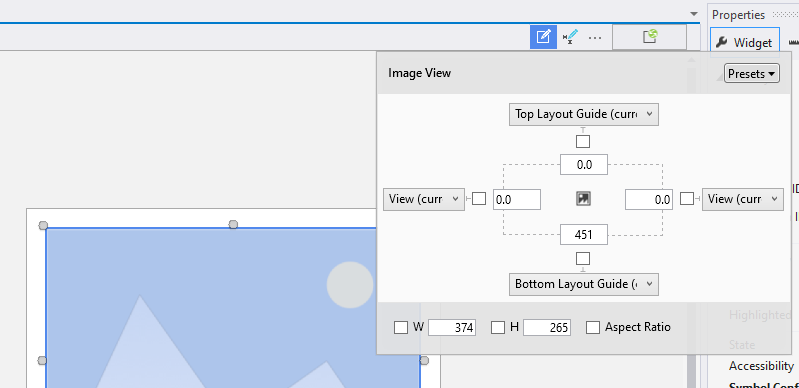
- The Xamarin Designer for iOS has a new way to work with constraints. When you select a constrainable view, an ellipsis will now appear in the toolbar next to the Constraints Pinning Mode selector. Click the ellipsis to display a popover for editing constraints on the selected view.
- You can now archive and publish iOS apps from Visual Studio on Windows. Create an archive while paired to a Mac machine by setting the configuration to Release|iPhone, right-clicking your iOS project in the Solution Explorer, and selecting the Archive... menu option. From the archive manager you can save an .ipa to disk for ad-hoc distribution or upload to App Store Connect to publish your app to the App Store.
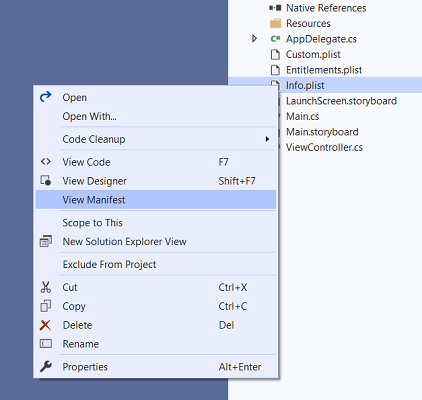
- When you right-click a .plist file in the Solution Explorer, there are new options to quickly open it using the generic plist designer or the XML editor.
Known Issues
See all issues and available workarounds in Visual Studio 2019 version 16.3 by following the below link.
Feedback and suggestions
We would love to hear from you! For issues, let us know through the Report a Problem option in the upper right-hand
corner of either the installer or the Visual Studio IDE itself. The ![]() icon is located in the upper right-hand corner.
You can make a product suggestion or track your issues in the Visual Studio Developer Community, where you can ask questions, find answers, and propose new features.
You can also get free installation help through our Live Chat support.
icon is located in the upper right-hand corner.
You can make a product suggestion or track your issues in the Visual Studio Developer Community, where you can ask questions, find answers, and propose new features.
You can also get free installation help through our Live Chat support.
Blogs
Take advantage of the insights and recommendations available in the Developer Tools Blogs site to keep you up-to-date on all new releases and include deep dive posts on a broad range of features.
Visual Studio 2019 Release Notes History
For more information relating to past versions of Visual Studio 2019, see the Visual Studio 2019 Release Notes History page.