你当前正在访问 Microsoft Azure Global Edition 技术文档网站。 如果需要访问由世纪互联运营的 Microsoft Azure 中国技术文档网站,请访问 https://docs.azure.cn。
在 Web 视图中从 Azure Maps Android SDK 迁移到 Web SDK 涉及使用 Azure Maps Web SDK 将现有地图视图从本机实现过渡到基于 Web 的地图。 本指南介绍如何将代码和功能从 Android SDK 迁移到 Web SDK。
注意
Azure Maps Android SDK 停用
适用于 Android 的 Azure Maps 本机 SDK 现已弃用,将于 2025 年 3 月 31 日停用。 为了避免服务中断,请在 2025 年 3 月 31 日之前迁移到 Azure Maps Web SDK。
先决条件
若要在网页中使用 Map Control,必须具备以下先决条件之一:
- Azure Maps 帐户。
- 订阅密钥或 Microsoft Entra 凭据。 有关详细信息,请参阅身份验证选项。
创建 Web 视图
如果 Android 应用程序没有 Web 视图,请添加一个。 为此,请将 WebView 元素添加到布局 XML 或以编程方式添加到 Java 代码中。 请确保将其配置为占用布局中的所需区域。
<?xml version="1.0" encoding="utf-8"?>
<androidx.coordinatorlayout.widget.CoordinatorLayout xmlns:android="http://schemas.android.com/apk/res/android"
    xmlns:app="http://schemas.android.com/apk/res-auto"
    xmlns:tools="http://schemas.android.com/tools"
    android:layout_width="match_parent"
    android:layout_height="match_parent"
    tools:context=".MainActivity">

    <WebView
        android:id="@+id/webView"
        android:layout_width="match_parent"
        android:layout_height="match_parent"/>

</androidx.coordinatorlayout.widget.CoordinatorLayout>
通过在 AndroidManifest.xml 中添加权限来启用 Internet 访问。
<uses-permission android:name="android.permission.INTERNET" />
在活动或片段中,通过更新设置初始化 WebView 并启用 JavaScript。 加载包含 Web SDK 代码的 HTML 文件。 可以从资产文件夹或远程 URL 加载此文件。
import android.os.Bundle;
import androidx.appcompat.app.AppCompatActivity;
import android.webkit.WebSettings;
import android.webkit.WebView;

public class MainActivity extends AppCompatActivity {

    private WebView webView;

    @Override
    protected void onCreate(Bundle savedInstanceState) {
        super.onCreate(savedInstanceState);

        setContentView(R.layout.activity_main);
        webView = findViewById(R.id.webView);

        // Enable JavaScript
        WebSettings webSettings = webView.getSettings();
        webSettings.setJavaScriptEnabled(true);

        // Load local HTML file from /src/main/assets/map.html
        webView.loadUrl("file:///android_asset/map.html");
    }
}
使用 Azure Maps Web SDK 设置地图
在 HTML 文件中,使用订阅密钥初始化地图。 将 <YOUR_SUBSCRIPTION_KEY> 替换为实际密钥。
<!DOCTYPE html>
<html>
   <head>
       <title>Azure Maps</title>
       <meta charset="utf-8" />
       <meta name="viewport" content="width=device-width, initial-scale=1" />
       <!-- Add references to the Azure Maps Map control JavaScript and CSS files. -->
       <link rel="stylesheet" href="https://atlas.microsoft.com/sdk/javascript/mapcontrol/3/atlas.min.css" type="text/css"/>
       <script src="https://atlas.microsoft.com/sdk/javascript/mapcontrol/3/atlas.min.js"></script>
       <style>
           html,
           body,
           #map {
               margin: 0;
               height: 100%;
               width: 100%;
           }
           body {
               display: flex;
               flex-direction: column;
           }
           main {
               flex: 1 1 auto;
           }
       </style>
       <script type="text/javascript">
           // Create an instance of the map control.
           function InitMap() {
               var map = new atlas.Map("map", {
                   center: [-122.33, 47.6],
                   zoom: 12,
                   authOptions: {
                       authType: "subscriptionKey",
                       subscriptionKey: "<YOUR_SUBSCRIPTION_KEY>"
                   }
               });

               // Wait until the map resources are ready.
               map.events.add("ready", function () {
                   // Resize the map to fill the container.
                   map.resize();
               });
           }
       </script>
   </head>
   <body onload="InitMap()">
       <main>
           <div id="map"></div>
       </main>
   </body>
</html>
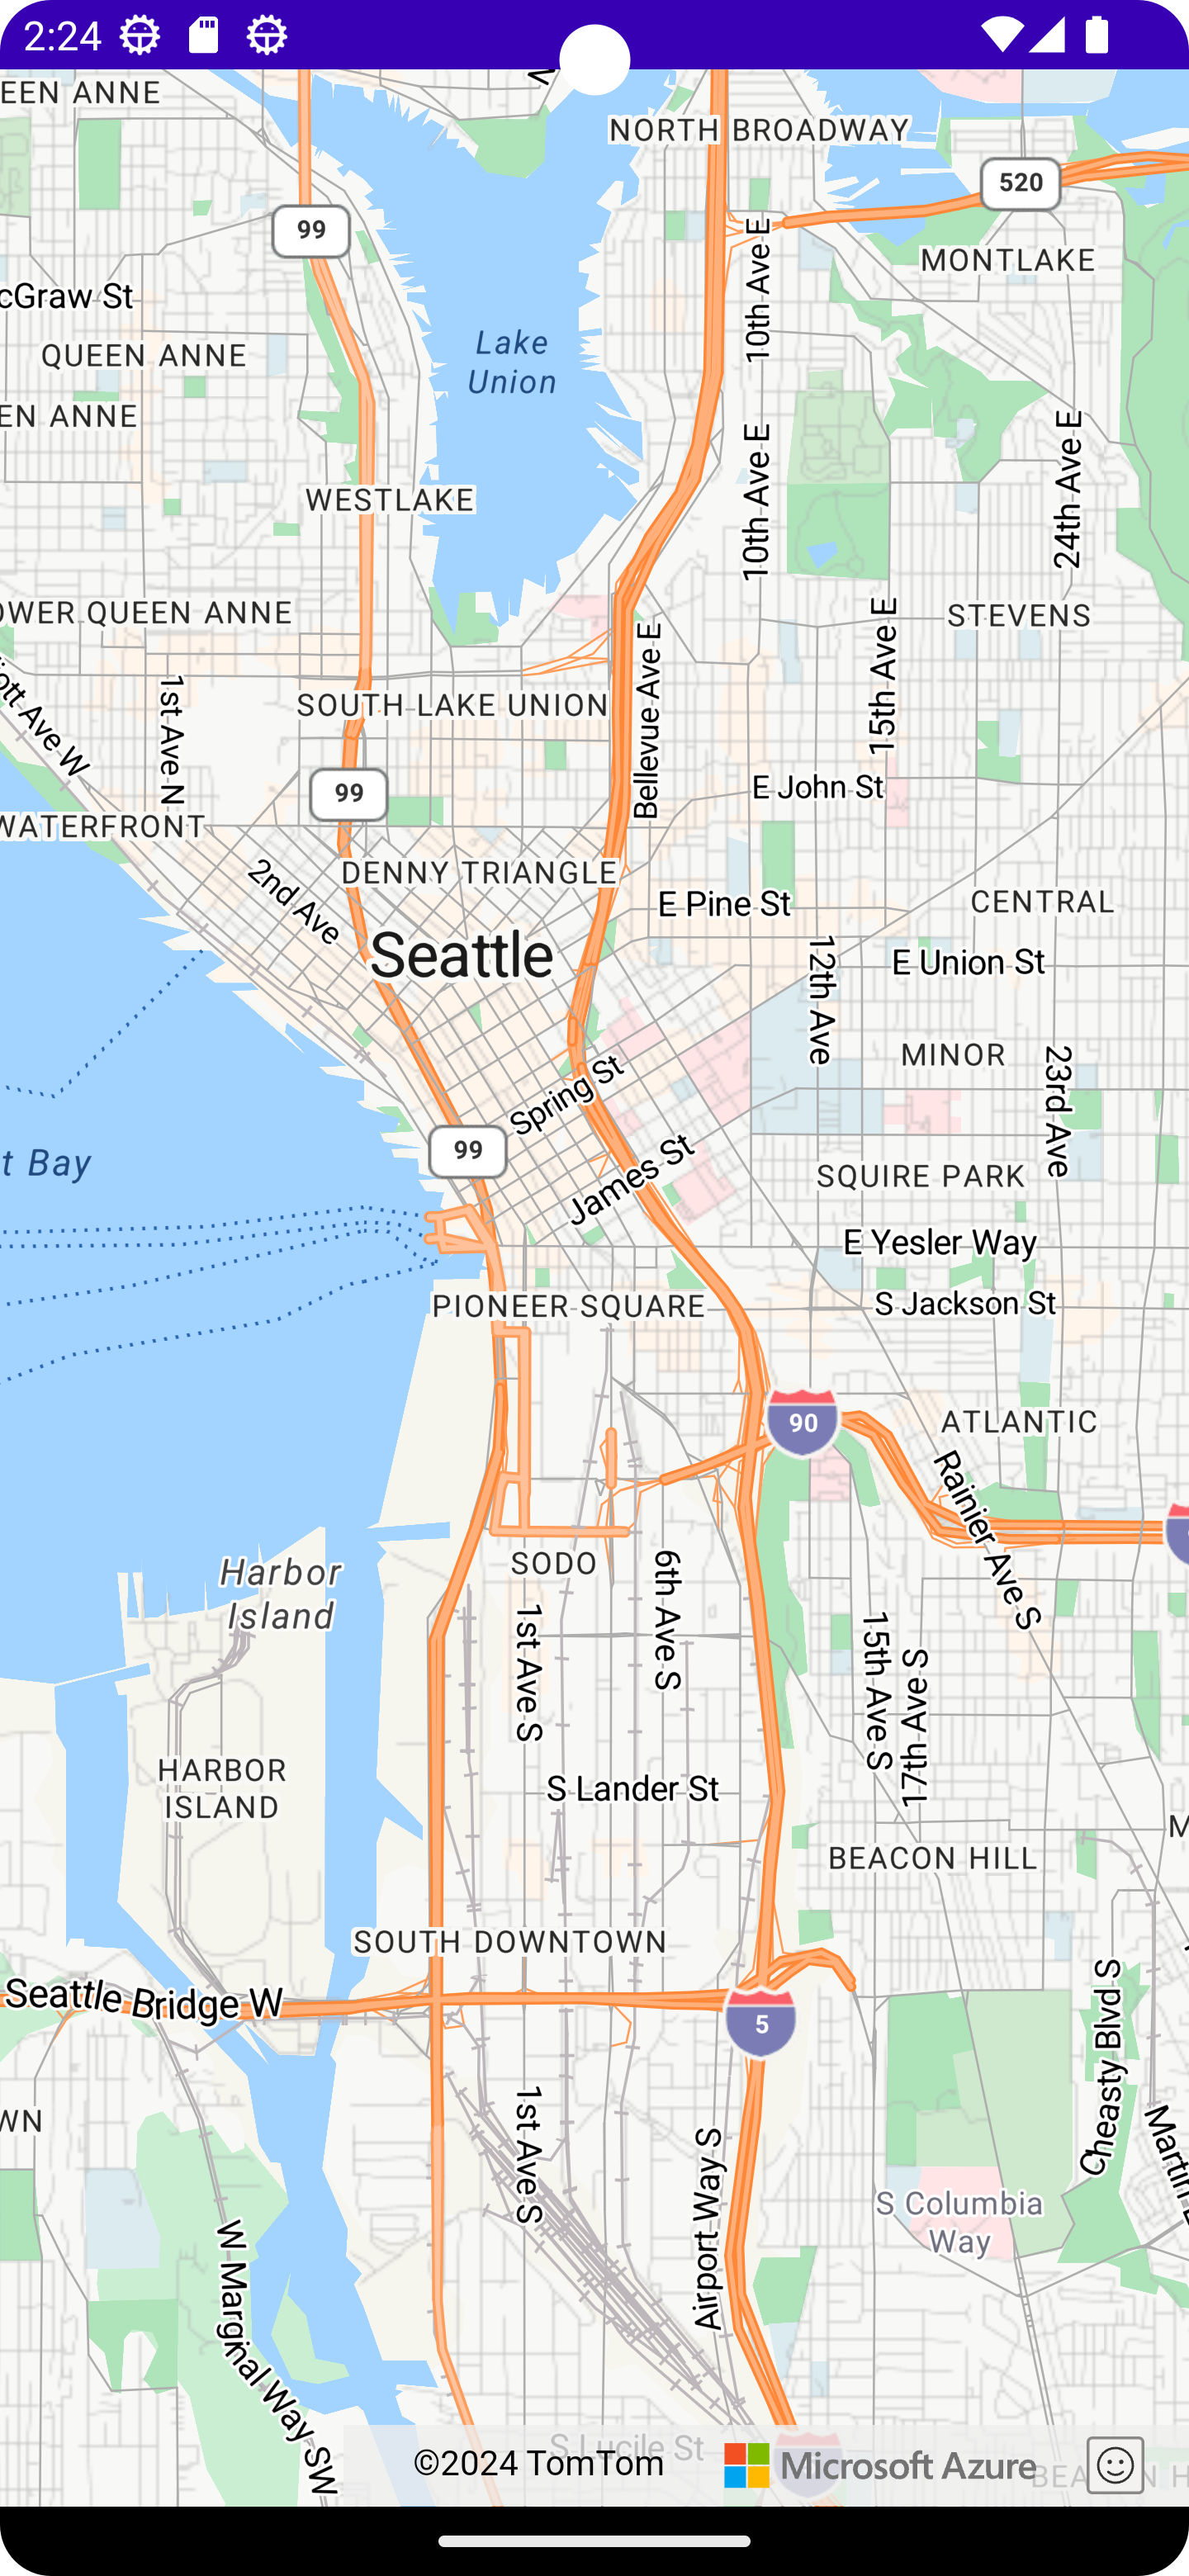
保存并运行应用。 地图将显示在 Web 视图中。 从 Web SDK 添加任何必需的功能。 有关详细信息,请参阅 Azure Maps 文档和 Azure Maps 示例。
本机代码与 Web 视图之间的通信(可选)
若要启用 Android 应用程序和 Web 视图之间的通信,可以使用 Web 视图的 addJavascriptInterface 方法向 Web 视图中运行的 JavaScript 公开 Java 对象。 这样可以从 JavaScript 代码调用 Java 方法。 有关详细信息,请参阅 Android 文档中的 Web 视图。
清理本机地图实现
移除与本机 Azure Maps Android SDK 相关的代码,包括与 com.azure.android:azure-maps-control 相关的依赖项和初始化代码。
测试
仔细测试应用程序,以确保迁移成功。 检查与地图功能、用户交互和性能相关的问题。
后续步骤
了解如何使用 Azure Maps 中的 Map Control 客户端 JavaScript 库将地图添加到 Web 和移动应用程序: