你当前正在访问 Microsoft Azure Global Edition 技术文档网站。 如果需要访问由世纪互联运营的 Microsoft Azure 中国技术文档网站,请访问 https://docs.azure.cn。
在 Azure Stack Edge Pro GPU 设备上启用 Azure Monitor
适用于: Azure Stack Edge Pro - GPUAzure Stack Edge Pro 2Azure Stack Edge Pro RAzure Stack Edge Mini R
在 Azure Stack Edge Pro GPU 设备上监视容器至关重要,特别是当你运行多个计算应用程序时。 借助 Azure Monitor,可从设备上运行的 Kubernetes 群集收集容器日志、内存和处理器指标。
本文介绍了在设备上启用 Azure Monitor 并在 Log Analytics 工作区中收集容器日志所需的步骤。 Azure Stack Edge Pro GPU 设备目前不支持 Azure Monitor 指标存储。
注意
如果设备上的 Kubernetes 群集启用了 Azure Arc,请按照已启用 Azure Arc 的 Kubernetes 群集的 Azure Monitor 容器见解中的步骤设置容器监视。
先决条件
在开始之前,需要:
- 一台 Azure Stack Edge Pro 设备。 请确保遵循教程:激活设备中的步骤激活该设备。
- 已根据教程:在 Azure Stack Edge Pro 设备上配置计算中所述在设备上完成了“配置计算”步骤。 设备应具备关联的 IoT 中心资源、IoT 设备和 IoT Edge 设备。
创建 Log Analytics 工作区
执行以下步骤创建 Log Analytics 工作区。 Log Analytics 工作区是收集和存储日志数据的逻辑存储单元。
在 Azure 门户中,选择“+ 创建资源”并搜索“Log Analytics 工作区”,然后选择“创建”。
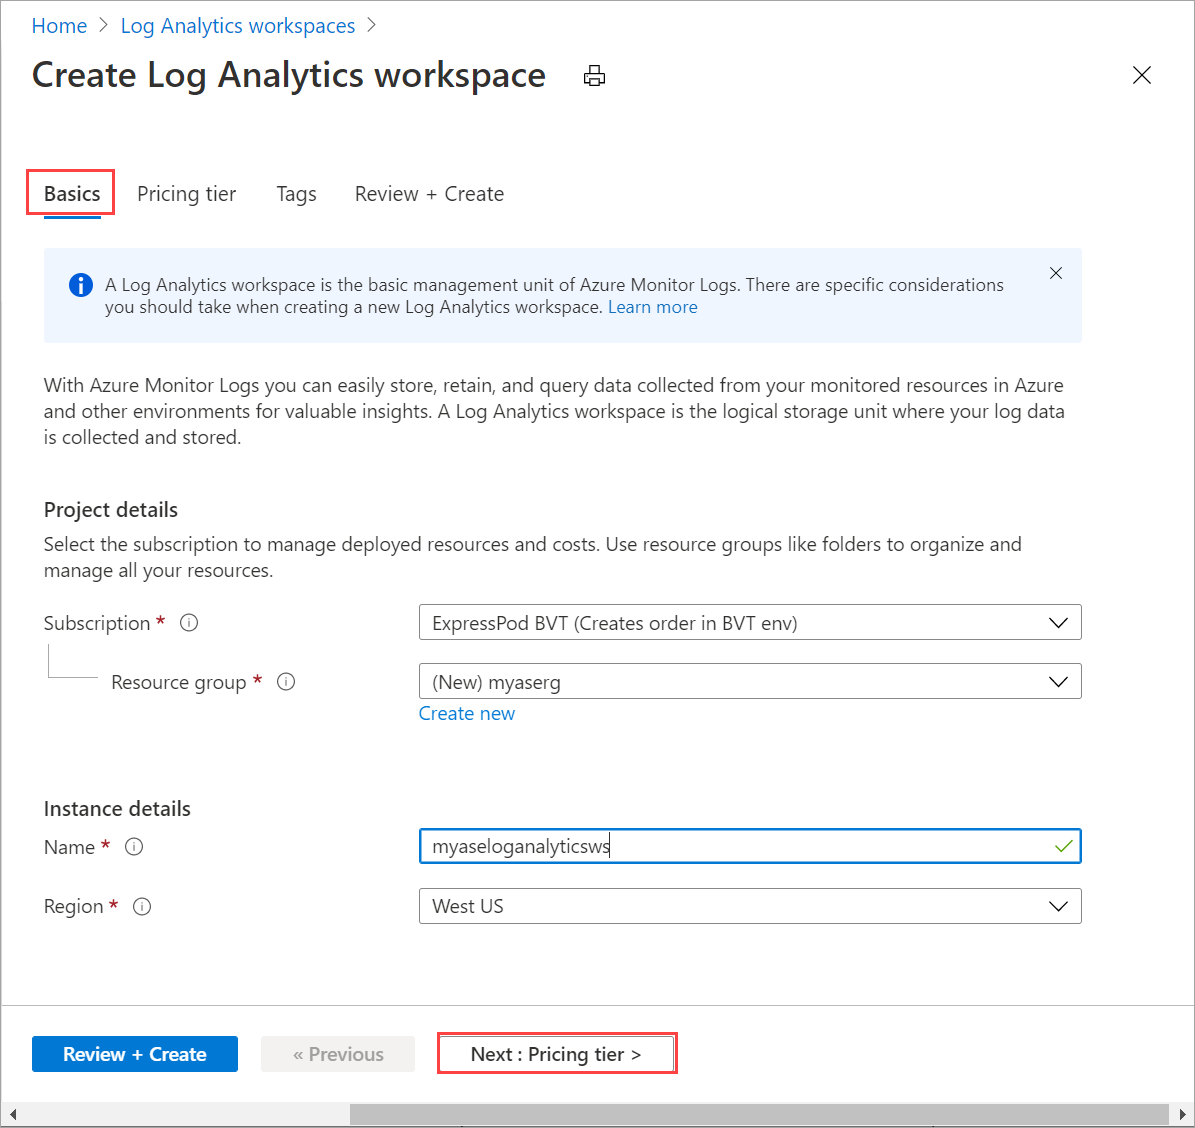
在“创建 Log Analytics 工作区”中,配置以下设置。 接受余数作为默认值。
在“基本信息”选项卡上,为工作区指定订阅、资源组、名称和区域。
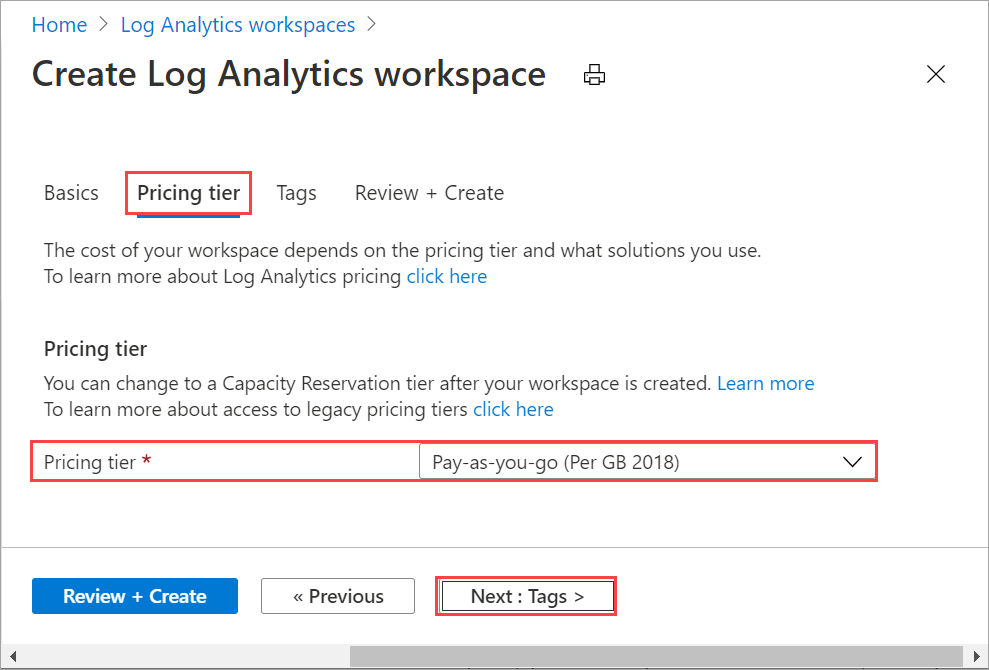
在“定价层”选项卡上,接受默认的“即用即付计划”。
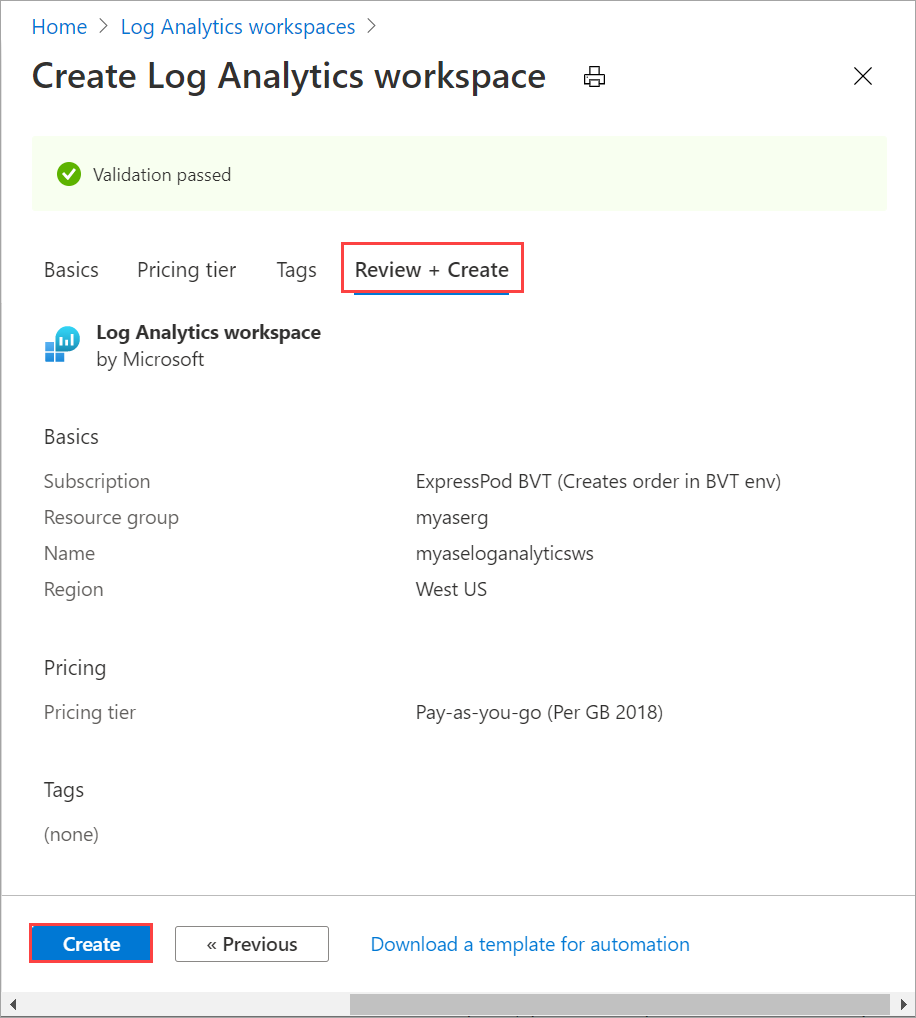
在“查看 + 创建”选项卡中,查看工作区的信息,然后选择“创建”。
有关详细信息,请参阅在 Azure 门户中创建 Log Analytics 工作区中的详细步骤。
启用容器见解
执行以下步骤以在工作区中启用容器见解。
按照添加 Azure Monitor 容器解决方案中的详细步骤进行操作。 请使用以下模版文件
containerSolution.json:{ "$schema": "https://schema.management.azure.com/schemas/2015-01-01/deploymentTemplate.json#", "contentVersion": "1.0.0.0", "parameters": { "workspaceResourceId": { "type": "string", "metadata": { "description": "Azure Monitor Log Analytics Workspace Resource ID" } }, "workspaceRegion": { "type": "string", "metadata": { "description": "Azure Monitor Log Analytics Workspace region" } } }, "resources": [ { "type": "Microsoft.Resources/deployments", "name": "[Concat('ContainerInsights', '-', uniqueString(parameters('workspaceResourceId')))]", "apiVersion": "2017-05-10", "subscriptionId": "[split(parameters('workspaceResourceId'),'/')[2]]", "resourceGroup": "[split(parameters('workspaceResourceId'),'/')[4]]", "properties": { "mode": "Incremental", "template": { "$schema": "https://schema.management.azure.com/schemas/2015-01-01/deploymentTemplate.json#", "contentVersion": "1.0.0.0", "parameters": {}, "variables": {}, "resources": [ { "apiVersion": "2015-11-01-preview", "type": "Microsoft.OperationsManagement/solutions", "location": "[parameters('workspaceRegion')]", "name": "[Concat('ContainerInsights', '(', split(parameters('workspaceResourceId'),'/')[8], ')')]", "properties": { "workspaceResourceId": "[parameters('workspaceResourceId')]" }, "plan": { "name": "[Concat('ContainerInsights', '(', split(parameters('workspaceResourceId'),'/')[8], ')')]", "product": "[Concat('OMSGallery/', 'ContainerInsights')]", "promotionCode": "", "publisher": "Microsoft" } } ] }, "parameters": {} } } ] }获取资源 ID 和位置。 转到
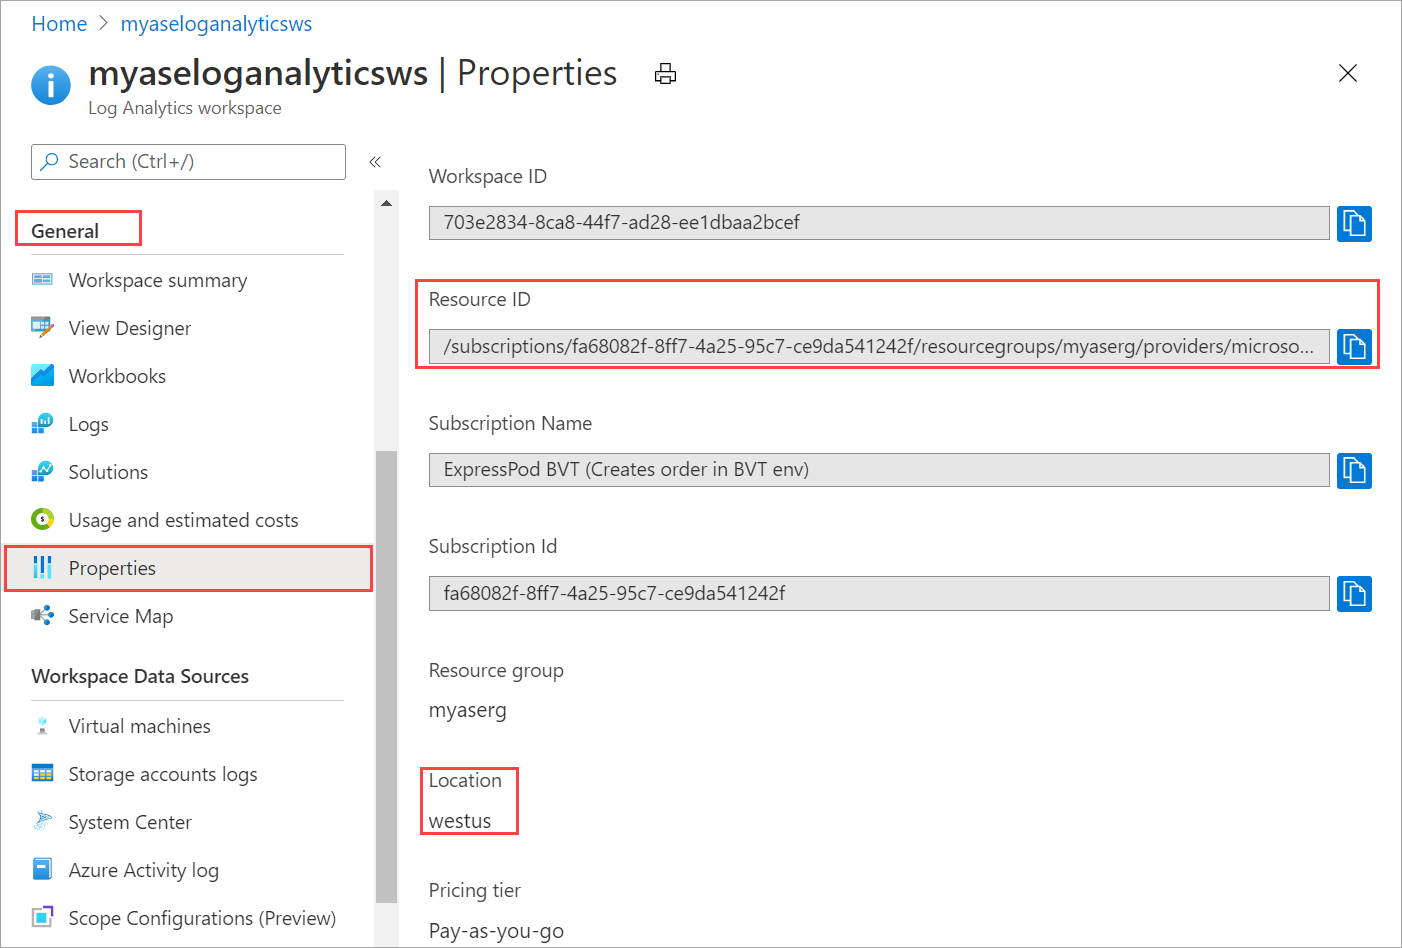
Your Log Analytics workspace > General > Properties。 复制以下信息:- 资源 ID,它是 Azure Log Analytics 工作区完全限定的 Azure 资源 ID。
- 位置,即 Azure 区域。
请使用以下参数文件
containerSolutionParams.json。 将workspaceResourceId替换为资源 ID,并将workspaceRegion替换为在先前步骤中复制的位置。{ "$schema": "https://schema.management.azure.com/schemas/2015-01-01/deploymentParameters.json#", "contentVersion": "1.0.0.0", "parameters": { "workspaceResourceId": { "value": "/subscriptions/fa68082f-8ff7-4a25-95c7-ce9da541242f/resourcegroups/myaserg/providers/microsoft.operationalinsights/workspaces/myaseloganalyticsws" }, "workspaceRegion": { "value": "westus" } } }下面是启用了容器见解的 Log Analytics 工作区的示例输出:
Requesting a Cloud Shell.Succeeded.
Connecting terminal...
MOTD: Switch to Bash from PowerShell: bash
VERBOSE: Authenticating to Azure ...
VERBOSE: Building your Azure drive ...

PS /home/myaccount> az account set -s fa68082f-8ff7-4a25-95c7-ce9da541242f
PS /home/myaccount> ls
clouddrive  containerSolution.json
PS /home/myaccount> ls
clouddrive  containerSolution.json  containerSolutionParams.json
PS /home/myaccount> az deployment group create --resource-group myaserg --name Testdeployment1 --template-file containerSolution.json --parameters containerSolutionParams.json
{- Finished ..
    "id": "/subscriptions/fa68082f-8ff7-4a25-95c7-ce9da541242f/resourceGroups/myaserg/providers/Microsoft.Resources/deployments/Testdeployment1",
    "location": null,
    "name": "Testdeployment1",
    "properties": {
    "correlationId": "3a9045fe-2de0-428c-b17b-057508a8c575",
    "debugSetting": null,
    "dependencies": [],
    "duration": "PT11.1588316S",
    "error": null,
    "mode": "Incremental",
    "onErrorDeployment": null,
    "outputResources": [
        {
        "id": "/subscriptions/fa68082f-8ff7-4a25-95c7-ce9da541242f/resourceGroups/myaserg/providers/Microsoft.OperationsManagement/solutions/ContainerInsights(myaseloganalyticsws)",
        "resourceGroup": "myaserg"
        }
    ],
    "outputs": null,
    "parameters": {
        "workspaceRegion": {
        "type": "String",
        "value": "westus"
        },
        "workspaceResourceId": {
        "type": "String",
        "value": "/subscriptions/fa68082f-8ff7-4a25-95c7-ce9da541242f/resourcegroups/myaserg/providers/microsoft.operationalinsights/workspaces/myaseloganalyticsws"
        }
    },
    "parametersLink": null,
    "providers": [
        {
        "id": null,
        "namespace": "Microsoft.Resources",
        "registrationPolicy": null,
        "registrationState": null,
        "resourceTypes": [
            {
            "aliases": null,
            "apiProfiles": null,
            "apiVersions": null,
            "capabilities": null,
            "defaultApiVersion": null,
            "locations": [
                null
            ],
            "properties": null,
            "resourceType": "deployments"
            }
        ]
        }
    ],
    "provisioningState": "Succeeded",
    "templateHash": "10500027184662969395",
    "templateLink": null,
    "timestamp": "2020-11-06T22:09:56.908983+00:00",
    "validatedResources": null
    },
    "resourceGroup": "myaserg",
    "tags": null,
    "type": "Microsoft.Resources/deployments"
}
PS /home/myaccount>
在设备上配置 Azure Monitor
转到新创建的 Log Analytics 资源,并复制“工作区 ID”和“主密钥”(工作区密钥)。
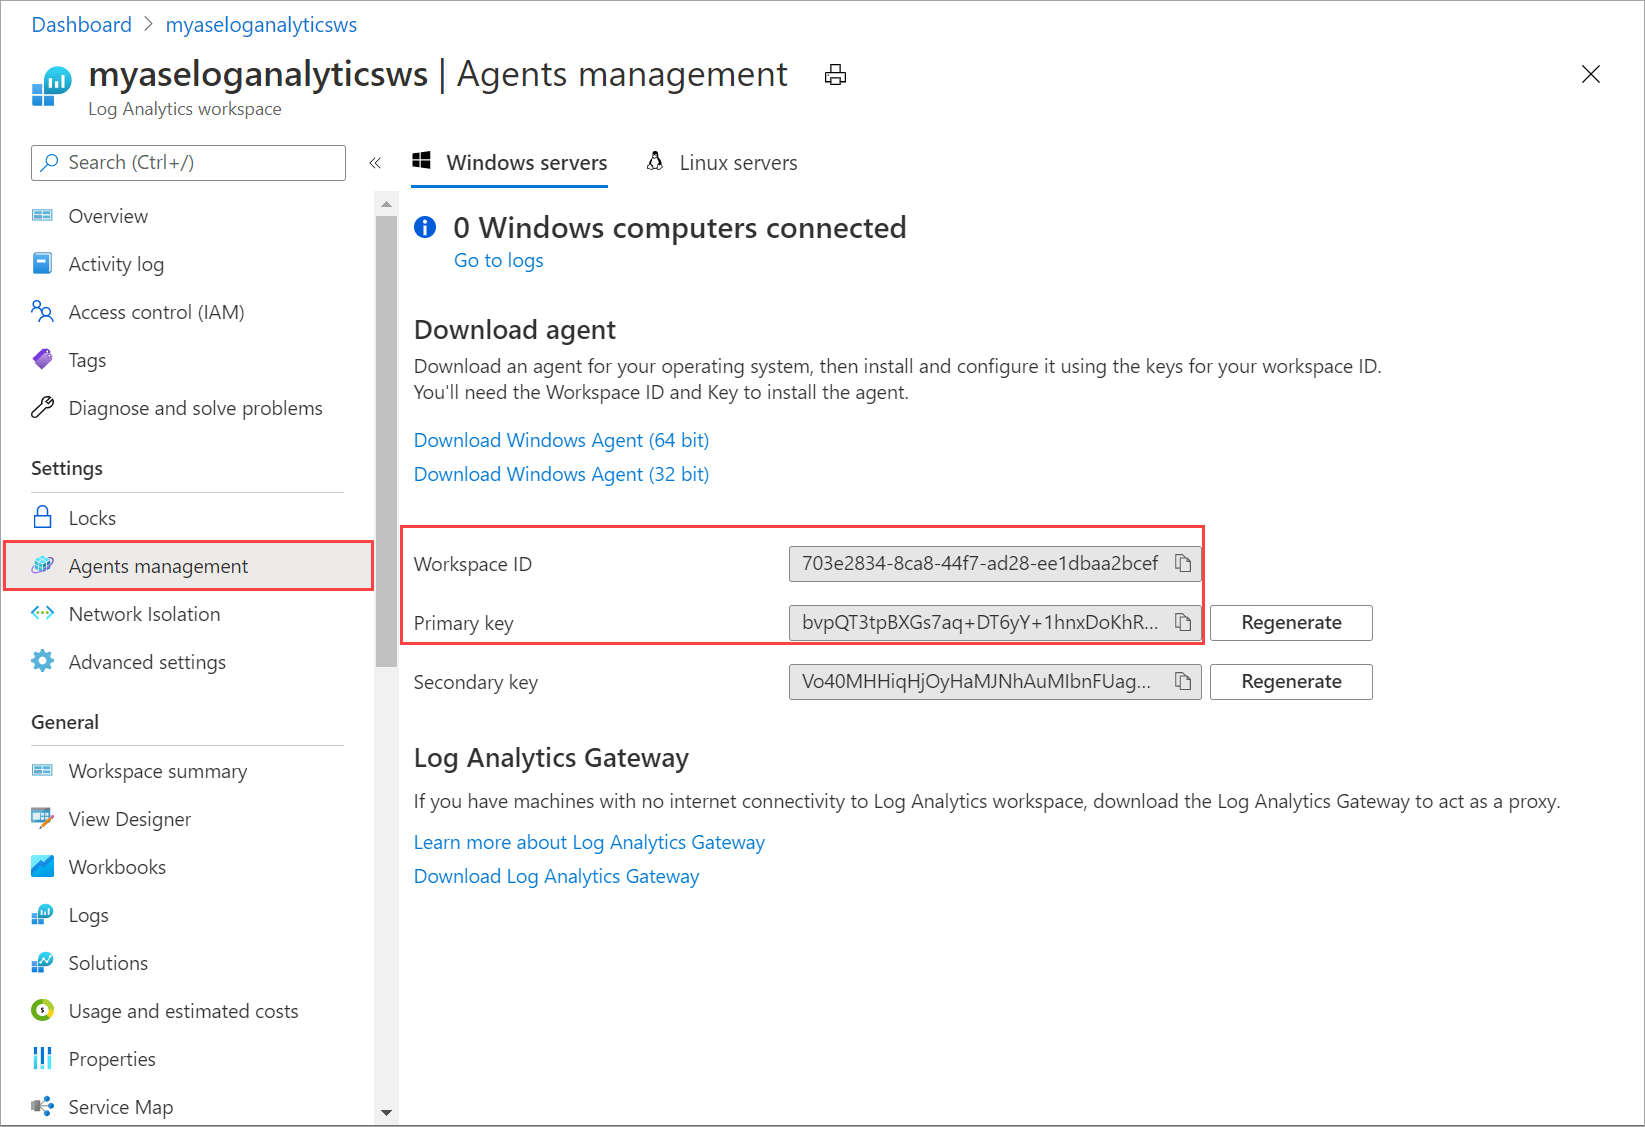
保存此信息,后面的步骤将用到。
将 Log Analytics 工作区 ID 和工作区密钥与以下 cmdlet 一起使用:
Set-HcsKubernetesAzureMonitorConfiguration -WorkspaceId <> -WorkspaceKey <>注意
默认情况下,此 cmdlet 配置 Azure 公有云。 要配置政府云或非公有云,请使用参数
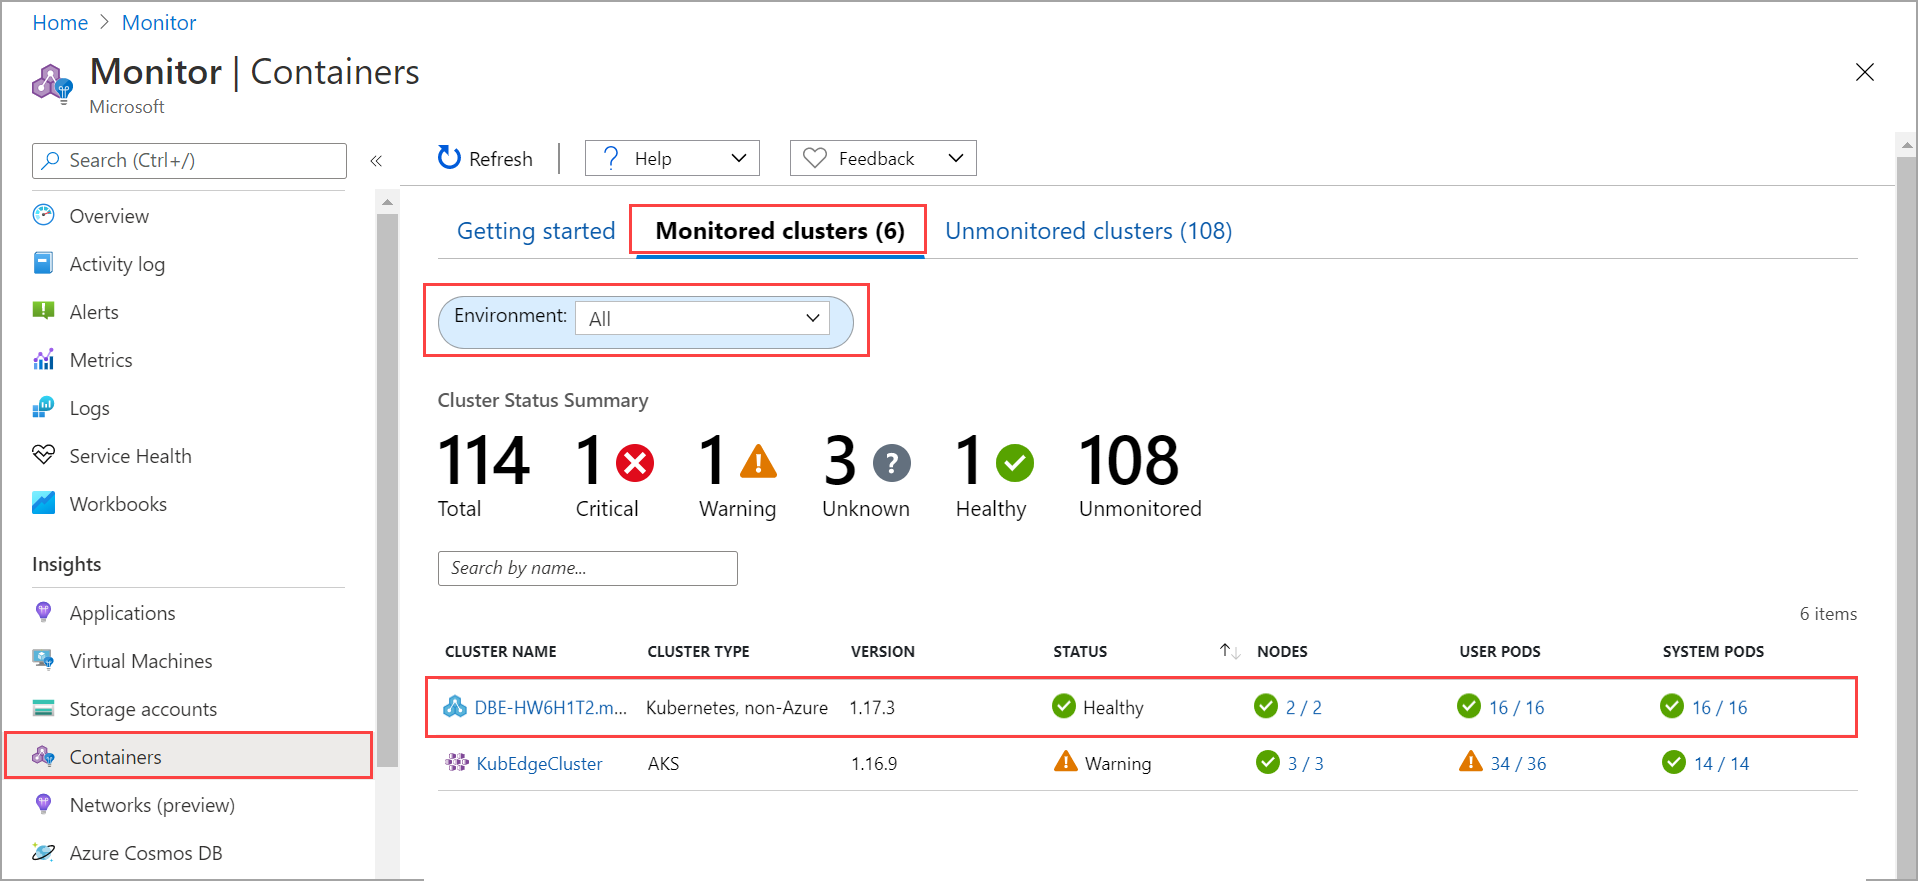
AzureCloudDomainName。启用 Azure Monitor 后,应在 Log Analytics 工作区中看到日志。 若要查看设备上部署的 Kubernetes 群集的状态,请转到“Azure Monitor”>“见解”>“容器”。 对于环境选项,请选择“全部”。