你当前正在访问 Microsoft Azure Global Edition 技术文档网站。 如果需要访问由世纪互联运营的 Microsoft Azure 中国技术文档网站,请访问 https://docs.azure.cn。
本指南逐步讲解在 Azure Kubernetes 服务(AKS) 群集上安装 Prometheus(开源监视和警报工具包)的步骤。 然后,使用 Azure 托管 Grafana 的托管专用终结点连接到此 Prometheus 服务器,并在 Grafana 仪表板中显示 Prometheus 数据。
本教程介绍如何执行下列操作:
- 创建 Azure Kubernetes 服务群集
- 安装 Prometheus
- 将专用链接服务添加到 Prometheus 服务器
- 使用托管专用终结点进行连接
- 在 Grafana 仪表板中显示 Prometheus 数据
先决条件
在开始之前,请确保具有以下各项:
创建 Azure Kubernetes 服务群集
运行
az login命令以登录到 Azure CLI。az login如果有多个 Azure 订阅,请使用命令
az account set -s <your-azure-subscription-id>选择 Azure 订阅。安装或更新 kubectl。
az aks install-cli创建两个 bash/zsh 变量,我们将在后续命令中使用。 如果使用的是另一个 shell,请更改以下语法。
RESOURCE_GROUP=myResourceGroup
AKS_NAME=myaks
创建资源组。 在此示例中,我们在美国中西部 Azure 区域创建资源组。
az group create --name $RESOURCE_GROUP --location westcentralus使用az aks create命令新建 AKS 群集。 在这里,我们使用 B 系列可突发虚拟机类型创建三节点群集,该类型经济高效,适用于此类小型测试/开发工作负载。
az aks create --resource-group $RESOURCE_GROUP \
  --name $AKS_NAME \
  --node-count 3 \
  --node-vm-size Standard_B2s \
  --generate-ssh-keys
此操作可能需要几分钟才能完成。
对创建的群集进行身份验证。
az aks get-credentials \
  --resource-group $RESOURCE_GROUP \
  --name $AKS_NAME
现在可以使用 kubectl 访问 Kubernetes 群集。
使用 kubectl 查看创建的节点。
kubectl get nodes
安装 Prometheus
安装 Prometheus 的一种常用方法是通过prometheus-operator,它提供Prometheus及相关监视组件的 Kubernetes 本机部署和管理。 在本教程中,我们使用kube-prometheus-stack Helm 图表部署 prometheus-operator。
添加 helm-chart 存储库,然后更新存储库列表。
helm repo add prometheus-community https://prometheus-community.github.io/helm-charts
helm repo update
将 Helm 图表安装到名为监视的命名空间中。 此命名空间自动创建。
helm install prometheus \
  prometheus-community/kube-prometheus-stack \
  --namespace monitoring \
  --create-namespace
helm 命令会提示检查已部署 Pod 的状态。 运行以下命令。
kubectl --namespace monitoring get pods在继续之前,请确保 Pod 全部“正在运行”。 如果在不太可能的情况下,它们未达到正在运行状态,可能需要对其进行故障排除。
将专用链接服务添加到 Prometheus 服务器
Azure 专用链接服务可以通过跨不同 Azure 虚拟网络的专用链接来使用 Kubernetes 服务。 AKS 与 Azure 专用链接服务具有本机集成,可帮助批注 Kubernetes 服务对象,以在 Azure 中创建相应的专用链接服务。
请参阅以下 pls-prometheus-svc.yaml 文件的内容:
apiVersion: v1
kind: Service
metadata:
  name: prom-pls-svc
  annotations:
    service.beta.kubernetes.io/azure-load-balancer-internal: "true" # Use an internal LB with PLS
    service.beta.kubernetes.io/azure-pls-create: "true"
    service.beta.kubernetes.io/azure-pls-name: promManagedPls
    service.beta.kubernetes.io/azure-pls-proxy-protocol: "false"
    service.beta.kubernetes.io/azure-pls-visibility: "*"
spec:
  type: LoadBalancer
  selector:
    # app: myApp
    app.kubernetes.io/name: prometheus
    prometheus: prometheus-kube-prometheus-prometheus # note that this is related to the release name
  ports:
    - name: http-web
      protocol: TCP
      port: 9090
      targetPort: 9090
运行以下命令,将专用链接服务添加到 Prometheus 服务器。
kubectl --namespace monitoring apply -f pls-prometheus-svc.yaml在 AKS 托管资源组中创建名为
promManagedPls的专用链接服务。 此过程需要花费几分钟时间。
使用托管专用终结点进行连接
如果尚无 Azure 托管 Grafana 工作区,请遵循Azure 托管 Grafana 快速入门创建一个工作区。
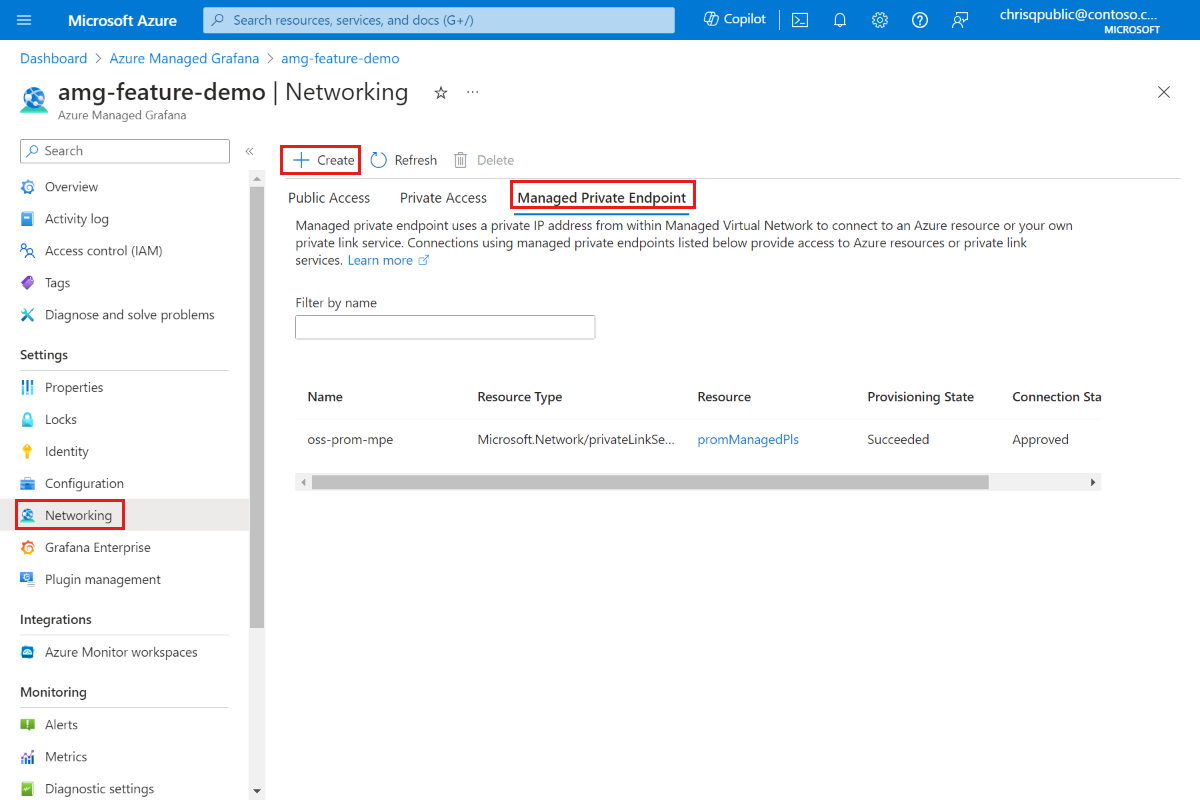
打开 Azure 托管 Grafana 工作区,转到“网络”>“托管专用终结点”>“添加”。
输入托管专用终结点的名称并选择 Azure 订阅。
对于资源类型,请选择“Microsoft.Network/privateLinkServices(专用链接服务)”,对于目标资源,请选择在上述步骤中创建的
promManagedPls专用链接服务。 每个托管专用终结点都会获取专用 IP 地址。 还可以为此托管专用终结点提供域名。 Azure 托管 Grafana 服务可确保此域解析为 Azure 托管 Grafana 环境中的托管专用终结点的专用 IP。 例如,将域设置为*.prom.my-own-domain.com。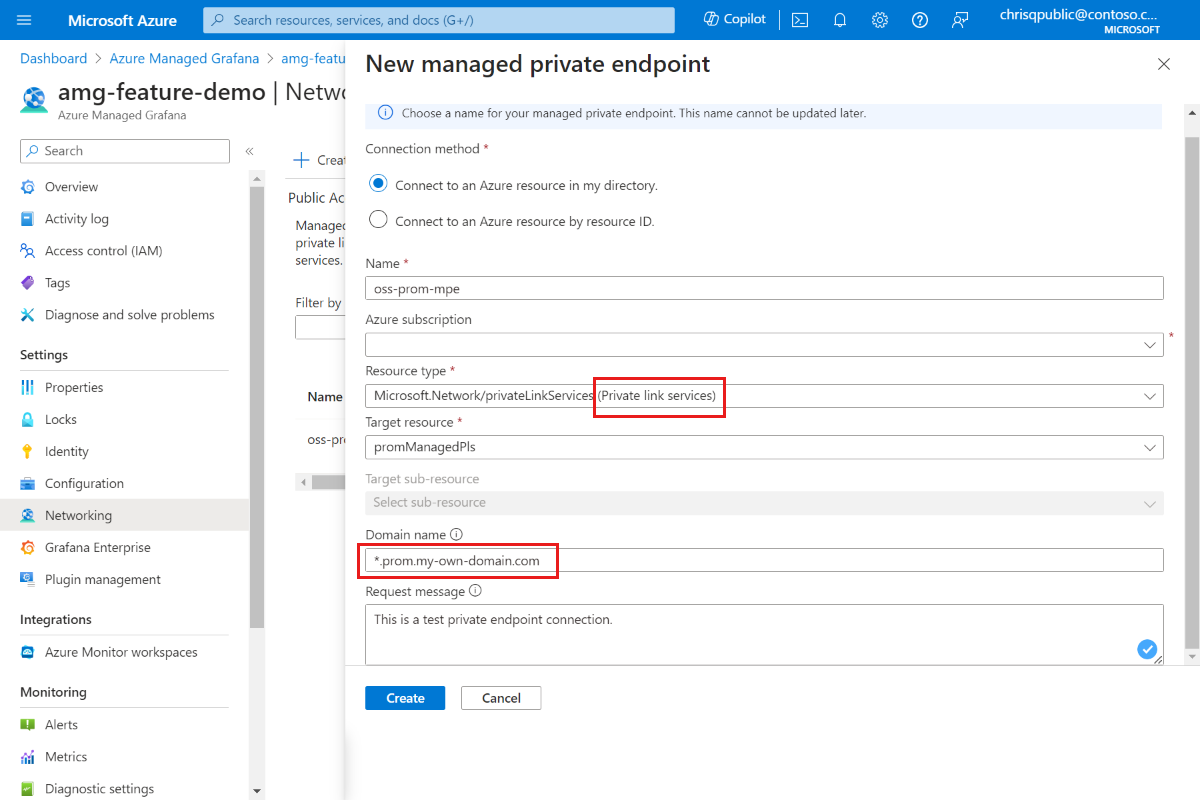
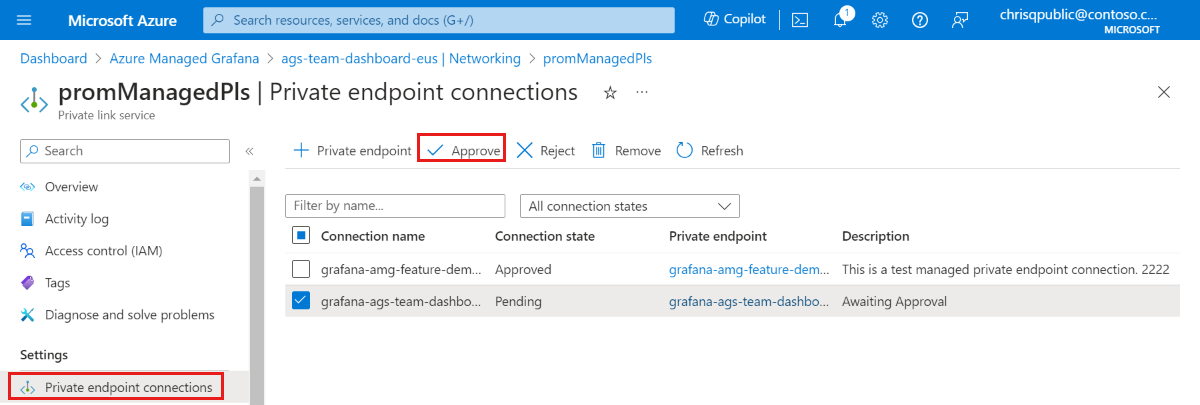
转到 promManagedPls 资源以批准专用终结点连接。 在“设置”下,转到“专用终结点连接”,使用复选框选择连接,然后选择“批准”。
批准专用终结点连接后,返回到 Azure 托管 Grafana 资源,然后在“托管专用终结点”选项卡中选择“刷新”按钮以同步
Connection state。 现在,它应显示为已批准。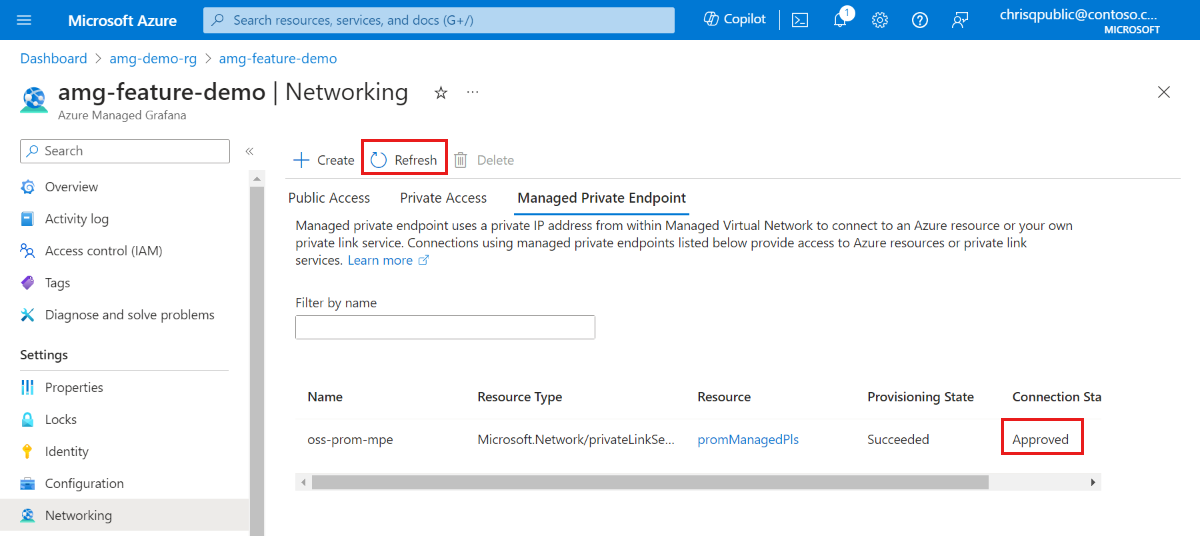
在 Grafana 仪表板中显示 Prometheus 数据
从 Grafana 门户将 Prometheus 数据源添加到 Grafana。 有关详细信息,请转到“添加数据源”。 Prometheus URL 为
http://prom-service.prom.my-own-domain.com:9090。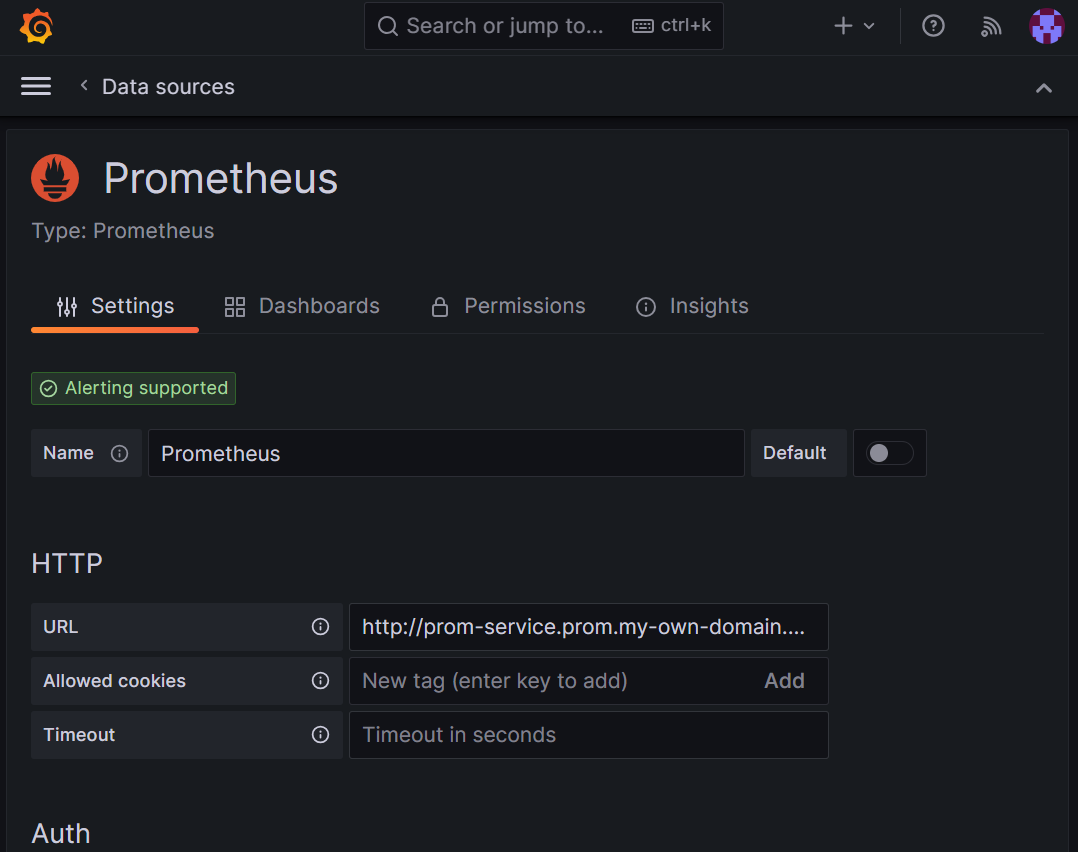
要利用自承载 Prometheus 数据源,请尝试使用 Node Exporter Full仪表板、ID
1860。 有关更多指南,请转到“从 Grafana Labs 导入仪表板”。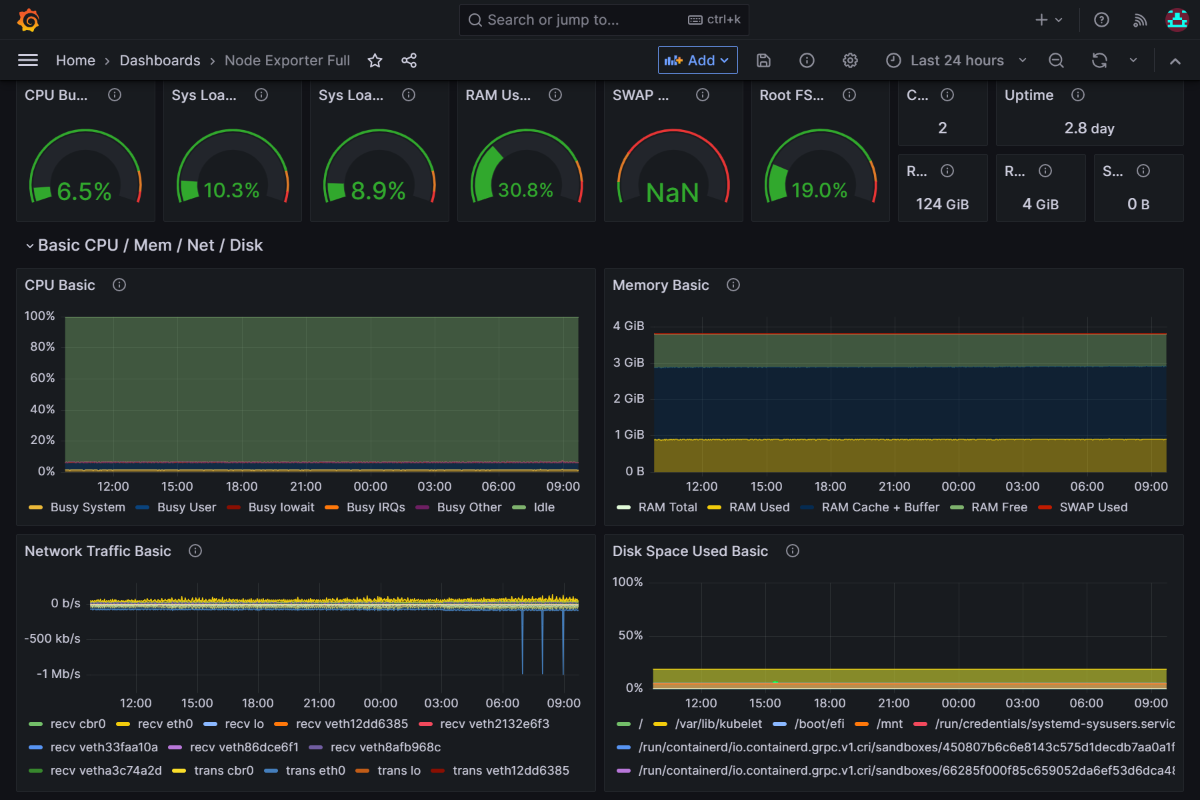
下一步
了解如何使用服务帐户。