R 生态系统提供了多个图形库,其中打包了许多不同的功能。 默认情况下,Microsoft Fabric 中的每个 Apache Spark 池都包含一组精选和常用的开放源代码库。 你还可以使用 Microsoft Fabric 库管理功能来添加或管理其他库或版本。
先决条件
获取 Microsoft Fabric 订阅。 或者注册免费的 Microsoft Fabric 试用版。
登录 Microsoft Fabric。
使用主页左下侧的体验切换器切换到 Fabric。
打开或创建笔记本。 请参阅如何使用 Microsoft Fabric 笔记本,了解如何操作。
通过将语言选项设置为 Spark (R) 来更改主要语言。
将笔记本附加到湖屋。 选择左侧的“添加”以添加现有湖屋或创建湖屋。
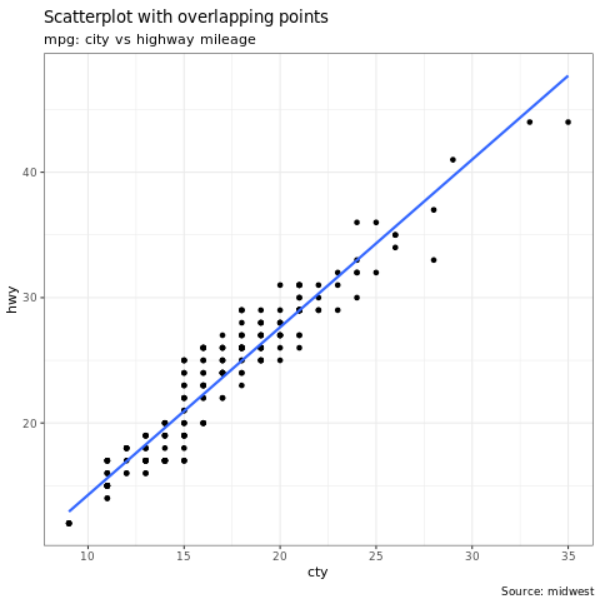
ggplot2
ggplot2 库广泛使用于数据可视化和探索性数据分析。
%%sparkr
library(ggplot2)
data(mpg, package="ggplot2")
theme_set(theme_bw())

g <- ggplot(mpg, aes(cty, hwy))

# Scatterplot
g + geom_point() +
  geom_smooth(method="lm", se=F) +
  labs(subtitle="mpg: city vs highway mileage",
       y="hwy",
       x="cty",
       title="Scatterplot with overlapping points",
       caption="Source: midwest")
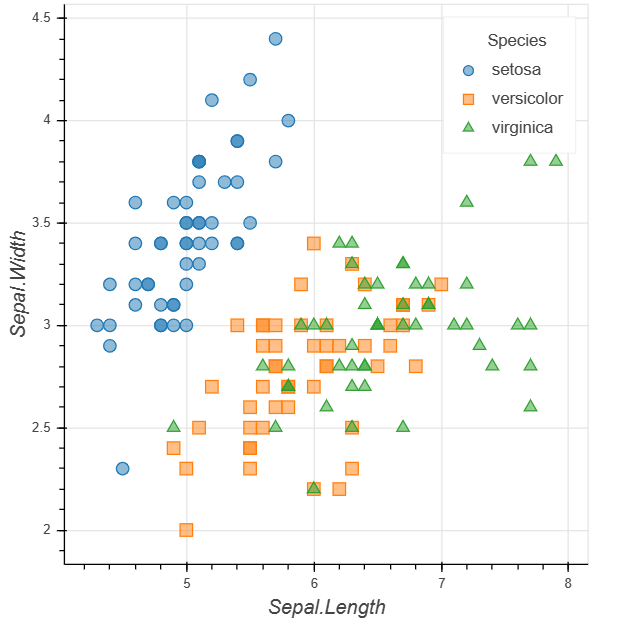
rbokeh
rbokeh 是用于创建交互式图形的本机 R 绘图库。
library(rbokeh)
p <- figure() %>%
  ly_points(Sepal.Length, Sepal.Width, data = iris,
    color = Species, glyph = Species,
    hover = list(Sepal.Length, Sepal.Width))
p
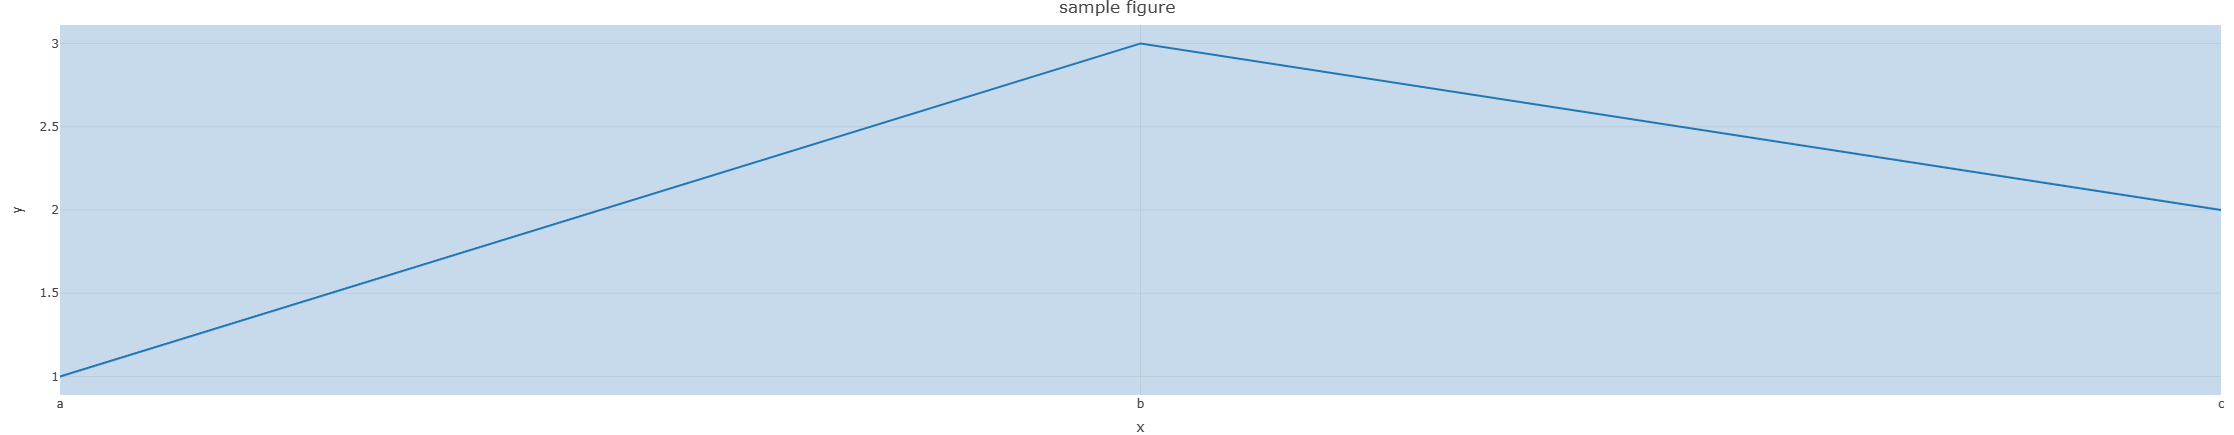
R Plotly
Plotly 的 R 图形库,可以创建出版级质量的交互式图形。
library(plotly)

fig <- plot_ly() %>%
  add_lines(x = c("a","b","c"), y = c(1,3,2))%>%
  layout(title="sample figure", xaxis = list(title = 'x'), yaxis = list(title = 'y'), plot_bgcolor = "#c7daec")

fig
Highcharter
Highcharter 是 Highcharts JavaScript 库及其模块的 R 包装器。
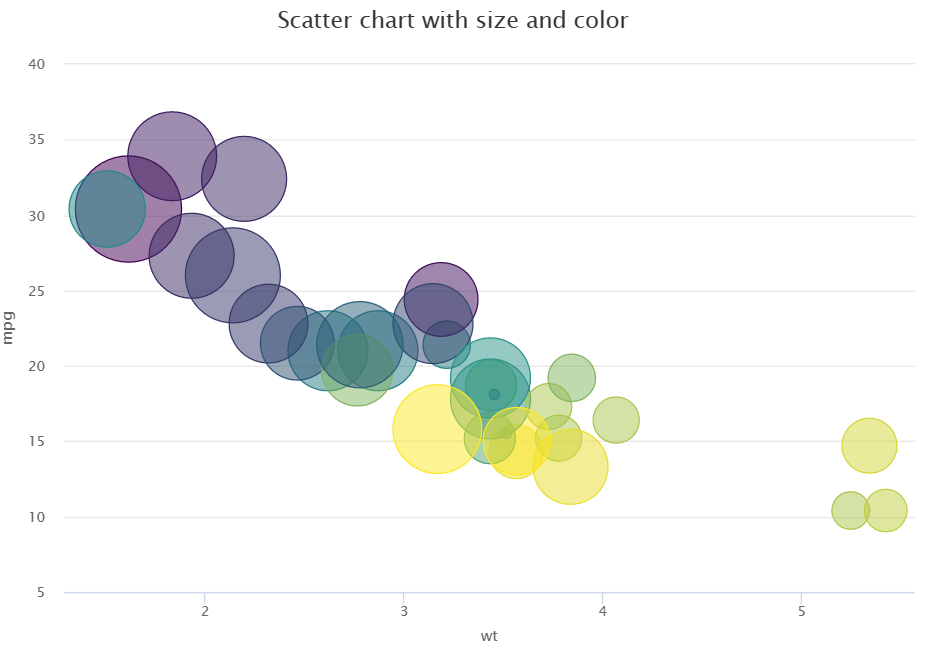
library(magrittr)
library(highcharter)
hchart(mtcars, "scatter", hcaes(wt, mpg, z = drat, color = hp)) %>%
  hc_title(text = "Scatter chart with size and color")