教程:创建、评估推荐系统并对其评分
本教程介绍了 Microsoft Fabric 中 Synapse 数据科学工作流的端到端示例。 此应用场景是为在线书籍推荐构建模型。
本教程涵盖以下步骤:
- 将数据上传到湖屋
- 对数据执行探索性分析
- 使用 MLflow 训练模型并进行记录
- 加载模型并进行预测
我们提供了许多类型的可用推荐算法。 本教程使用交替最小二乘法 (ALS) 矩阵分解算法。 ALS 是一种基于模型的协作筛选算法。

ALS 会尝试将评级矩阵 R 估算为两个低秩矩阵 U 和 V 的乘积,即 U 和 V。此处,R = U * Vt。 通常,这些近似值称为因子矩阵。
ALS 采用迭代算法。 每次迭代保持一个因子矩阵不变,而另一个则使用最小二乘法求解。 然后,在求解其他因子矩阵时,新求得的因子矩阵保持不变。

先决条件
获取 Microsoft Fabric 订阅。 或者注册免费的 Microsoft Fabric 试用版。
登录 Microsoft Fabric。
使用主页左侧的体验切换器切换到 Synapse 数据科学体验。
- 如有必要,请如在 Microsoft Fabric 中创建湖屋中所述创建 Microsoft Fabric 湖屋。
请按照笔记本进行操作
可以选择下面其中一个选项,以在笔记本中进行操作:
- 在 Synapse 数据科学体验中打开并运行内置笔记本
- 将笔记本从 GitHub 上传到 Synapse 数据科学体验
打开内置笔记本
“书籍推荐”是本教程随附的示例笔记本。
要在 Synapse 数据科学体验中打开教程的内置示例笔记本,请执行以下操作:
转到 Synapse 数据科学主页。
选择“使用示例”。
选择相应的示例:
- 来自默认的“端到端工作流 (Python)”选项卡(如果示例适用于 Python 教程)。
- 来自“端到端工作流 (R)“选项卡(如果示例适用于 R 教程)。
- 从“快速教程”选项卡选择(如果示例适用于快速教程)。
从 GitHub 导入笔记本
AIsample - Book Recommendation.ipynb 是本教程随附的笔记本。
若要打开本教程随附的笔记本,请按照让系统为数据科学做好准备教程中的说明操作,将该笔记本导入到工作区。
或者,如果要从此页面复制并粘贴代码,则可以创建新的笔记本。
在开始运行代码之前,请务必将湖屋连接到笔记本。
步骤 1:加载数据
此应用场景中的书籍推荐数据集由三个单独的数据集组成:
Books.csv – 每本书都用国际标准书号标识 (ISBN),且已删除无效日期。 此外,数据集还包括游戏、作者和发布者。 对于具有多个作者的书籍,Books.csv 文件仅列出第一个作者。 URL 指向 Amazon 网站资源以获取三幅不同大小的封面图像。
ISBN Book-Title Book-Author Year-Of-Publication Publisher Image-URL-S Image-URL-M Image-URL-l 0195153448 古典神话 Mark P. O. Morford 2002 牛津大学出版社 http://images.amazon.com/images/P/0195153448.01.THUMBZZZ.jpg http://images.amazon.com/images/P/0195153448.01.MZZZZZZZ.jpg http://images.amazon.com/images/P/0195153448.01.LZZZZZZZ.jpg 0002005018 Clara Callan Richard Bruce Wright 2001 HarperFlamingo Canada http://images.amazon.com/images/P/0002005018.01.THUMBZZZ.jpg http://images.amazon.com/images/P/0002005018.01.MZZZZZZZ.jpg http://images.amazon.com/images/P/0002005018.01.LZZZZZZZ.jpg Ratings.csv:每本书的评级是显式(用户以 1-10 评级)或隐式(可观察到,无需用户输入,以 0 指示)。
User-ID ISBN Book-Rating 276725 034545104X 0 276726 0155061224 5 Users.csv:已匿名化并映射到整数的用户 ID。 如果可用,提供人口统计数据(如地理位置和年龄)。 如果此数据不可用,则这些值为
null。User-ID 位置 Age 1 “nyc new york usa” 2 “stockton california usa” 18.0
定义这些参数,以便可以将此笔记本应用于不同的数据集:
IS_CUSTOM_DATA = False  # If True, the dataset has to be uploaded manually

USER_ID_COL = "User-ID"  # Must not be '_user_id' for this notebook to run successfully
ITEM_ID_COL = "ISBN"  # Must not be '_item_id' for this notebook to run successfully
ITEM_INFO_COL = (
    "Book-Title"  # Must not be '_item_info' for this notebook to run successfully
)
RATING_COL = (
    "Book-Rating"  # Must not be '_rating' for this notebook to run successfully
)
IS_SAMPLE = True  # If True, use only <SAMPLE_ROWS> rows of data for training; otherwise, use all data
SAMPLE_ROWS = 5000  # If IS_SAMPLE is True, use only this number of rows for training

DATA_FOLDER = "Files/book-recommendation/"  # Folder that contains the datasets
ITEMS_FILE = "Books.csv"  # File that contains the item information
USERS_FILE = "Users.csv"  # File that contains the user information
RATINGS_FILE = "Ratings.csv"  # File that contains the rating information

EXPERIMENT_NAME = "aisample-recommendation"  # MLflow experiment name
下载数据并将其存储在湖屋中
此代码会下载数据集,然后将其存储在湖屋中。
重要
在运行笔记本之前,请务必向笔记本添加湖屋。 否则会出错。
if not IS_CUSTOM_DATA:
    # Download data files into a lakehouse if they don't exist
    import os, requests

    remote_url = "https://synapseaisolutionsa.blob.core.windows.net/public/Book-Recommendation-Dataset"
    file_list = ["Books.csv", "Ratings.csv", "Users.csv"]
    download_path = f"/lakehouse/default/{DATA_FOLDER}/raw"

    if not os.path.exists("/lakehouse/default"):
        raise FileNotFoundError(
            "Default lakehouse not found, please add a lakehouse and restart the session."
        )
    os.makedirs(download_path, exist_ok=True)
    for fname in file_list:
        if not os.path.exists(f"{download_path}/{fname}"):
            r = requests.get(f"{remote_url}/{fname}", timeout=30)
            with open(f"{download_path}/{fname}", "wb") as f:
                f.write(r.content)
    print("Downloaded demo data files into lakehouse.")
设置 MLflow 试验跟踪
使用此代码设置 MLflow 试验跟踪。 此示例禁用自动日志记录。 有关详细信息,请参阅 Microsoft Fabric 中的自动日志记录一文。
# Set up MLflow for experiment tracking
import mlflow

mlflow.set_experiment(EXPERIMENT_NAME)
mlflow.autolog(disable=True)  # Disable MLflow autologging
从湖屋读取数据
将正确的数据放入湖屋后,可以将三个单独的数据集读取到笔记本中的单独 Spark DataFrame。 此代码中的文件路径使用前面定义的参数。
df_items = (
    spark.read.option("header", True)
    .option("inferSchema", True)
    .csv(f"{DATA_FOLDER}/raw/{ITEMS_FILE}")
    .cache()
)

df_ratings = (
    spark.read.option("header", True)
    .option("inferSchema", True)
    .csv(f"{DATA_FOLDER}/raw/{RATINGS_FILE}")
    .cache()
)

df_users = (
    spark.read.option("header", True)
    .option("inferSchema", True)
    .csv(f"{DATA_FOLDER}/raw/{USERS_FILE}")
    .cache()
)
步骤 2:执行探索性数据分析
显示原始数据
现在,使用 display 命令浏览 Spark DataFrame。 使用此命令可查看 DataFramke 的高级统计信息,并了解数据集中不同列彼此之间的关系。 在浏览数据集之前,请使用此代码导入所需的库:
import pyspark.sql.functions as F
from pyspark.ml.feature import StringIndexer
import matplotlib.pyplot as plt
import seaborn as sns
color = sns.color_palette()  # Adjusting plotting style
import pandas as pd  # DataFrames
使用此代码查看包含书籍数据的 DataFrame:
display(df_items, summary=True)
添加 _item_id 列供以后使用。 对于推荐模型,_item_id 值必须为整数。 此代码使用 StringIndexer 将 ITEM_ID_COL 转换为索引:
df_items = (
    StringIndexer(inputCol=ITEM_ID_COL, outputCol="_item_id")
    .setHandleInvalid("skip")
    .fit(df_items)
    .transform(df_items)
    .withColumn("_item_id", F.col("_item_id").cast("int"))
)
显示 DataFrame 并检查 _item_id 值是否按预期单调连续地增加:
display(df_items.sort(F.col("_item_id").desc()))
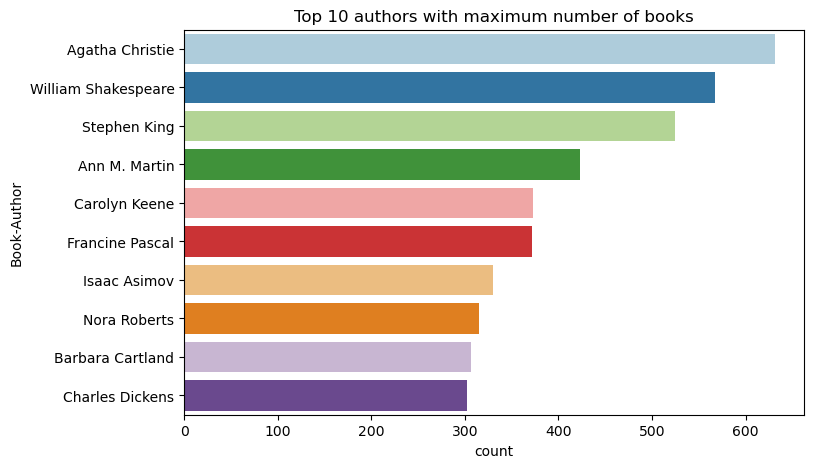
使用此代码按写入的书籍数量以降序绘制前 10 位作者。 Agatha Christie 以 600 多本书的成绩排名作者榜榜首,其次是 William Shakespeare。
df_books = df_items.toPandas() # Create a pandas DataFrame from the Spark DataFrame for visualization
plt.figure(figsize=(8,5))
sns.countplot(y="Book-Author",palette = 'Paired', data=df_books,order=df_books['Book-Author'].value_counts().index[0:10])
plt.title("Top 10 authors with maximum number of books")
接下来,显示包含用户数据的数据帧:
display(df_users, summary=True)
如果某行缺少 User-ID 值,则删除该行。 自定义数据集中的缺失值不会引起问题。
df_users = df_users.dropna(subset=(USER_ID_COL))
display(df_users, summary=True)
添加 _user_id 列供以后使用。 对于推荐模型,_user_id 值必须为整数。 以下代码示例使用 StringIndexer 将 USER_ID_COL 转换为索引。
书籍数据集已有一个整数 User-ID 列。 但是,添加一个 _user_id 列以兼容不同的数据集会让此示例更加可靠。 使用此代码添加 _user_id 列:
df_users = (
    StringIndexer(inputCol=USER_ID_COL, outputCol="_user_id")
    .setHandleInvalid("skip")
    .fit(df_users)
    .transform(df_users)
    .withColumn("_user_id", F.col("_user_id").cast("int"))
)
display(df_users.sort(F.col("_user_id").desc()))
使用此代码查看分级数据:
display(df_ratings, summary=True)
获取不同的评级,并将其保存到名为 ratings 的列表中供以后使用:
ratings = [i[0] for i in df_ratings.select(RATING_COL).distinct().collect()]
print(ratings)
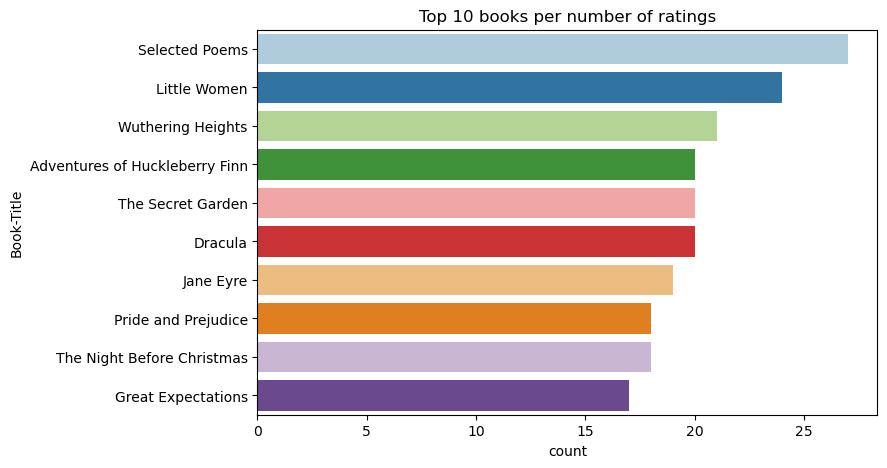
使用此代码可显示评级最高最高的前 10 本书籍:
plt.figure(figsize=(8,5))
sns.countplot(y="Book-Title",palette = 'Paired',data= df_books, order=df_books['Book-Title'].value_counts().index[0:10])
plt.title("Top 10 books per number of ratings")
根据评级,“诗歌精选”是最受欢迎的书籍。 《哈克贝利·费恩历险记》、《秘密花园》和《吸血鬼德古拉》三本书的评级相同。
合并数据
将三个 DataFrame 合并为一个 DataFrame,以便进行更全面的分析:
df_all = df_ratings.join(df_users, USER_ID_COL, "inner").join(
    df_items, ITEM_ID_COL, "inner"
)
df_all_columns = [
    c for c in df_all.columns if c not in ["_user_id", "_item_id", RATING_COL]
]

# Reorder the columns to ensure that _user_id, _item_id, and Book-Rating are the first three columns
df_all = (
    df_all.select(["_user_id", "_item_id", RATING_COL] + df_all_columns)
    .withColumn("id", F.monotonically_increasing_id())
    .cache()
)

display(df_all)
使用以下代码显示不同用户、书籍和交互总数:
print(f"Total Users: {df_users.select('_user_id').distinct().count()}")
print(f"Total Items: {df_items.select('_item_id').distinct().count()}")
print(f"Total User-Item Interactions: {df_all.count()}")
计算和绘制最热门的商品
使用以下代码计算并显示最受欢迎的 10 本书籍:
# Compute top popular products
df_top_items = (
    df_all.groupby(["_item_id"])
    .count()
    .join(df_items, "_item_id", "inner")
    .sort(["count"], ascending=[0])
)

# Find top <topn> popular items
topn = 10
pd_top_items = df_top_items.limit(topn).toPandas()
pd_top_items.head(10)
提示
<topn> 值可用于“热门”或“热销”推荐部分。
# Plot top <topn> items
f, ax = plt.subplots(figsize=(10, 5))
plt.xticks(rotation="vertical")
sns.barplot(y=ITEM_INFO_COL, x="count", data=pd_top_items)
ax.tick_params(axis='x', rotation=45)
plt.xlabel("Number of Ratings for the Item")
plt.show()

准备训练和测试数据集
在训练之前,ALS 矩阵需要一些数据准备。 使用此代码示例来准备数据。 此代码将执行以下操作:
- 将评级列转换为正确的类型
- 使用用户评级对训练数据进行采样
- 将数据拆分为训练数据集和测试数据集
if IS_SAMPLE:
    # Must sort by '_user_id' before performing limit to ensure that ALS works normally
    # If training and test datasets have no common _user_id, ALS will fail
    df_all = df_all.sort("_user_id").limit(SAMPLE_ROWS)

# Cast the column into the correct type
df_all = df_all.withColumn(RATING_COL, F.col(RATING_COL).cast("float"))

# Using a fraction between 0 and 1 returns the approximate size of the dataset; for example, 0.8 means 80% of the dataset
# Rating = 0 means the user didn't rate the item, so it can't be used for training
# We use the 80% of the dataset with rating > 0 as the training dataset
fractions_train = {0: 0}
fractions_test = {0: 0}
for i in ratings:
    if i == 0:
        continue
    fractions_train[i] = 0.8
    fractions_test[i] = 1
# Training dataset
train = df_all.sampleBy(RATING_COL, fractions=fractions_train)

# Join with leftanti will select all rows from df_all with rating > 0 and not in the training dataset; for example, the remaining 20% of the dataset
# test dataset
test = df_all.join(train, on="id", how="leftanti").sampleBy(
    RATING_COL, fractions=fractions_test
)
稀疏度是指反馈数据少,不足以识别用户兴趣相似性。 为更好地了解数据和目前的问题,请使用以下代码来计算数据集的稀疏度:
# Compute the sparsity of the dataset
def get_mat_sparsity(ratings):
    # Count the total number of ratings in the dataset - used as numerator
    count_nonzero = ratings.select(RATING_COL).count()
    print(f"Number of rows: {count_nonzero}")

    # Count the total number of distinct user_id and distinct product_id - used as denominator
    total_elements = (
        ratings.select("_user_id").distinct().count()
        * ratings.select("_item_id").distinct().count()
    )

    # Calculate the sparsity by dividing the numerator by the denominator
    sparsity = (1.0 - (count_nonzero * 1.0) / total_elements) * 100
    print("The ratings DataFrame is ", "%.4f" % sparsity + "% sparse.")

get_mat_sparsity(df_all)
# Check the ID range
# ALS supports only values in the integer range
print(f"max user_id: {df_all.agg({'_user_id': 'max'}).collect()[0][0]}")
print(f"max user_id: {df_all.agg({'_item_id': 'max'}).collect()[0][0]}")
步骤 3:开发和训练模型
训练 ALS 模型,为用户提供个性化推荐。
定义模型
Spark ML 为生成 ALS 模型时提供了一个方便的 API。 但是,该模型在处理数据稀疏度和冷启动(在用户或商品是新的时进行推荐)等问题时并不可靠。 为提高模型的性能,可以将交叉验证和自动超参数优化相结合。
使用此代码导入模型培训和评估所需的库:
# Import Spark required libraries
from pyspark.ml.evaluation import RegressionEvaluator
from pyspark.ml.recommendation import ALS
from pyspark.ml.tuning import ParamGridBuilder, CrossValidator, TrainValidationSplit

# Specify the training parameters
num_epochs = 1  # Number of epochs; here we use 1 to reduce the training time
rank_size_list = [64]  # The values of rank in ALS for tuning
reg_param_list = [0.01, 0.1]  # The values of regParam in ALS for tuning
model_tuning_method = "TrainValidationSplit"  # TrainValidationSplit or CrossValidator
# Build the recommendation model by using ALS on the training data
# We set the cold start strategy to 'drop' to ensure that we don't get NaN evaluation metrics
als = ALS(
    maxIter=num_epochs,
    userCol="_user_id",
    itemCol="_item_id",
    ratingCol=RATING_COL,
    coldStartStrategy="drop",
    implicitPrefs=False,
    nonnegative=True,
)
优化模型超参数
下一代码示例构建了一个参数网格,以帮助搜索超参数。 此代码还会创建一个回归评估器,使用均方根误差 (RMSE) 作为评估指标:
#  Construct a grid search to select the best values for the training parameters
param_grid = (
    ParamGridBuilder()
    .addGrid(als.rank, rank_size_list)
    .addGrid(als.regParam, reg_param_list)
    .build()
)

print("Number of models to be tested: ", len(param_grid))

# Define the evaluator and set the loss function to the RMSE
evaluator = RegressionEvaluator(
    metricName="rmse", labelCol=RATING_COL, predictionCol="prediction"
)
下一代码示例基于预配置参数启动不同的模型优化方法。 有关模型优化的更多信息,请参阅 Apache Spark 网站上的 ML 优化:模型选择和超参数优化。
# Build cross-validation by using CrossValidator and TrainValidationSplit
if model_tuning_method == "CrossValidator":
    tuner = CrossValidator(
        estimator=als,
        estimatorParamMaps=param_grid,
        evaluator=evaluator,
        numFolds=5,
        collectSubModels=True,
    )
elif model_tuning_method == "TrainValidationSplit":
    tuner = TrainValidationSplit(
        estimator=als,
        estimatorParamMaps=param_grid,
        evaluator=evaluator,
        # 80% of the training data will be used for training; 20% for validation
        trainRatio=0.8,
        collectSubModels=True,
    )
else:
    raise ValueError(f"Unknown model_tuning_method: {model_tuning_method}")
评估模型
应根据测试数据评估模块。 训练良好的模型应具有数据集的高指标。
过度拟合的模型可能需要增加训练数据的大小或减少一些冗余功能。 可能需要更改模型体系结构,或者可能需要微调一些参数。
注意
R 平方指标值为负值表示训练的模型的性能比水平直线差。 此发现表明经过训练的模型不对数据进行解释。
要定义评估函数,请使用以下代码:
def evaluate(model, data, verbose=0):
    """
    Evaluate the model by computing rmse, mae, r2, and variance over the data.
    """

    predictions = model.transform(data).withColumn(
        "prediction", F.col("prediction").cast("double")
    )

    if verbose > 1:
        # Show 10 predictions
        predictions.select("_user_id", "_item_id", RATING_COL, "prediction").limit(
            10
        ).show()

    # Initialize the regression evaluator
    evaluator = RegressionEvaluator(predictionCol="prediction", labelCol=RATING_COL)

    _evaluator = lambda metric: evaluator.setMetricName(metric).evaluate(predictions)
    rmse = _evaluator("rmse")
    mae = _evaluator("mae")
    r2 = _evaluator("r2")
    var = _evaluator("var")

    if verbose > 0:
        print(f"RMSE score = {rmse}")
        print(f"MAE score = {mae}")
        print(f"R2 score = {r2}")
        print(f"Explained variance = {var}")

    return predictions, (rmse, mae, r2, var)
使用 MLflow 跟踪试验
使用 MLflow 跟踪所有试验并记录参数、指标和模型。 要启动模型训练和评估,请使用以下代码:
from mlflow.models.signature import infer_signature

with mlflow.start_run(run_name="als"):
    # Train models
    models = tuner.fit(train)
    best_metrics = {"RMSE": 10e6, "MAE": 10e6, "R2": 0, "Explained variance": 0}
    best_index = 0
    # Evaluate models
    # Log models, metrics, and parameters
    for idx, model in enumerate(models.subModels):
        with mlflow.start_run(nested=True, run_name=f"als_{idx}") as run:
            print("\nEvaluating on test data:")
            print(f"subModel No. {idx + 1}")
            predictions, (rmse, mae, r2, var) = evaluate(model, test, verbose=1)

            signature = infer_signature(
                train.select(["_user_id", "_item_id"]),
                predictions.select(["_user_id", "_item_id", "prediction"]),
            )
            print("log model:")
            mlflow.spark.log_model(
                model,
                f"{EXPERIMENT_NAME}-alsmodel",
                signature=signature,
                registered_model_name=f"{EXPERIMENT_NAME}-alsmodel",
                dfs_tmpdir="Files/spark",
            )
            print("log metrics:")
            current_metric = {
                "RMSE": rmse,
                "MAE": mae,
                "R2": r2,
                "Explained variance": var,
            }
            mlflow.log_metrics(current_metric)
            if rmse < best_metrics["RMSE"]:
                best_metrics = current_metric
                best_index = idx

            print("log parameters:")
            mlflow.log_params(
                {
                    "subModel_idx": idx,
                    "num_epochs": num_epochs,
                    "rank_size_list": rank_size_list,
                    "reg_param_list": reg_param_list,
                    "model_tuning_method": model_tuning_method,
                    "DATA_FOLDER": DATA_FOLDER,
                }
            )
    # Log the best model and related metrics and parameters to the parent run
    mlflow.spark.log_model(
        models.subModels[best_index],
        f"{EXPERIMENT_NAME}-alsmodel",
        signature=signature,
        registered_model_name=f"{EXPERIMENT_NAME}-alsmodel",
        dfs_tmpdir="Files/spark",
    )
    mlflow.log_metrics(best_metrics)
    mlflow.log_params(
        {
            "subModel_idx": idx,
            "num_epochs": num_epochs,
            "rank_size_list": rank_size_list,
            "reg_param_list": reg_param_list,
            "model_tuning_method": model_tuning_method,
            "DATA_FOLDER": DATA_FOLDER,
        }
    )
要查看训练运行的已记录信息,请从工作区中选择名为 aisample-recommendation 的试验。 如果更改了试验名称,请选择具有新名称的试验。 记录的信息如下图所示:

步骤 4:加载用于评分和预测的最终模型
训练完成后,选择最佳模型,加载模型进行评分(有时称为推理)。 此代码加载模型并使用预测为每个用户推荐前 10 本书:
# Load the best model
# MLflow uses PipelineModel to wrap the original model, so we extract the original ALSModel from the stages
model_uri = f"models:/{EXPERIMENT_NAME}-alsmodel/1"
loaded_model = mlflow.spark.load_model(model_uri, dfs_tmpdir="Files/spark").stages[-1]

# Generate top 10 book recommendations for each user
userRecs = loaded_model.recommendForAllUsers(10)

# Represent the recommendations in an interpretable format
userRecs = (
    userRecs.withColumn("rec_exp", F.explode("recommendations"))
    .select("_user_id", F.col("rec_exp._item_id"), F.col("rec_exp.rating"))
    .join(df_items.select(["_item_id", "Book-Title"]), on="_item_id")
)
userRecs.limit(10).show()
输出如下表所示:
| _item_id | _user_id | rating | Book-Title |
|---|---|---|---|
| 44865 | 7 | 7.9996786 | Lasher: Lives of ... |
| 786 | 7 | 6.2255826 | The Piano Man's D... |
| 45330 | 7 | 4.980466 | State of Mind |
| 38960 | 7 | 4.980466 | All He Ever Wanted |
| 125415 | 7 | 4.505084 | Harry Potter and ... |
| 44939 | 7 | 4.3579073 | Taltos: Lives of ... |
| 175247 | 7 | 4.3579073 | The Bonesetter's ... |
| 170183 | 7 | 4.228735 | Living the Simple... |
| 88503 | 7 | 4.221206 | Island of the Blu... |
| 32894 | 7 | 3.9031885 | Winter Solstice |
将预测保存到湖屋
要将推荐写回湖屋,请使用以下代码:
# Code to save userRecs into the lakehouse
userRecs.write.format("delta").mode("overwrite").save(
    f"{DATA_FOLDER}/predictions/userRecs"
)
相关内容
反馈
即将发布:在整个 2024 年,我们将逐步淘汰作为内容反馈机制的“GitHub 问题”,并将其取代为新的反馈系统。 有关详细信息,请参阅:https://aka.ms/ContentUserFeedback。
提交和查看相关反馈