本教程演示了 Microsoft Fabric 中 Synapse 数据科学工作流的端到端示例。 了解如何创建、训练和评估提升模型并应用提升建模技术。
先决条件
获取 Microsoft Fabric 订阅。 或者,注册免费的 Microsoft Fabric 试用版。
登录 Microsoft Fabric。
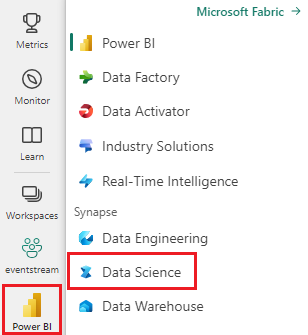
使用主页左下侧的体验切换器切换到 Fabric。

- 熟悉 Microsoft Fabric 笔记本
- 此笔记本的湖屋,用以存储此示例的数据。 有关详细信息,请访问将湖屋添加到笔记本
在笔记本中继续操作
可以通过以下其中一种方式在笔记本中执行操作:
- 打开并运行内置笔记本。
- 从 GitHub 上传笔记本。
打开内置笔记本
本教程随附“提升建模”示例笔记本。
若要打开本教程的示例笔记本,请按照 为数据科学教程准备系统中的说明进行操作。
在开始运行代码之前,请务必将湖屋附加到笔记本。
从 GitHub 导入笔记本
本教程随附 AIsample - Uplift Modeling.ipynb 笔记本。
若要打开本教程随附的笔记本,请按照 为数据科学教程准备系统中的说明将笔记本导入工作区。
如果想要复制并粘贴此页面中的代码,可以 创建新的笔记本。
在开始运行代码之前,请务必将湖屋附加到笔记本。
步骤 1:加载数据
数据集
Criteo AI 实验室创建了数据集。 该数据集有 13M 行。 每行表示一个用户。 每行有 12 个特征变量、一个处理标识符,以及两个二进制标签,分别用于访问和转换。
- f0 - f11:特征值(密集浮点值)
- 处理:用户是否是随机的处理(例如广告)目标(1 = 处理,0 = 对照)
- 转化:用户是否发生了转化(例如进行购买)(二进制标签)
- 访问:用户是否发生了转化(例如进行购买)(二进制标签)
引文
用于此笔记本的数据集需要此“BibTex”引文:
@inproceedings{Diemert2018,
author = {{Diemert Eustache, Betlei Artem} and Renaudin, Christophe and Massih-Reza, Amini},
title={A Large Scale Benchmark for Uplift Modeling},
publisher = {ACM},
booktitle = {Proceedings of the AdKDD and TargetAd Workshop, KDD, London,United Kingdom, August, 20, 2018},
year = {2018}
}
提示
通过定义以下参数,可以轻松地将此笔记本应用于不同的数据集。
IS_CUSTOM_DATA = False  # If True, the user must upload the dataset manually
DATA_FOLDER = "Files/uplift-modelling"
DATA_FILE = "criteo-research-uplift-v2.1.csv"

# Data schema
FEATURE_COLUMNS = [f"f{i}" for i in range(12)]
TREATMENT_COLUMN = "treatment"
LABEL_COLUMN = "visit"

EXPERIMENT_NAME = "aisample-upliftmodelling"  # MLflow experiment name
导入库文件
在处理之前,必须导入所需的 Spark 和 SynapseML 库。 还必须导入数据可视化库 - 例如 Seaborn、Python 数据可视化库。 数据可视化库提供了一个高级界面,用于在 DataFrame 和数组上生成视觉资源。 详细了解 Spark、SynapseML和 Seaborn。
import os
import gzip

import pyspark.sql.functions as F
from pyspark.sql.window import Window
from pyspark.sql.types import *

import numpy as np
import pandas as pd

import matplotlib as mpl
import matplotlib.pyplot as plt
import matplotlib.style as style
import seaborn as sns

%matplotlib inline

from synapse.ml.featurize import Featurize
from synapse.ml.core.spark import FluentAPI
from synapse.ml.lightgbm import *
from synapse.ml.train import ComputeModelStatistics

import mlflow
下载数据集并上传到 Lakehouse
此代码下载数据集的公开可用版本,然后将该数据资源存储在 Fabric Lakehouse 中。
重要
在运行笔记本之前,请确保向笔记本添加湖屋。 否则将导致错误。
if not IS_CUSTOM_DATA:
    # Download demo data files into lakehouse if not exist
    import os, requests

    remote_url = "http://go.criteo.net/criteo-research-uplift-v2.1.csv.gz"
    download_file = "criteo-research-uplift-v2.1.csv.gz"
    download_path = f"/lakehouse/default/{DATA_FOLDER}/raw"

    if not os.path.exists("/lakehouse/default"):
        raise FileNotFoundError("Default lakehouse not found, please add a lakehouse and restart the session.")
    os.makedirs(download_path, exist_ok=True)
    if not os.path.exists(f"{download_path}/{DATA_FILE}"):
        r = requests.get(f"{remote_url}", timeout=30)
        with open(f"{download_path}/{download_file}", "wb") as f:
            f.write(r.content)
        with gzip.open(f"{download_path}/{download_file}", "rb") as fin:
            with open(f"{download_path}/{DATA_FILE}", "wb") as fout:
                fout.write(fin.read())
    print("Downloaded demo data files into lakehouse.")
开始录制此笔记本的运行时。
# Record the notebook running time
import time

ts = time.time()
设置 MLflow 试验跟踪
为了扩展 MLflow 日志记录功能,自动记录会在训练期间自动捕获机器学习模型的输入参数和输出指标的值。 然后,此信息将记录到工作区,其中 MLflow API 或工作区中的相应试验可以访问和可视化它。 有关自动记录的详细信息,请访问此资源。
# Set up the MLflow experiment
import mlflow

mlflow.set_experiment(EXPERIMENT_NAME)
mlflow.autolog(disable=True)  # Disable MLflow autologging
注意
若要在笔记本会话中禁用 Microsoft Fabric 自动记录,请调用 mlflow.autolog() 并设置 disable=True。
从湖仓读取数据
从湖屋的“文件”部分读取原始数据,并为不同的日期部分添加更多列。 使用相同的信息创建分区增量表。
raw_df = spark.read.csv(f"{DATA_FOLDER}/raw/{DATA_FILE}", header=True, inferSchema=True).cache()
步骤 2:探索数据分析
使用 display 命令查看有关数据集的高级统计信息。 还可以显示图表视图,以便轻松可视化数据集的子集。
display(raw_df.limit(20))
检查访问的用户百分比、转换的用户百分比以及转换的访问者百分比。
raw_df.select(
    F.mean("visit").alias("Percentage of users that visit"),
    F.mean("conversion").alias("Percentage of users that convert"),
    (F.sum("conversion") / F.sum("visit")).alias("Percentage of visitors that convert"),
).show()
分析表明,4.9% 的处理组用户(即接受了处理或广告的用户)访问了在线商店。 只有 3.8% 来自对照组的用户(这些用户从未接受过治疗,也从未有机会接触或看到广告)也采取了相同的行动。 此外,0.31% 的处理组用户完成了转化或进行了购买,而对照组中只有 0.19% 的用户完成了购买。 因此,来自处理组的访问者中完成购买的转化率为 6.36%,而对照组用户的转化率仅为 5.07%。 根据这些结果,处理可以潜在地将访问率提高约 1%,并将访问者的转化率提高约 1.3%。 治疗导致显著改善。
步骤 3:定义用于训练的模型
准备训练和测试数据集
在这里,可以将 Featurize 转换器拟合到 raw_df DataFrame,以便从指定的输入列中提取特征,并将这些功能输出到名为 features的新列。
生成的 DataFrame 存储在名为 df的新 DataFrame 中。
transformer = Featurize().setOutputCol("features").setInputCols(FEATURE_COLUMNS).fit(raw_df)
df = transformer.transform(raw_df)
# Split the DataFrame into training and test sets, with a 80/20 ratio and a seed of 42
train_df, test_df = df.randomSplit([0.8, 0.2], seed=42)

# Print the training and test dataset sizes
print("Size of train dataset: %d" % train_df.count())
print("Size of test dataset: %d" % test_df.count())

# Group the training dataset by the treatment column, and count the number of occurrences of each value
train_df.groupby(TREATMENT_COLUMN).count().show()
准备处理和控制数据集
创建训练和测试数据集后,还必须形成处理和控制数据集,以训练机器学习模型以测量提升。
# Extract the treatment and control DataFrames
treatment_train_df = train_df.where(f"{TREATMENT_COLUMN} > 0")
control_train_df = train_df.where(f"{TREATMENT_COLUMN} = 0")
准备好数据后,即可继续使用 LightGBM 训练模型。
提升建模:使用 LightGBM 的 T-Learner
元学习器是一组基于机器学习算法(如 LightGBM、Xgboost 等)构建的算法。它们帮助估计条件平均处理效应 (CATE)。 T-learner 是元学习器,不使用单个模型。 相反,T-learner 为每个处理变量使用一个模型。 因此,开发两个模型,我们将元学习器称为 T-learner。 T 学习器使用多个机器学习模型,通过强制学习器首先基于模型进行拆分,来克服完全放弃处理的问题。
mlflow.autolog(exclusive=False)
classifier = (
    LightGBMClassifier(dataTransferMode="bulk")
    .setFeaturesCol("features")  # Set the column name for features
    .setNumLeaves(10)  # Set the number of leaves in each decision tree
    .setNumIterations(100)  # Set the number of boosting iterations
    .setObjective("binary")  # Set the objective function for binary classification
    .setLabelCol(LABEL_COLUMN)  # Set the column name for the label
)

# Start a new MLflow run with the name "uplift"
active_run = mlflow.start_run(run_name="uplift")

# Start a new nested MLflow run with the name "treatment"
with mlflow.start_run(run_name="treatment", nested=True) as treatment_run:
    treatment_run_id = treatment_run.info.run_id  # Get the ID of the treatment run
    treatment_model = classifier.fit(treatment_train_df)  # Fit the classifier on the treatment training data

# Start a new nested MLflow run with the name "control"
with mlflow.start_run(run_name="control", nested=True) as control_run:
    control_run_id = control_run.info.run_id  # Get the ID of the control run
    control_model = classifier.fit(control_train_df)  # Fit the classifier on the control training data
使用测试数据集进行预测
在这里,可以使用前面定义的 treatment_model 和 control_model来转换 test_df 测试数据集。 然后,计算预测的提升效果。 将预测提升定义为预测治疗结果与预测控制结果之间的差异。 这种预测的提升差异越大,治疗(例如广告)对个人或子组的有效性越大。
getPred = F.udf(lambda v: float(v[1]), FloatType())

# Cache the resulting DataFrame for easier access
test_pred_df = (
    test_df.mlTransform(treatment_model)
    .withColumn("treatment_pred", getPred("probability"))
    .drop("rawPrediction", "probability", "prediction")
    .mlTransform(control_model)
    .withColumn("control_pred", getPred("probability"))
    .drop("rawPrediction", "probability", "prediction")
    .withColumn("pred_uplift", F.col("treatment_pred") - F.col("control_pred"))
    .select(TREATMENT_COLUMN, LABEL_COLUMN, "treatment_pred", "control_pred", "pred_uplift")
    .cache()
)

# Display the first twenty rows of the resulting DataFrame
display(test_pred_df.limit(20))
执行模型评估
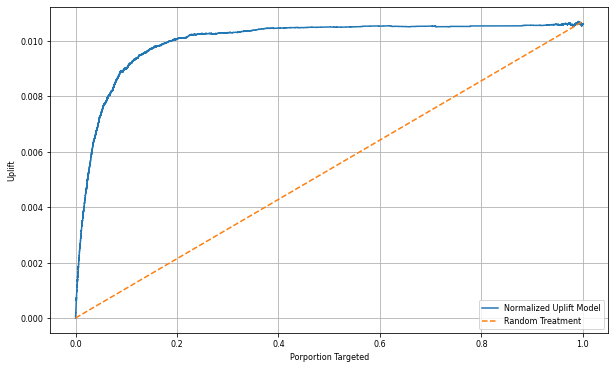
由于无法观察到每个个体的实际提升效果,因此需要测量一个群体的提升。 你使用提升曲线绘制了整个人群的实际累积提升。
x轴表示为接受治疗而选择的人口比率。 值为 0 表示没有治疗组 - 没有人接触或提供治疗。 值为 1 表示完全处理组 - 每个人都会接触到或接受处理。 Y 轴显示提升度量值。 目标是确定处理组的大小,或确定接受或接触到处理(例如广告)的群体在总体中的比例。 此方法优化目标选择,以优化结果。
首先,根据预测的提升对测试数据框的顺序进行排名。 预测的提升是预测治疗结果与预测控制结果之间的差异。
# Compute the percentage rank of the predicted uplift values in descending order, and display the top twenty rows
test_ranked_df = test_pred_df.withColumn("percent_rank", F.percent_rank().over(Window.orderBy(F.desc("pred_uplift"))))

display(test_ranked_df.limit(20))
接下来,计算治疗和控制组中访问的累积百分比。
# Calculate the number of control and treatment samples
C = test_ranked_df.where(f"{TREATMENT_COLUMN} == 0").count()
T = test_ranked_df.where(f"{TREATMENT_COLUMN} != 0").count()

# Add columns to the DataFrame to calculate the control and treatment cumulative sum
test_ranked_df = (
    test_ranked_df.withColumn(
        "control_label",
        F.when(F.col(TREATMENT_COLUMN) == 0, F.col(LABEL_COLUMN)).otherwise(0),
    )
    .withColumn(
        "treatment_label",
        F.when(F.col(TREATMENT_COLUMN) != 0, F.col(LABEL_COLUMN)).otherwise(0),
    )
    .withColumn(
        "control_cumsum",
        F.sum("control_label").over(Window.orderBy("percent_rank")) / C,
    )
    .withColumn(
        "treatment_cumsum",
        F.sum("treatment_label").over(Window.orderBy("percent_rank")) / T,
    )
)

# Display the first 20 rows of the dataframe
display(test_ranked_df.limit(20))
最后,对于每个百分比,计算该组的提升量,即处理组和对照组之间访问累计百分比的差值。
test_ranked_df = test_ranked_df.withColumn("group_uplift", F.col("treatment_cumsum") - F.col("control_cumsum")).cache()
display(test_ranked_df.limit(20))
现在,绘制测试数据集预测的提升曲线。 在绘制之前,必须将 PySpark 数据帧转换为 Pandas 数据帧。
def uplift_plot(uplift_df):
    """
    Plot the uplift curve
    """
    gain_x = uplift_df.percent_rank
    gain_y = uplift_df.group_uplift
    # Plot the data
    fig = plt.figure(figsize=(10, 6))
    mpl.rcParams["font.size"] = 8

    ax = plt.plot(gain_x, gain_y, color="#2077B4", label="Normalized Uplift Model")

    plt.plot(
        [0, gain_x.max()],
        [0, gain_y.max()],
        "--",
        color="tab:orange",
        label="Random Treatment",
    )
    plt.legend()
    plt.xlabel("Porportion Targeted")
    plt.ylabel("Uplift")
    plt.grid()

    return fig, ax


test_ranked_pd_df = test_ranked_df.select(["pred_uplift", "percent_rank", "group_uplift"]).toPandas()
fig, ax = uplift_plot(test_ranked_pd_df)

mlflow.log_figure(fig, "UpliftCurve.png")
x 轴表示选择接受治疗的人群比例。 值为 0 表示没有治疗组 - 没有人接触或提供治疗。 值为 1 表示一个完整的治疗组,即每个人都接受或被提供治疗。 Y 轴显示提升度量值。 目标是确定治疗组的规模,或估算会被提供或接触到这些措施(例如,广告)的人口比例。 此方法优化目标选择,以优化结果。
首先,按预测提升对测试 DataFrame 顺序进行排名。 预测的提升是预测治疗结果与预测控制结果之间的差异。
# Compute the percentage rank of the predicted uplift values in descending order, and display the top twenty rows
test_ranked_df = test_pred_df.withColumn("percent_rank", F.percent_rank().over(Window.orderBy(F.desc("pred_uplift"))))

display(test_ranked_df.limit(20))
接下来,计算治疗和控制组中访问的累积百分比。
# Calculate the number of control and treatment samples
C = test_ranked_df.where(f"{TREATMENT_COLUMN} == 0").count()
T = test_ranked_df.where(f"{TREATMENT_COLUMN} != 0").count()

# Add columns to the DataFrame to calculate the control and treatment cumulative sum
test_ranked_df = (
    test_ranked_df.withColumn(
        "control_label",
        F.when(F.col(TREATMENT_COLUMN) == 0, F.col(LABEL_COLUMN)).otherwise(0),
    )
    .withColumn(
        "treatment_label",
        F.when(F.col(TREATMENT_COLUMN) != 0, F.col(LABEL_COLUMN)).otherwise(0),
    )
    .withColumn(
        "control_cumsum",
        F.sum("control_label").over(Window.orderBy("percent_rank")) / C,
    )
    .withColumn(
        "treatment_cumsum",
        F.sum("treatment_label").over(Window.orderBy("percent_rank")) / T,
    )
)

# Display the first 20 rows of the dataframe
display(test_ranked_df.limit(20))
最后,对于每个百分比,计算该组的提升量,即处理组和对照组之间访问累计百分比的差值。
test_ranked_df = test_ranked_df.withColumn("group_uplift", F.col("treatment_cumsum") - F.col("control_cumsum")).cache()
display(test_ranked_df.limit(20))
现在,绘制测试数据集预测的提升曲线。 在绘制之前,必须将 PySpark 数据帧转换为 Pandas 数据帧。
def uplift_plot(uplift_df):
    """
    Plot the uplift curve
    """
    gain_x = uplift_df.percent_rank
    gain_y = uplift_df.group_uplift
    # Plot the data
    fig = plt.figure(figsize=(10, 6))
    mpl.rcParams["font.size"] = 8

    ax = plt.plot(gain_x, gain_y, color="#2077B4", label="Normalized Uplift Model")

    plt.plot(
        [0, gain_x.max()],
        [0, gain_y.max()],
        "--",
        color="tab:orange",
        label="Random Treatment",
    )
    plt.legend()
    plt.xlabel("Porportion Targeted")
    plt.ylabel("Uplift")
    plt.grid()

    return fig, ax


test_ranked_pd_df = test_ranked_df.select(["pred_uplift", "percent_rank", "group_uplift"]).toPandas()
fig, ax = uplift_plot(test_ranked_pd_df)

mlflow.log_figure(fig, "UpliftCurve.png")
分析和提升曲线都表明,按照预测排名的前 20% 的人群如果接受处理,将会获得显著的收益。 这意味总体中排名前 20% 的人群代表可被说服的群体。 因此,你可以将处理组的目标大小的临界分数设置为 20%,以确定目标精选客户,从而产生尽可能大的影响。
cutoff_percentage = 0.2
cutoff_score = test_ranked_pd_df.iloc[int(len(test_ranked_pd_df) * cutoff_percentage)][
    "pred_uplift"
]

print("Uplift scores that exceed {:.4f} map to Persuadables.".format(cutoff_score))
mlflow.log_metrics(
    {"cutoff_score": cutoff_score, "cutoff_percentage": cutoff_percentage}
)
步骤 4:注册最终 ML 模型
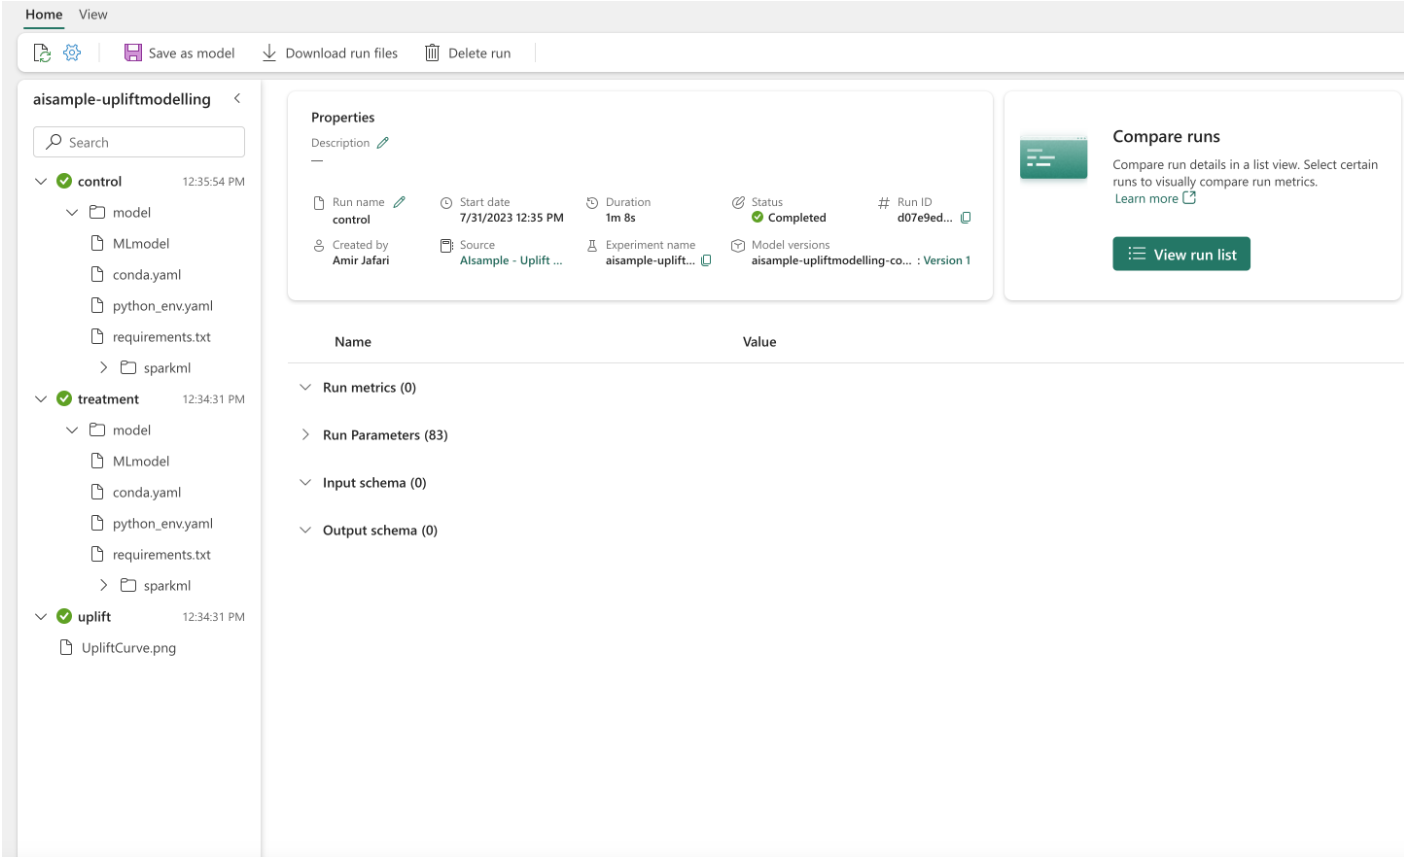
使用 MLflow 跟踪和记录治疗组和控制组的所有试验。 此跟踪和日志记录包括相应的参数、指标和模型。 此信息在工作区中的试验名称下记录,供以后使用。
# Register the model
treatment_model_uri = "runs:/{}/model".format(treatment_run_id)
mlflow.register_model(treatment_model_uri, f"{EXPERIMENT_NAME}-treatmentmodel")

control_model_uri = "runs:/{}/model".format(control_run_id)
mlflow.register_model(control_model_uri, f"{EXPERIMENT_NAME}-controlmodel")

mlflow.end_run()
查看试验:
- 在左侧面板中,选择工作区。
- 查找并选择试验名称,在本例中为“aisample-upliftmodelling”。
步骤 5:保存预测结果
Microsoft Fabric 提供 PREDICT - 一个可缩放的函数,支持在任何计算引擎中批量评分。 它使客户能够操作机器学习模型。 用户可以直接从笔记本或特定模型的项页创建批处理预测。 请访问此资源了解有关 PREDICT 的详细信息,并了解如何在 Microsoft Fabric 中使用 PREDICT。
# Load the model back
loaded_treatmentmodel = mlflow.spark.load_model(treatment_model_uri, dfs_tmpdir="Files/spark")
loaded_controlmodel = mlflow.spark.load_model(control_model_uri, dfs_tmpdir="Files/spark")

# Make predictions
batch_predictions_treatment = loaded_treatmentmodel.transform(test_df)
batch_predictions_control = loaded_controlmodel.transform(test_df)
batch_predictions_treatment.show(5)
# Save the predictions in the lakehouse
batch_predictions_treatment.write.format("delta").mode("overwrite").save(
    f"{DATA_FOLDER}/predictions/batch_predictions_treatment"
)
batch_predictions_control.write.format("delta").mode("overwrite").save(
    f"{DATA_FOLDER}/predictions/batch_predictions_control"
)
# Determine the entire runtime
print(f"Full run cost {int(time.time() - ts)} seconds.")
相关内容
- Microsoft Fabric 中的 机器学习模型
- 训练机器学习模型
- Microsoft Fabric 中的机器学习试验


