作者:Saad Ladki
介绍
IIS 7.0 及更高版本能够插入和使用自定义开发的托管模块来完成许多不同的任务,并将这些模块用于各种内容。 但是,问题来了:如果模块出现问题或难题,该怎么办? 以前,在出现问题时你会使用 System.Diagnostics 来跟踪事件。 遗憾的是,这些跟踪与 IIS 跟踪完全不同。
IIS 7.0 及更高版本的情况并非如此。 现在,你可以使用 System.Diagnostics.TraceSource(.Net 2.0 的新增功能)向模块代码添加跟踪。 可以将这些跟踪路由到 IIS 跟踪基础结构中,以便使用跟踪的模块(例如“失败请求跟踪”)可以使用这些跟踪。
IIS 团队鼓励使用基本模式来检测代码,例如:
- 与代码中的关键活动相关的启动和停止事件
- 可能导致请求失败的意外情况的警告和错误事件(例如身份验证失败)
- 用于帮助诊断的信息事件和详细事件,例如正在使用的模块配置
本演练涉及以下任务:
- 使用 System.Diagnostics.TraceSource 将跟踪添加到模块
- 配置失败请求跟踪以捕获这些跟踪
- 生成失败条件并查看生成的跟踪
先决条件
在执行本文中的任务之前,请先执行以下步骤。
第 1 步:安装 IIS
首先,必须安装 IIS。 通过浏览到 http://localhost/ 来检查是否安装了 IIS。 如果安装了 IIS,你会看到“构造中”页面。 如果未安装 IIS,请参阅安装 IIS 获取说明。 确保安装以下 IIS 组件:
- ASP(在“万维网服务”=>“应用程序开发功能”=>“ASP”下)
- ASP.Net(在“万维网服务”=>“应用程序开发功能”=>“ASP.Net”下)
- 跟踪(在“万维网服务”=>“运行状态和诊断”=>“跟踪”下)
步骤 2:以管理员身份登录
以管理员帐户或管理员组中的身份登录。
注意
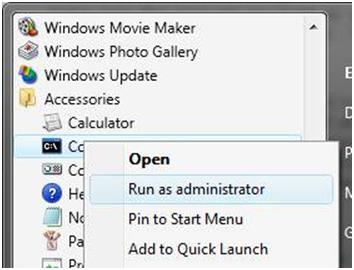
默认情况下,成为管理员组的成员并不能授予你完整的管理员权限。 你必须以管理员身份运行许多应用程序。 右键单击应用程序图标,然后选择“以管理员身份运行”。
步骤 3:备份
在执行本文中的任务之前,请先备份配置。 运行以下操作:
单击“开始”按钮 ->“所有程序”->“附件”-> 右键单击“命令提示符”->“以管理员身份运行”

在该命令提示符下执行以下命令:
%windir%\system32\inetsrv\appcmd add backup
步骤 4:创建示例内容
- 删除
c:\inetpub\wwwroot文件夹中的所有内容。 - 在上面启动的管理员命令提示符下,将附加的代码粘贴到 inetpub\wwwroot 中名为 test.htm 的文件中:
<h2>HOWTO: Adding tracing to modules </h2>
This is a sample page served by the static file handler (native code).
创建和跟踪简单模块
在本部分,你将创建一个要检测的示例模块。
步骤 1:创建简单模块
使用管理员命令提示符,将以下代码复制并粘贴到名为 IIS_MOD_REQDATA.cs 的文件中:
using System;
using System.Collections.Generic;
using System.Text;
using System.Web;

namespace IIS_MOD_REQDATA
{
    public class IIS_MOD_REQDATA : IHttpModule
    {
        public void Init(HttpApplication application)
        {
            application.EndRequest += (new EventHandler(this.Application_EndRequest));
        }

        private void Application_EndRequest(Object source, EventArgs e)
        {
            HttpApplication application = (HttpApplication)source;
            HttpContext context = application.Context;

            // start writing out the request data

            context.Response.Write("<hr>");
            context.Response.Write("<b><font size=2 color=green>REQUEST HEADERS</font></b><br>");
            context.Response.Write("<font size=2>");
            context.Response.Write("METHOD : " + context.Request.HttpMethod + "<br>");
            context.Response.Write("URL : " + context.Request.Url + "<br>");
            context.Response.Write("QUERYSTRING : " + context.Request.QueryString + "<br>");
            context.Response.Write("</font><br>");

            // now response data

            context.Response.Write("<b><font size=2 color=blue>RESPONSE HEADERS</font></b><br>");
            context.Response.Write("<font size=2>");
            context.Response.Write("STATUS CODE : " + context.Response.StatusCode.ToString() + "." + context.Response.SubStatusCode.ToString() + "<br>");
            context.Response.Write("CONTENT TYPE : " + context.Response.ContentType.ToString() + "<br>");
            context.Response.Write("EXPIRES : " + context.Response.Expires.ToString() + "<br>");
            context.Response.Write("</font><br>");

            // set cache policy on response so it's not cached.

            context.Response.DisableKernelCache();
        }

        public void Dispose()
        {
        }
    }
}
步骤 2:将跟踪添加到托管模块
若要将跟踪添加到模块并将其跟踪事件路由到 IIS,请使用 System.Diagnostics.Trace 源。 在 using 语句下添加以下行:
using System.Diagnostics;
必须在代码中创建 TraceSource - 请注意 IIS_MOD_REQDATA 模块声明中的 traceSource 定义:
public class IIS_MOD_REQDATA : IHttpModule
{
    TraceSource tsStatus;
tsStatus 成员在执行 IHttpModule 的 Init() 方法期间初始化:
public void Init(HttpApplication application)
{
    application.EndRequest += (new EventHandler(this.Application_EndRequest));
    // setup traceSource
    tsStatus = new TraceSource("tsStatus");
}
TraceSource 的名称(“tsStatus”)非常重要,因为稍后会在 web.config 文件中引用该名称。 模块现已设置为在需要时发出事件。
若要添加新的跟踪事件,请使用 tsStatus.TraceEvent(<type>, 0, <somestring>) 写出事件。 将建议的开始和结束事件添加到 Application_EndRequest() 方法中:
private void Application_EndRequest(Object source, EventArgs e)
{
    tsStatus.TraceEvent(TraceEventType.Start, 0, "[REQDATA MODULE] START EndRequest");

    // other code

    tsStatus.TraceEvent(TraceEventType.Stop, 0, "[REQDATA MODULE] END EndRequest");
}
请注意不同的<类型> - 支持的类型包括:
- TraceEventType.Start
- TraceEventType.Stop
- TraceEventType.Error
- TraceEventType.Warning
- TraceEventType.Information
- TraceEventType.Verbose
为完整起见,可以从此处复制模块的整个源代码(包括跟踪事件):
using System;
using System.Collections.Generic;
using System.Text;
using System.Web;
using System.Diagnostics;

namespace IIS_MOD_REQDATA
{
    public class IIS_MOD_REQDATA : IHttpModule
    {

        TraceSource tsStatus;

        public void Init(HttpApplication application)
        {
            application.EndRequest += (new EventHandler(this.Application_EndRequest));

            // TRACING

            tsStatus = new TraceSource("tsStatus");
        }

        private void Application_EndRequest(Object source, EventArgs e)
        {
            HttpApplication application = (HttpApplication)source;
            HttpContext context = application.Context;

            tsStatus.TraceEvent(TraceEventType.Start, 0, "[REQDATA MODULE] START EndRequest");

            // start writing out the request data

            context.Response.Write("<hr>");
            context.Response.Write("<b><font size=2 color=green>REQUEST HEADERS</font></b><br>");
            context.Response.Write("<font size=2>");
            context.Response.Write("METHOD : " + context.Request.HttpMethod + "<br>");
            context.Response.Write("URL : " + context.Request.Url + "<br>");
            context.Response.Write("QUERYSTRING : " + context.Request.QueryString + "<br>");
            context.Response.Write("</font><br>");

            tsStatus.TraceEvent(TraceEventType.Verbose, 0, "[REQDATA MODULE] done with Req Data, moving onto Response");

            // now response data

            context.Response.Write("<b><font size=2 color=blue>RESPONSE HEADERS</font></b><br>");
            context.Response.Write("<font size=2>");
            context.Response.Write("STATUS CODE : " + context.Response.StatusCode.ToString() + "." + context.Response.SubStatusCode.ToString() + "<br>");
            context.Response.Write("CONTENT TYPE : " + context.Response.ContentType.ToString() + "<br>");
            context.Response.Write("EXPIRES : " + context.Response.Expires.ToString() + "<br>");
            context.Response.Write("</font><br>");

            if (context.Response.StatusCode > 399)
            {
                tsStatus.TraceEvent(TraceEventType.Warning, 0, "[REQDATA MODULE] error status code detected");
            }

            tsStatus.TraceEvent(TraceEventType.Verbose, 0, "[REQDATA MODULE] done with Response Data");

            // set cache policy on response so it's not cached.

            context.Response.DisableKernelCache();
            tsStatus.TraceEvent(TraceEventType.Verbose, 0, "[REQDATA MODULE] cache setting is (" + context.Response.Cache.ToString() + ")");

            tsStatus.TraceEvent(TraceEventType.Stop, 0, "[REQDATA MODULE] STOP - EndRequest");
        }

        public void Dispose()
        {
        }
    }
}
步骤 3:编译跟踪模块
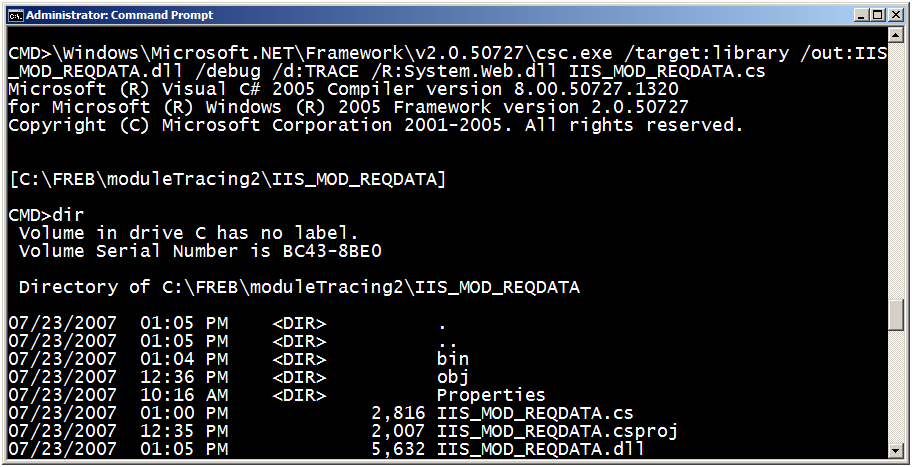
现在编译模块并将其部署。 在管理员命令提示符下运行以下命令:
%systemroot%\Microsoft.NET\Framework\v2.0.50727\csc.exe /target:library /out:IIS_MOD_REQDATA.dll /debug /d:TRACE /R:System.Web.dll IIS_MOD_REQDATA.cs
注意
如果在 64 位系统上运行此命令,请使用 %windir%\microsoft.net\framework64\v2.0.50727\csc.exe 中的 64 位 C# 编译器进行编译
请注意 /debug 和 /d:TRACE 开关的用法。 必须使用这些开关将跟踪事件编译到二进制文件中。 无法使用这些开关进行编译意味着模块中不会出现任何跟踪事件。
编译模块后,部署该模块,并运行初始测试来查看该模块在捕获其跟踪之前是否正常工作。
将模块添加到站点的配置中
本部分介绍如何添加和测试模块。
步骤 1:将模块添加到站点的配置中
- 使用相同的管理员命令提示符,创建一个名为 \inetpub\wwwroot\bin 的目录,然后将 IIS_MOD_REQDATA.dll 复制到该目录。
- 启用模块。 在管理员命令提示符下,键入 start inetmgr 打开 IIS 管理 UI。
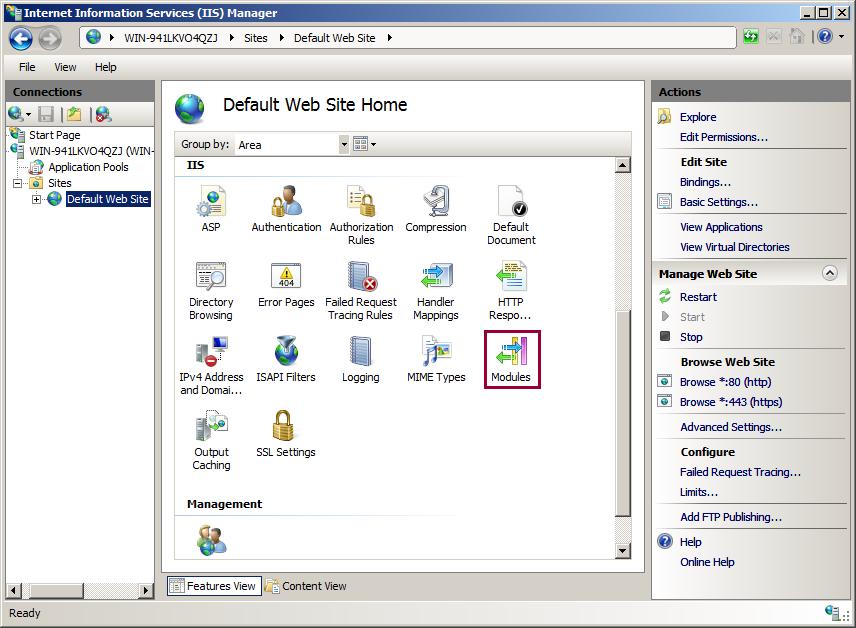
- 在“连接”窗格下,依次展开本地计算机名称和“站点”,然后单击“默认网站”。
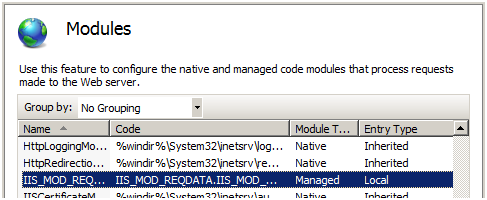
- 在中心窗格中的“IIS”下,双击“模块”:
- 你会看到配置的供此站点使用的较长模块列表。 在 UI 右侧的“操作”下,单击“添加托管模块”:
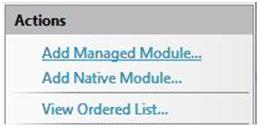
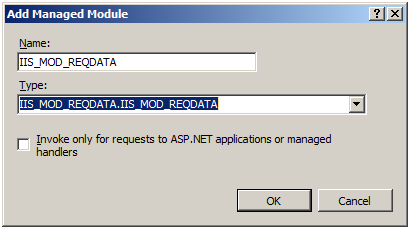
- 在显示的窗口中,将托管模块命名为 IIS_MOD_REQDATA,模块类型为 IIS_MOD_REQDATA.IIS_MOD_REQDATA(从下拉列表框中选择):

- 单击“确定”。 新跟踪的模块现已配置为可供网站使用。


步骤 2:测试模块
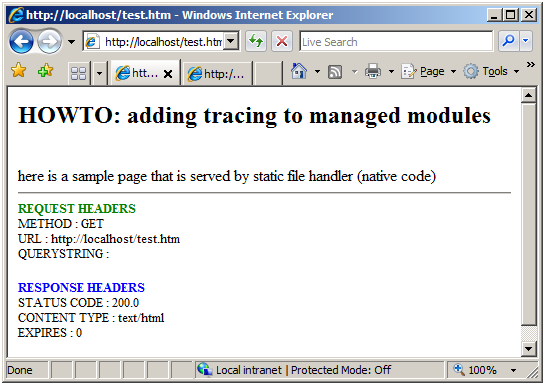
打开 Internet Explorer 并浏览到 http://localhost/test.htm 来测试模块。 你将看到以下窗口:
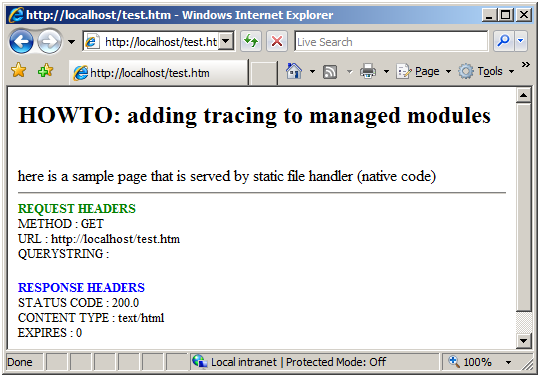
“REQUEST HEADERS”和“RESPONSE HEADERS”内容来自我们的模块,这表示该模块正常工作。
将事件路由到 IIS
此任务将模块的 TraceSource 挂载到 IIS 跟踪,以便通过 IIS 发出其事件,然后配置“失败请求跟踪”以捕获这些跟踪事件。
步骤 1:启用模块 TraceSource 并将其事件路由到 IIS
模块已更新为包含跟踪事件。 配置 System.Diagnostics 和 IIS 以捕获这些跟踪事件,并将其路由到 IIS 的“失败请求跟踪”模块。 为此,请配置 web.config 文件中的 <system.diagnostics> 部分,以设置 TraceSource 并相应地路由其事件。
使用管理员命令提示符导航到
c:\inetpub\wwwroot,然后使用记事本编辑 web.config 文件。必须完成配置的 3 个部分,才能将模块发出的事件路由到 IIS 的跟踪基础结构:
- 将 IIS 事件 traceListener 定义为共享侦听器
- 定义一个开关以启用所有事件
- 定义跟踪源,附加我们定义的开关并为源定义跟踪侦听器。
IIS 提供了一个新的 System.Diagnostics.TraceListener,用于将 TraceSource 事件路由到 IIS 的跟踪基础结构。 还必须在 web.config 文件中定义此提供程序。
按名称 (tsStatus) 定义 traceSource,并将其连接到 DefaultSwitch 和 IisTraceListener。
将此 <system.Diagnostics> 部分复制并粘贴到 web.config 文件中(在
<system.webServer>部分之后)。<system.diagnostics> <sharedListeners> <add name="IisTraceListener" type="System.Web.IisTraceListener, System.Web, Version=2.0.0.0, Culture=neutral, PublicKeyToken=b03f5f7f11d50a3a" /> </sharedListeners> <switches> <add name="DefaultSwitch" value="All" /> </switches> <sources> <source name="tsStatus" switchName="DefaultSwitch"> <listeners> <add name="IisTraceListener" type="System.Web.IisTraceListener, System.Web, Version=2.0.0.0, Culture=neutral, PublicKeyToken=b03f5f7f11d50a3a" /> </listeners> </source> </sources> </system.diagnostics>
tsStatus traceSource 连接到 IIS7TraceListener,后者将事件发送到 IIS 的跟踪基础结构。 继续执行下一步,将这些事件连接到“失败请求跟踪”提供程序。
步骤 2:启用“失败请求跟踪”以捕获模块跟踪事件
将这些诊断事件发送到 IIS 的跟踪基础结构时,它们会映射到 ASP.net 提供程序以及该提供程序上的模块标志。 其详细程度取决于使用的 TraceEventType。 若要配置“失败请求跟踪”以拾取这些事件,请执行以下操作:
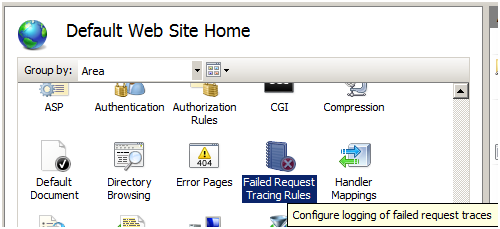
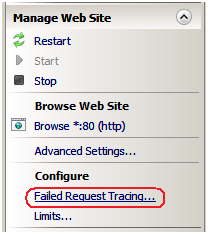
在管理员命令提示符下,键入 start inetmgr。 在“连接”面板中,依次展开计算机名称和“站点”文件夹,然后单击“默认网站”。 在“操作”窗格的右侧,单击“配置”下的“失败请求跟踪...”链接:

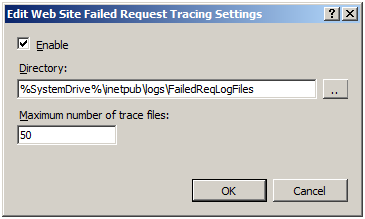
在下一个对话框中,配置以下设置:

选中“启用”复选框。 保留其他设置的默认值。 单击 “确定” 继续。
确认已启用“失败请求跟踪日志记录”后,我们必须配置失败定义。 返回 IIS 管理器,在“IIS”下,双击“失败请求跟踪规则”
在“操作”窗格中,单击“添加...”。 这会启动“添加失败请求跟踪规则”向导。
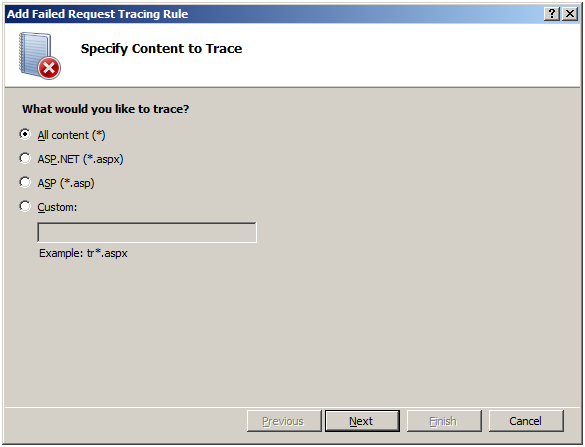
在“指定要跟踪的内容”页面上,为要跟踪的内容选择“所有内容(*)”选项。 单击 “下一步” 。

在“定义跟踪条件”屏幕中,选中“状态代码”复选框并输入“200”作为要跟踪的状态代码。
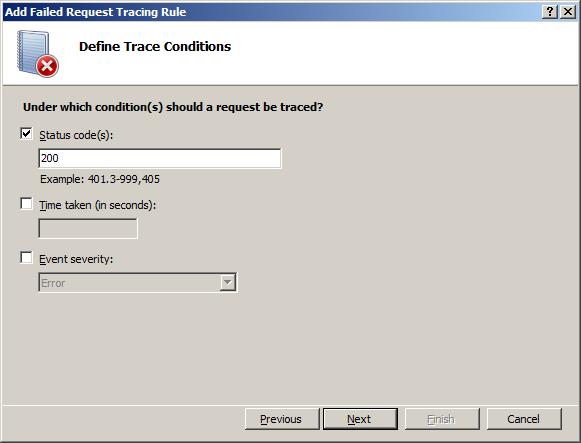
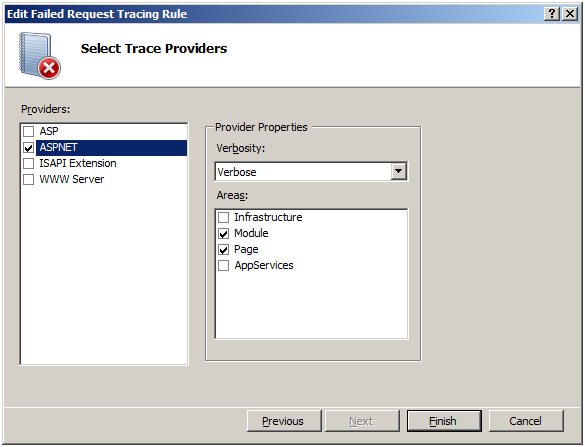
单击 “下一步” 。 此时会显示“选择跟踪提供程序”页面。 选中“区域”下的“ASPNET”复选框以及“模块”和“页面”复选框。 在“详细程度”下,选择“详细”。

注意
由于 Server Beta 3 内部版本中的 bug,只有同时选择了“模块”和“页面”区域,才能捕获模块跟踪。 在 Server Beta 3 之后的版本中,只需选择“模块”即可收集这些事件。
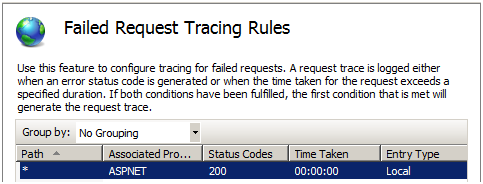
单击“完成”。 你会看到默认网站的以下定义:


测试并查看结果
在此任务中,我们将生成失败请求并查看生成的跟踪日志。 请记住,我们已将 IIS 配置为捕获失败并返回错误 200 的 http://localhost/* 请求的跟踪日志。 若要验证此操作是否有效,请执行以下操作:
- 打开新的 Internet Explorer 窗口。 键入地址
http://localhost/test.htm。 同样,你会看到以下内容:

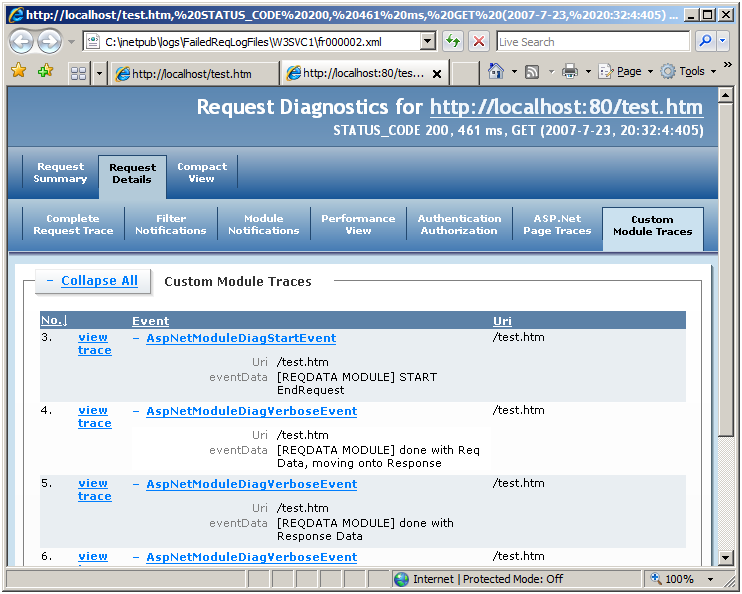
- 若要验证模块是否已生成捕获的跟踪,请使用管理员提升权限的 Internet Explorer 窗口并按 CTRL-O,然后导航到
c:\inetpub\logs\FailedReqLogFiles\W3SVC1。 在显示“HTML 文件”的下拉列表框中,选择“所有文件”。 - 选择最新的 fr######.xml 文件(当天的日期),然后单击“打开”。 你将看到事件:

总结
你已将新的跟踪事件添加到托管模块,编译并部署了该模块,配置了 System.Diagnostics 以将其事件路由到 IIS 的跟踪基础结构,最后,配置了 IIS 的“失败请求跟踪”功能以捕获其事件。 现在,你可以轻松地将新事件添加到模块,然后重新编译模块并将其部署到 \bin 目录。 使用“失败请求跟踪”可以看到事件的结果。
请记住,使用 System.Diagnostics.TraceSource 仍然允许你使用模块及其下层跟踪事件,前提是将其挂接到不同的跟踪侦听器。