在 iOS SDK 中將線條圖層新增至地圖 (預覽)
注意
Azure 地圖服務 iOS SDK 淘汰
適用於 iOS 的 Azure 地圖服務 原生 SDK 現在已被取代,將於 3/31/25 淘汰。 若要避免服務中斷,請透過 3/31/25 移轉至 Azure 地圖服務 Web SDK。 如需詳細資訊,請參閱 Azure 地圖服務 iOS SDK 移轉指南。
線條圖層可用來將 LineString 和 MultiLineString 功能轉譯為地圖上的路徑或路線。 線條圖層也可用來呈現 Polygon 和 MultiPolygon 功能的外框。 資料來源會連線到線條圖層,以為其提供要呈現的資料。
提示
根據預設,線條圖層會轉譯資料來源中的多邊形座標及線條。 若要限制圖層只呈現 LineString 幾何特徵,請將圖層的 filter 選項設定為 NSPredicate(format: "%@ == \"LineString\"", NSExpression.geometryTypeAZMVariable)。 如果您要同時包含 MultiLineString 功能, 請使用 NSCompoundPredicate。
必要條件
請務必完成快速入門:建立 iOS 應用程式文件中的步驟。 本文中的程式碼區塊可以插入 ViewController 的 viewDidLoad 函式中。
新增線條圖層
下列程式碼示範如何建立線條。 將這行程式碼新增至資料來源,然後使用 LineLayer 類別,以線條圖層呈現。
// Create a data source and add it to the map.
let source = DataSource()
map.sources.add(source)

// Create a list of points.
let points = [
    CLLocationCoordinate2D(latitude: 40.74327, longitude: -73.97234),
    CLLocationCoordinate2D(latitude: 40.75680, longitude: -74.00442)
]

// Create a Polyline geometry and add it to the data source.
source.add(geometry: Polyline(points))

// Create a line layer and add it to the map.
let layer = LineLayer(source: source, options: [
    .strokeWidth(5),
    .strokeColor(.blue)
])
map.layers.addLayer(layer)
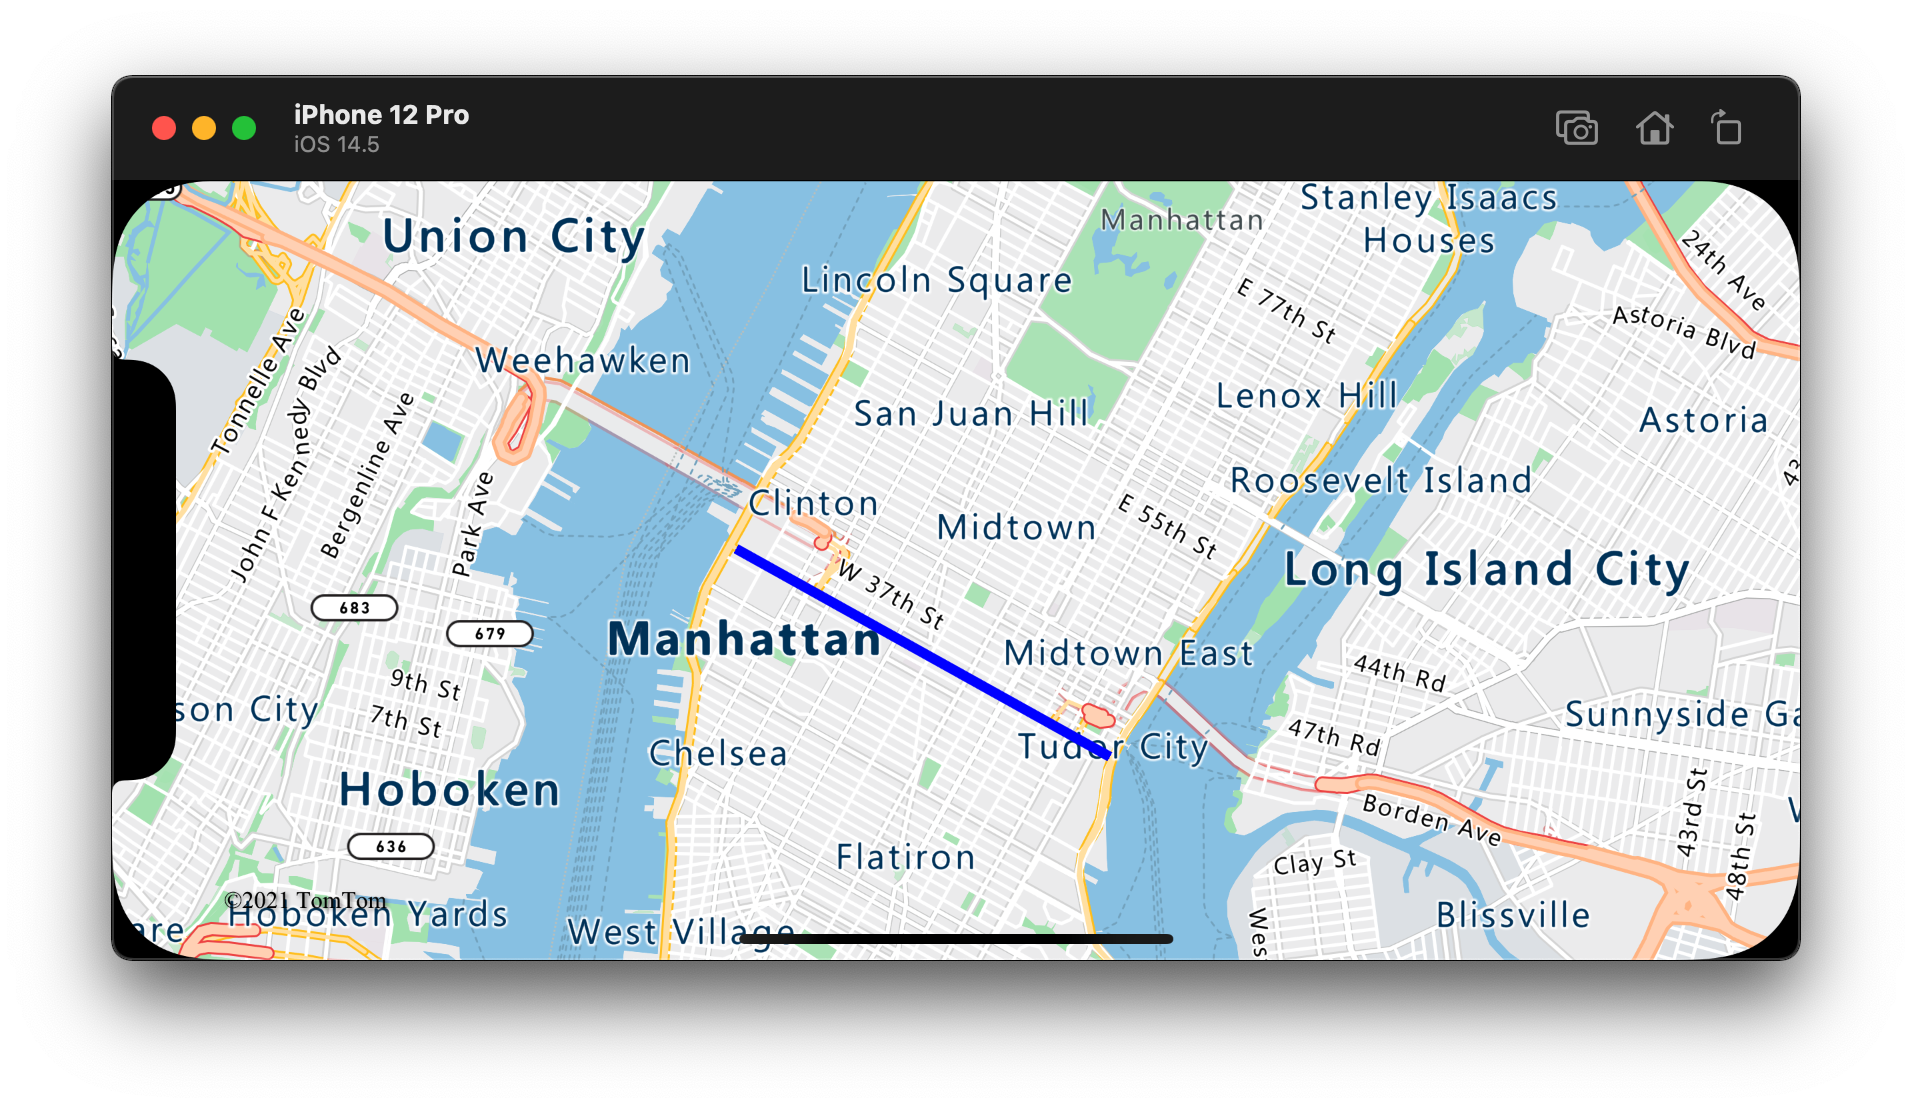
下列螢幕擷取畫面顯示上述程式碼在線條圖層中呈現一條線。
資料驅動的線條樣式
下列程式碼建立兩個線條特徵,並將速度限制值當作屬性新增至每一條線。 線條圖層使用資料驅動的樣式表達式,根據速度限制值將線條著色。 由於路線數據沿著道路重疊,下列程式代碼會在標籤圖層下方新增線條圖層,讓道路標籤保持可見。
// Create a data source and add it to the map.
let source = DataSource()
map.sources.add(source)

// Create a line feature.
let feature = Feature(Polyline([
    CLLocationCoordinate2D(latitude: 47.704033, longitude: -122.131821),
    CLLocationCoordinate2D(latitude: 47.703678, longitude: -122.099919)
]))

// Add a property to the feature.
feature.addProperty("speedLimitMph", value: 35)

// Add the feature to the data source.
source.add(feature: feature)

// Create a second line feature.
let feature2 = Feature(Polyline([
    CLLocationCoordinate2D(latitude: 47.708265, longitude: -122.126662),
    CLLocationCoordinate2D(latitude: 47.703980, longitude: -122.126877)
]))

// Add a property to the second feature.
feature2.addProperty("speedLimitMph", value: 15)

// Add the second feature to the data source.
source.add(feature: feature2)

// Create a line layer and add it to the map.
let stops: [Int: UIColor] = [
    0: .green,
    30: .yellow,
    60: .red
]
let colorExpression = NSExpression(
    forAZMInterpolating: NSExpression(forKeyPath: "speedLimitMph"),
    curveType: .linear,
    parameters: nil,
    stops: NSExpression(forConstantValue: stops)
)

let layer = LineLayer(source: source, options: [
    .strokeWidth(5),
    .strokeColor(from: colorExpression)
])

map.layers.insertLayer(layer, below: "labels")
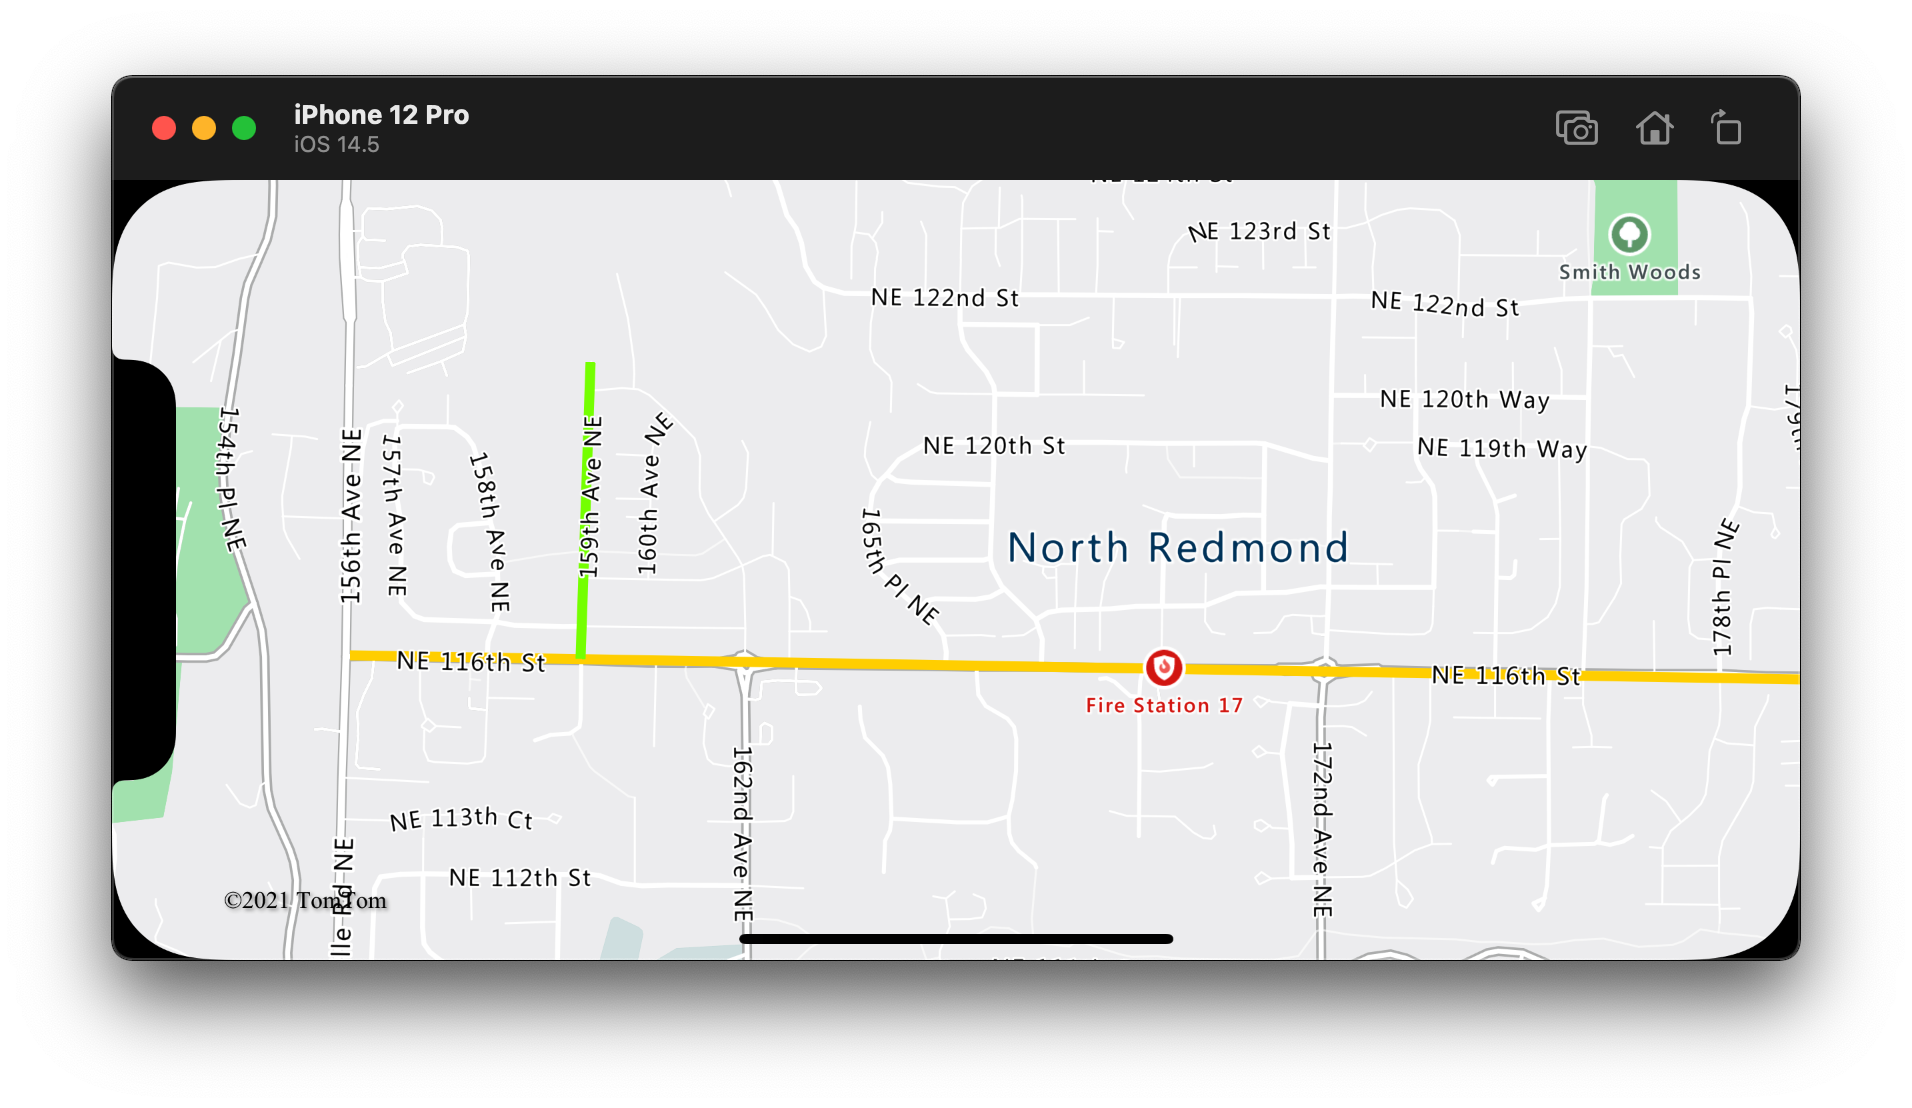
下列螢幕快照顯示上述程式代碼,此程式碼會根據線條特徵中的屬性,以從數據驅動樣式運算式擷取其色彩,呈現一行圖層中的兩行。
將筆觸漸層新增至線條
您可為線條套用單一筆觸色彩。 您也可使用色彩漸層填滿線條來顯示從一個線段轉換到下一個線段。 例如,您可使用線條漸層表示經過一段時間和距離的變更,或連接線上物件的不同溫度。 為了將此特徵套用至線條,資料來源必須將 lineMetrics 選項設定為 true,這樣色彩漸層運算式就可以傳遞至線條的 strokeGradient 選項。 筆觸漸層運算式必須參考向運算式公開計算結果行計量的 NSExpression.lineProgressAZMVariable 日期運算式。
// Create a data source and add it to the map.
let source = DataSource(options: [
    // Enable line metrics on the data source. This is needed to enable support for strokeGradient.
    .lineMetrics(true)
])
map.sources.add(source)

// Create a line and add it to the data source.
source.add(geometry: Polyline([
    CLLocationCoordinate2D(latitude: 47.63208, longitude: -122.18822),
    CLLocationCoordinate2D(latitude: 47.63196, longitude: -122.18204),
    CLLocationCoordinate2D(latitude: 47.62976, longitude: -122.17243),
    CLLocationCoordinate2D(latitude: 47.63023, longitude: -122.16419),
    CLLocationCoordinate2D(latitude: 47.62942, longitude: -122.15852),
    CLLocationCoordinate2D(latitude: 47.62988, longitude: -122.15183),
    CLLocationCoordinate2D(latitude: 47.63451, longitude: -122.14256),
    CLLocationCoordinate2D(latitude: 47.64041, longitude: -122.13483),
    CLLocationCoordinate2D(latitude: 47.64422, longitude: -122.13466),
    CLLocationCoordinate2D(latitude: 47.65440, longitude: -122.13844),
    CLLocationCoordinate2D(latitude: 47.66515, longitude: -122.13277),
    CLLocationCoordinate2D(latitude: 47.66712, longitude: -122.12779),
    CLLocationCoordinate2D(latitude: 47.66712, longitude: -122.11595),
    CLLocationCoordinate2D(latitude: 47.66735, longitude: -122.11063),
    CLLocationCoordinate2D(latitude: 47.67035, longitude: -122.10668),
    CLLocationCoordinate2D(latitude: 47.67498, longitude: -122.10565)
]))

// Create a line layer and add it to the map.
let stops: [Double: UIColor] = [
    0: .blue,
    0.1: UIColor(red: 0.25, green: 0.41, blue: 1, alpha: 1), // Royal Blue
    0.3: .cyan,
    0.5: UIColor(red: 0, green: 1, blue: 0, alpha: 1), // Lime
    0.7: .yellow,
    1: .red
]
let colorExpression = NSExpression(
    forAZMInterpolating: NSExpression.lineProgressAZMVariable,
    curveType: .linear,
    parameters: nil,
    stops: NSExpression(forConstantValue: stops)
)

map.layers.addLayer(LineLayer(source: source, options: [
    .strokeWidth(5),
    .strokeGradient(from: colorExpression)
]))
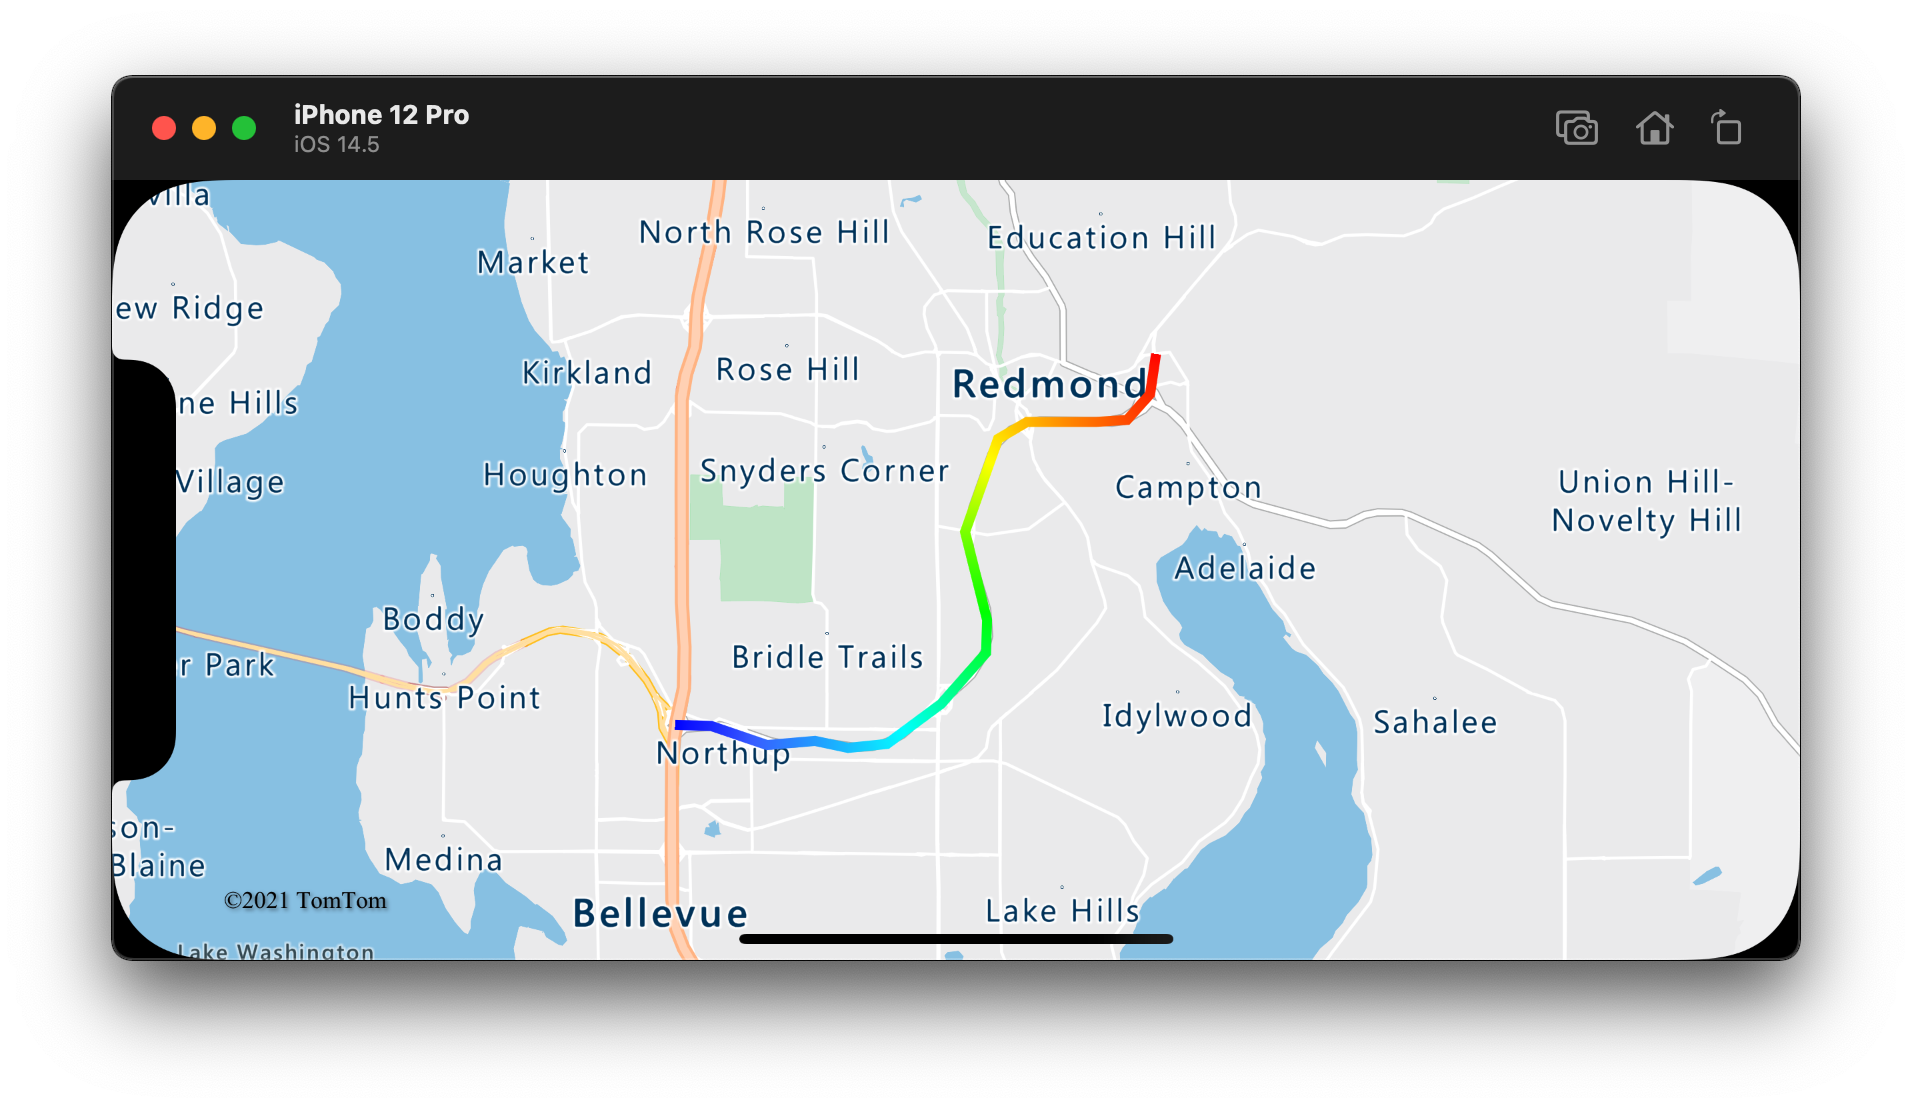
下列螢幕擷取畫面顯示上述程式碼以漸層筆觸色彩呈現一條線。
沿著線條新增符號
這個範例會示範如何沿著地圖上的線條新增箭號圖示。 使用符號圖層時,請將 symbolPlacement 選項設定為 .line。 此選項會沿著線條轉譯符號,並旋轉圖示(0 度 = 右)。
// Create a data source and add it to the map.
let source = DataSource()
map.sources.add(source)

// Load a image of an arrow into the map image sprite and call it "arrow-icon".
map.images.add(UIImage(named: "purple-arrow-right")!, withID: "arrow-icon")

// Create a line and add it to the data source.
source.add(geometry: Polyline([
    CLLocationCoordinate2D(latitude: 47.63208, longitude: -122.18822),
    CLLocationCoordinate2D(latitude: 47.63196, longitude: -122.18204),
    CLLocationCoordinate2D(latitude: 47.62976, longitude: -122.17243),
    CLLocationCoordinate2D(latitude: 47.63023, longitude: -122.16419),
    CLLocationCoordinate2D(latitude: 47.62942, longitude: -122.15852),
    CLLocationCoordinate2D(latitude: 47.62988, longitude: -122.15183),
    CLLocationCoordinate2D(latitude: 47.63451, longitude: -122.14256),
    CLLocationCoordinate2D(latitude: 47.64041, longitude: -122.13483),
    CLLocationCoordinate2D(latitude: 47.64422, longitude: -122.13466),
    CLLocationCoordinate2D(latitude: 47.65440, longitude: -122.13844),
    CLLocationCoordinate2D(latitude: 47.66515, longitude: -122.13277),
    CLLocationCoordinate2D(latitude: 47.66712, longitude: -122.12779),
    CLLocationCoordinate2D(latitude: 47.66712, longitude: -122.11595),
    CLLocationCoordinate2D(latitude: 47.66735, longitude: -122.11063),
    CLLocationCoordinate2D(latitude: 47.67035, longitude: -122.10668),
    CLLocationCoordinate2D(latitude: 47.67498, longitude: -122.10565)
]))

// Create a line layer and add it to the map.
map.layers.addLayer(LineLayer(source: source, options: [
    .strokeWidth(5),
    .strokeColor(.purple)
]))

// Create a symbol layer and add it to the map.
map.layers.addLayer(SymbolLayer(source: source, options: [
    // Space symbols out along line.
    .symbolPlacement(.line),

    // Spread the symbols out 100 points apart.
    .symbolSpacing(100),

    // Use the arrow icon as the symbol.
    .iconImage("arrow-icon"),

    // Allow icons to overlap so that they aren't hidden if they collide with other map elements.
    .iconAllowOverlap(true),

    // Center the symbol icon.
    .iconAnchor(.center),

    // Scale the icon size.
    .iconSize(0.8)
]))
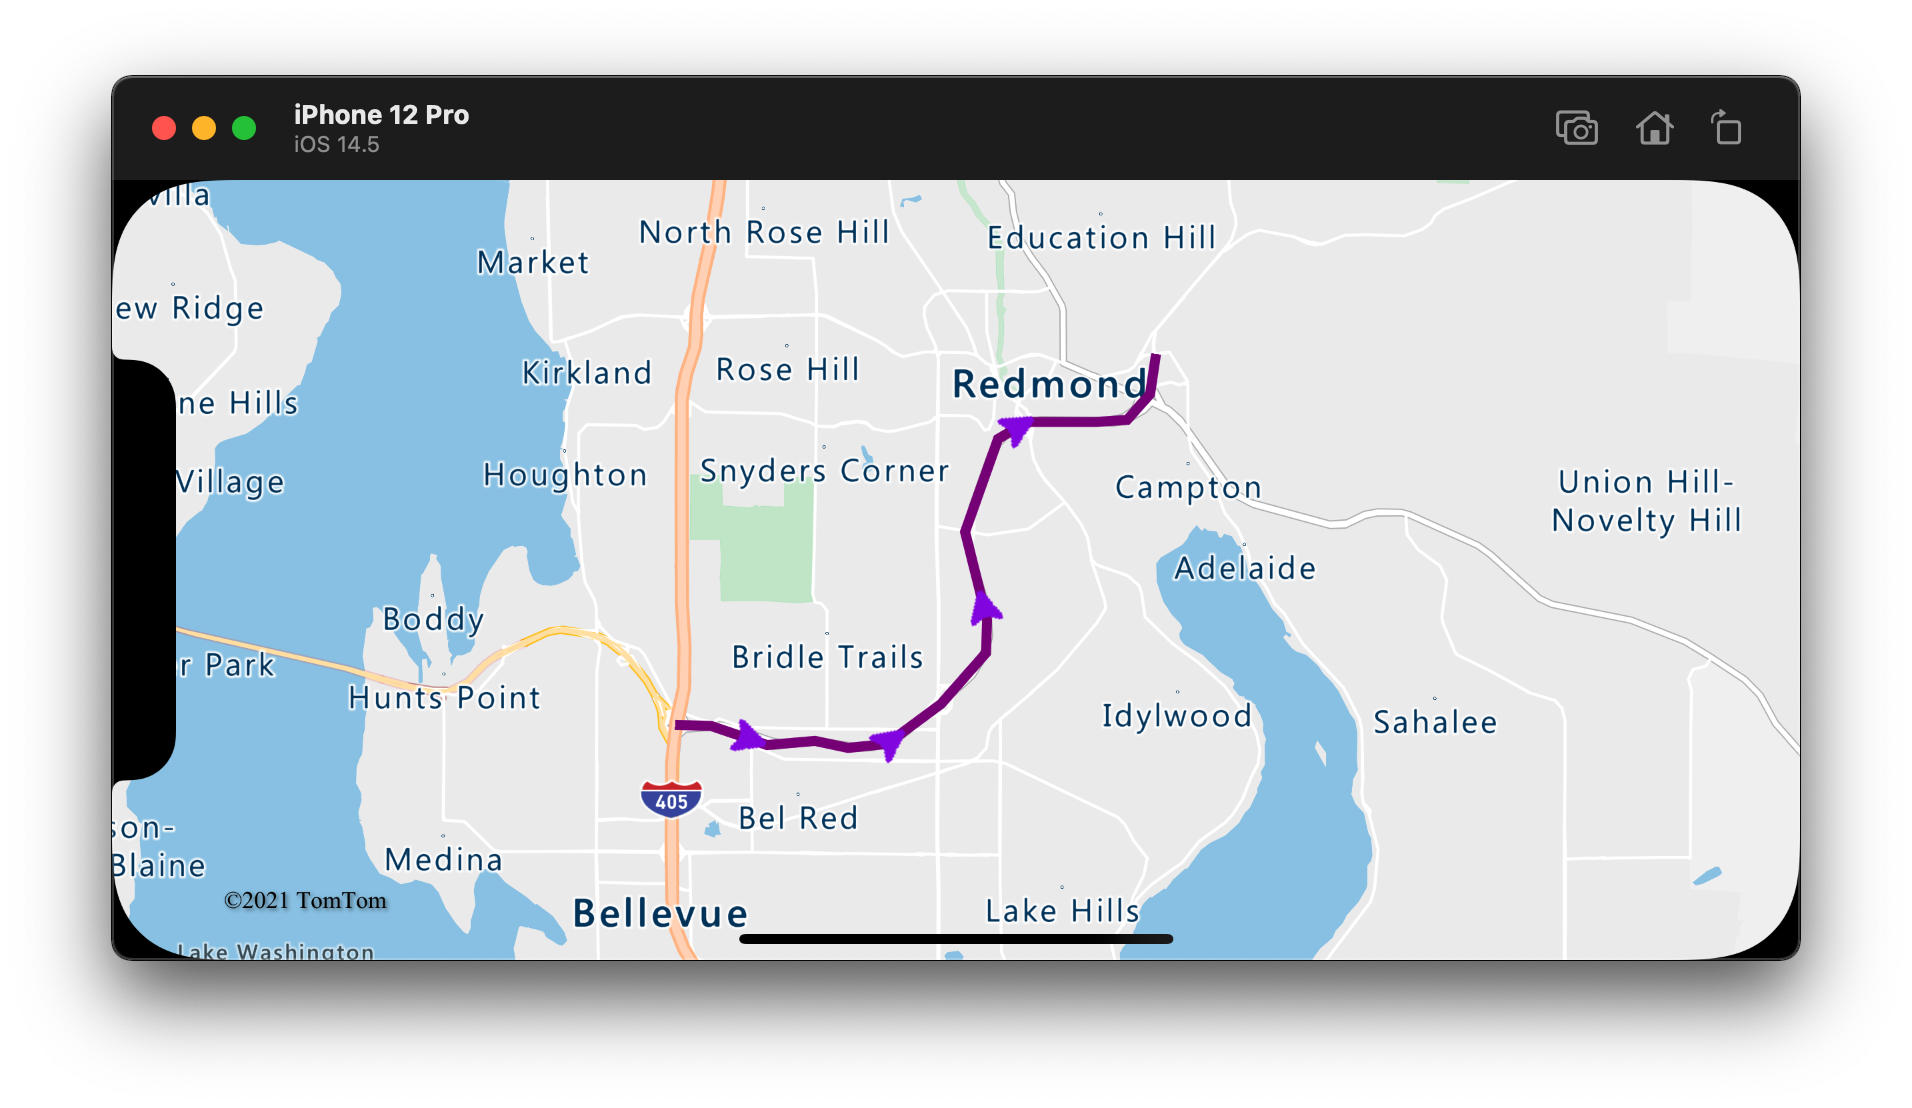
在此範例中,下列影像已載入應用程式的 assets 資料夾。
purple-arrow-right.png |
下列螢幕擷取畫面顯示上述程式碼在一條線上沿途出現箭號圖示。
其他資訊
請參閱下列文章,以取得更多可新增至地圖的程式碼範例:
意見反應
即將登場:在 2024 年,我們將逐步淘汰 GitHub 問題作為內容的意見反應機制,並將它取代為新的意見反應系統。 如需詳細資訊,請參閱:https://aka.ms/ContentUserFeedback。
提交並檢視相關的意見反應