Azure 地圖服務 Web SDK 會將資料儲存在資料來源中。 使用資料來源可將查詢和轉譯的資料作業最佳化。 目前,資料來源有兩種不同的類型:
- GeoJSON 來源:在本機管理 GeoJSON 格式的原始位置資料。 適用於小型到中型資料集 (數十萬個圖形)。
- 向量圖格來源:根據地圖底圖系統,為目前的地圖檢視載入格式化為向量圖格的資料。 適合用於大型資料集 (數百萬或數十億個圖形)。
GeoJSON 資料來源
以 GeoJSON 為基礎的資料來源會使用 DataSource 類別在本機載入和儲存資料。 您可以手動建立 GeoJSON 資料,或使用 atlas.data 命名空間中的協助程式類別來建立。
DataSource 類別提供匯入本機或遠端 GeoJSON 檔案的函式。 遠端 GeoJSON 檔案必須裝載在已啟用 COR 的端點上。
DataSource 類別提供叢集點資料的功能。 此外,可以運用 DataSource 類別輕鬆新增、移除及更新資料。 下列程式碼說明如何在 Azure 地圖服務中建立 GeoJSON 資料。
//Create raw GeoJSON object.
var rawGeoJson = {
     "type": "Feature",
     "geometry": {
         "type": "Point",
         "coordinates": [-100, 45]
     },
     "properties": {
         "custom-property": "value"
     }
};

//Create GeoJSON using helper classes (less error prone and less typing).
var geoJsonClass = new atlas.data.Feature(new atlas.data.Point([-100, 45]), {
    "custom-property": "value"
});
在資料建立後,即可透過 map.sources 屬性 (即 SourceManager) 將資料來源新增至地圖。 下列程式碼說明如何建立 DataSource,並將其新增至地圖。
//Create a data source and add it to the map.
var source = new atlas.source.DataSource();
map.sources.add(source);
下列程式碼顯示將 GeoJSON 資料新增至 DataSource 的不同方式。
//GeoJsonData in the following code can be a single or array of GeoJSON features or geometries, a GeoJSON feature collection, or a single or array of atlas.Shape objects.

//Add geoJSON object to data source.
source.add(geoJsonData);

//Load geoJSON data from URL. URL should be on a CORs enabled endpoint.
source.importDataFromUrl(geoJsonUrl);

//Overwrite all data in data source.
source.setShapes(geoJsonData);
提示
假設您想要覆寫 DataSource 中的所有資料。 如果您調用 clear 和 add 函式,地圖可能會重繪兩次,這可能會導致一些延遲。 請改用 setShapes 函式,此函式會移除和取代資料來源中的所有資料,並只觸發地圖的單一重新轉譯。
向量圖格來源
向量圖格來源說明如何存取向量圖格圖層。 使用 VectorTileSource 類別將向量圖格來源具現化。 向量圖格圖層類似於圖格圖層,但兩者並不相同。 圖格圖層是點陣影像。 向量圖格圖層是 PBF 格式的壓縮檔案。 這個壓縮的檔案包含向量地圖資料,以及一或多個圖層。 此檔案可根據每個圖層的樣式,在用戶端上轉譯及設定樣式。 向量圖格中的資料包含點、線條和多邊形形式的地理特徵。 使用向量圖格圖層 (而非點陣圖格圖層) 有數個優點:
- 向量圖格的檔案大小通常比對等的點陣圖格小很多。 因此,會使用較少頻寬。 這意味著延遲較低、地圖效能更快,使用者體驗更加理想。
- 向量圖格會在用戶端上轉譯,因此會根據其顯示所在裝置的解析度進行調整。 因此,轉譯的地圖呈現得更加清晰,文字標籤清晰可見。
- 變更向量地圖中的資料樣式時不需要再次下載資料,因為新的樣式可套用在用戶端上。 相對地,變更點陣圖格圖層的樣式時通常需要從伺服器載入圖格,然後再套用新樣式。
- 由於資料是以向量形式傳遞的,準備資料時所需的伺服器端處理會比較少。 因此,較新的資料可更快成為可用資料。
Azure 地圖服務遵循 Mapbox 向量圖格規格,這是一個開放式標準。 Azure 地圖服務提供下列向量圖格服務作為平台的一部分:
提示
使用 Azure 地圖轉譯服務提供的向量或點陣影像圖磚搭配 Web SDK 時,您可以將 atlas.microsoft.com 替換為占位符 {azMapsDomain}。 此預留位置將會取代為地圖所使用的相同網域,並且會自動附加相同的驗證詳細資料。 這可大幅簡化使用 Microsoft Entra 驗證時對轉譯服務進行驗證的程序。
若要在地圖上顯示向量圖格來源的資料,請將來源連線至其中一個資料轉譯圖層。 所有使用向量來源的圖層,都必須在選項中指定 sourceLayer 值。 下列程式碼會將 Azure 地圖服務的交通流量向量圖格服務載入為向量圖格來源,然後使用線條圖層將其顯示在地圖上。 此向量圖格來源在來源圖層中有單一資料集,名為「交通流量」。 此資料集中的線條資料具有名為 traffic_level 的屬性,可在此程式碼中用來選取色彩和調整線條的大小。
//Create a vector tile source and add it to the map.
var source = new atlas.source.VectorTileSource(null, {
    tiles: ['https://{azMapsDomain}/traffic/flow/tile/pbf?api-version=1.0&style=relative&zoom={z}&x={x}&y={y}'],
    maxZoom: 22
});
map.sources.add(source);

//Create a layer for traffic flow lines.
var flowLayer = new atlas.layer.LineLayer(source, null, {
    //The name of the data layer within the data source to pass into this rendering layer.
    sourceLayer: 'Traffic flow',

    //Color the roads based on the traffic_level property.
    strokeColor: [
        'interpolate',
        ['linear'],
        ['get', 'traffic_level'],
        0, 'red',
        0.33, 'orange',
        0.66, 'green'
    ],

    //Scale the width of roads based on the traffic_level property.
        strokeWidth: [
        'interpolate',
        ['linear'],
        ['get', 'traffic_level'],
        0, 6,
        1, 1
    ]
});

//Add the traffic flow layer below the labels to make the map clearer.
map.layers.add(flowLayer, 'labels');
如需完整工作範例,示範如何在地圖上顯示向量圖格來源的資料,請參閱 Azure 地圖服務範例中的向量圖格線條圖層。 如需此範例的原始程式碼,請參閱向量圖格線條圖層範例程式碼。
將資料來源連線至圖層
資料會透過呈現層在地圖上呈現。 一或多個轉譯圖層可參考單一資料來源。 下列轉譯圖層需要資料來源:
- 泡泡圖層 - 將點資料轉譯為地圖上的縮放圓圈。
- 符號圖層 - 將點資料轉譯為圖示或文字。
- 熱度圖圖層 - 將點資料轉譯為密度熱度圖。
- 線條圖層 - 轉譯線條,或轉譯多邊形的外框。
- 多邊形圖層 - 以單色或影像圖樣填滿多邊形的區域。
下列程式碼說明如何建立資料來源、將其新增至地圖,並將其連線至泡泡圖層。 然後,將 GeoJSON 點資料從遠端位置匯入資料來源中。
//Create a data source and add it to the map.
var source = new atlas.source.DataSource();
map.sources.add(source);

//Create a layer that defines how to render points in the data source and add it to the map.
map.layers.add(new atlas.layer.BubbleLayer(source));

//Load the earthquake data.
source.importDataFromUrl('https://earthquake.usgs.gov/earthquakes/feed/v1.0/summary/significant_month.geojson');
還有其他不會連線至這些資料來源的轉譯圖層,但這類圖層會直接載入資料以進行轉譯。
一個具有多個圖層的資料來源
多個圖層可連線至單一資料來源。 在許多不同的情況下,此選項都有其效益。 例如,請考量使用者繪製了多邊形的案例。 當使用者將點新增至地圖時,我們應繪製並填充多邊形區域。 對多邊形的外框新增樣式線條,使用者在繪製時就更能清楚看到多邊形的邊緣。 為了方便編輯多邊形中的個別位置,我們可以在每個位置上方新增一個控點,例如圖釘或標記。
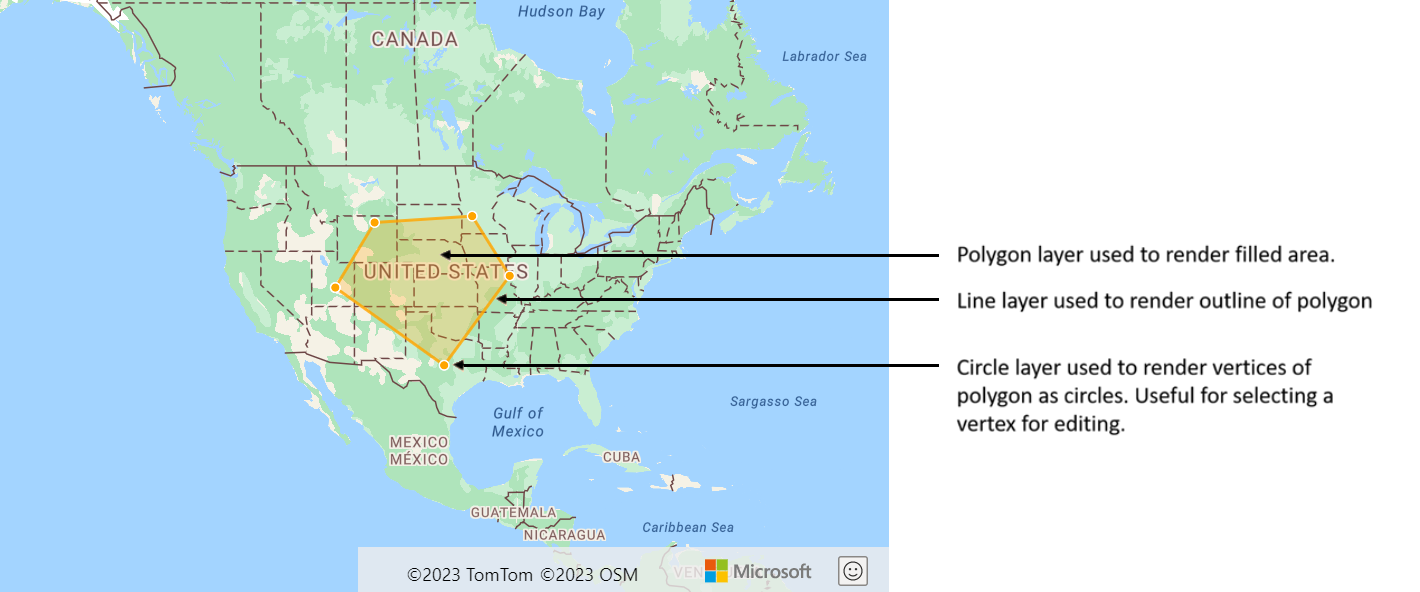
在大部分的地圖平台中,您都需要多邊形物件、線條物件,以及多邊形中各個位置的圖釘。 當多邊形經過修改時,您必須手動更新線條和標記,這樣很快就會變得複雜。
透過 Azure 地圖服務,您只需在資料來源中有一個多邊形即可,如下列程式碼所示。
//Create a data source and add it to the map.
var source = new atlas.source.DataSource();
map.sources.add(source);

//Create a polygon and add it to the data source.
source.add(new atlas.data.Feature(
        new atlas.data.Polygon([[[/* Coordinates for polygon */]]]));

//Create a polygon layer to render the filled in area of the polygon.
var polygonLayer = new atlas.layer.PolygonLayer(source, 'myPolygonLayer', {
     fillColor: 'rgba(255,165,0,0.2)'
});

//Create a line layer for greater control of rendering the outline of the polygon.
var lineLayer = new atlas.layer.LineLayer(source, 'myLineLayer', {
     strokeColor: 'orange',
     strokeWidth: 2
});

//Create a bubble layer to render the vertices of the polygon as scaled circles.
var bubbleLayer = new atlas.layer.BubbleLayer(source, 'myBubbleLayer', {
     color: 'orange',
     radius: 5,
     strokeColor: 'white',
     strokeWidth: 2
});

//Add all layers to the map.
map.layers.add([polygonLayer, lineLayer, bubbleLayer]);
提示
使用 map.layers.add 函式將圖層新增至地圖時,可以將現有圖層的識別碼或執行個體傳入作為第二個參數。 這會指示地圖插入在現有圖層底下新增的新圖層。 除了傳入圖層識別碼以外,此方法也支援下列值。
-
"labels"- 在地圖標籤圖層底下插入新圖層。 -
"transit"- 在地圖道路和交通圖層底下插入新圖層。
下一步
深入了解本文使用的類別和方法:
請參閱下列文章,以取得更多可新增至地圖的程式碼範例: