將符號連接至資料來源,並用於轉譯指定點的圖示或文字。
使用 WebGL 來呈現符號圖層。 使用符號圖層在地圖上呈現大型點集合。 相較於 HTML 標記,符號圖層會在地圖上呈現大量點資料,且效能更佳。 不過,符號圖層不支援以傳統 CSS 和 HTML 元素設定樣式。
秘訣
根據預設,符號圖層會轉譯資料來源中所有幾何圖形的座標。 若要限制圖層,使其只呈現點幾何功能,請將圖層的 filter 屬性設定為 ['==', ['geometry-type'], 'Point'],如果需要可以設定為 ['any', ['==', ['geometry-type'], 'Point'], ['==', ['geometry-type'], 'MultiPoint']],則也能包含 MultiPoint 功能。
地圖影像原件管理員會載入符號圖層所使用的自訂影像。 其支援下列影像格式:
- JPEG
- PNG
- SVG
- BMP
- GIF (無動畫)
新增符號圖層
您必須先執行幾個步驟,才能將符號圖層新增至地圖。 首先,建立資料來源,並將其新增至地圖。 建立符號圖層。 然後,將資料來源傳入符號圖層,以從資料來源擷取資料。 最後,將資料新增至資料來源,以便有資料可以呈現。
下列程式碼示範載入地圖之後應該新增至地圖的內容。 此範例會使用符號圖層在地圖上呈現一個單點。
//Create a data source and add it to the map.
var dataSource = new atlas.source.DataSource();
map.sources.add(dataSource);

//Create a symbol layer to render icons and/or text at points on the map.
var layer = new atlas.layer.SymbolLayer(dataSource);

//Add the layer to the map.
map.layers.add(layer);

//Create a point and add it to the data source.
dataSource.add(new atlas.data.Point([0, 0]));
有四種不同類型的點資料可以新增至地圖:
- GeoJSON Point 幾何 - 此物件只包含點的座標,僅此而已。
atlas.data.Point協助程式類別可用於輕鬆地建立這些物件。 - GeoJSON MultiPoint 幾何 - 此物件包含多個點的座標,僅此而已。
atlas.data.MultiPoint協助程式類別可用於輕鬆地建立這些物件。 - GeoJSON 特徵 - 此物件包含任何 GeoJSON 幾何以及一組屬性,其中包含與幾何相關聯的中繼資料。
atlas.data.Feature協助程式類別可用於輕鬆地建立這些物件。 atlas.Shape類別類似於 GeoJSON 特徵。 兩者皆由 GeoJSON 幾何以及一組屬性 (其中包含與幾何相關聯的中繼資料) 所組成。 如果將 GeoJSON 物件新增至資料來源,則可以輕鬆地在圖層中轉譯。 不過,如果您已更新該 GeoJSON 物件的座標屬性,則資料來源和地圖不會變更。 這是因為 JSON 物件中沒有觸發更新的機制。 圖形類別提供更新其所包含資料的功能。 在進行變更時,資料來源和地圖會自動收到通知並更新。
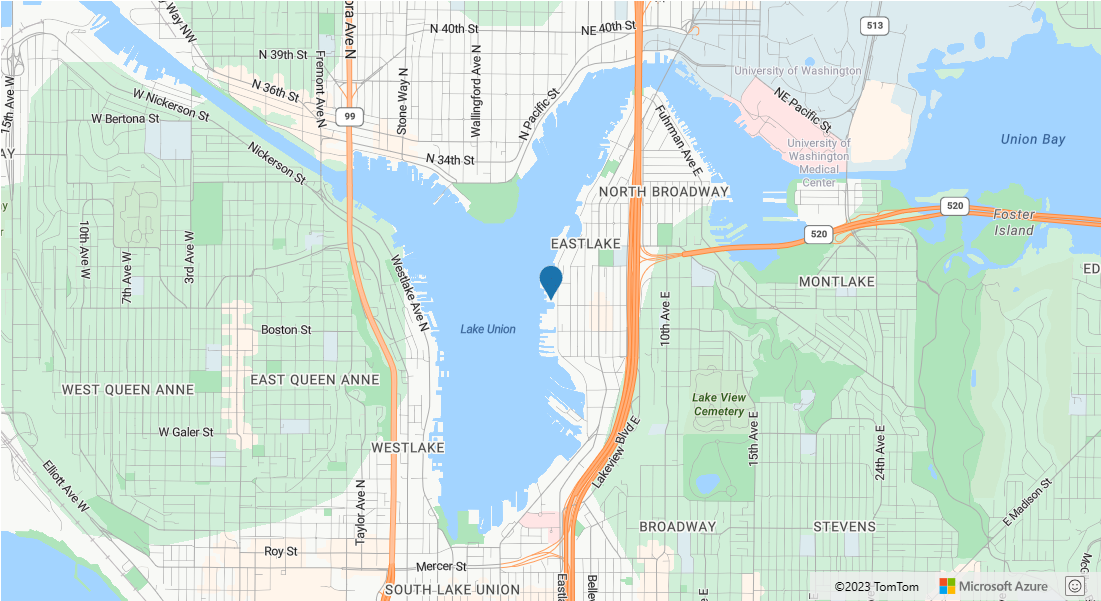
下列程式碼範例會建立 GeoJSON 點幾何,並將其傳遞至 atlas.Shape 類別,才能便於更新。 地圖的中心最初是用於轉譯符號。 點擊事件會新增到地圖上,以便在觸發時,將滑鼠座標與圖形 setCoordinates 函式搭配使用。 在點擊事件發生時會記錄滑鼠座標。 然後,setCoordinates 會更新地圖上符號的位置。
function InitMap()
{
    var map = new atlas.Map('myMap', {
        center: [-122.33, 47.64],
        zoom: 13,
        view: "Auto",

        //Add authentication details for connecting to Azure Maps.
        authOptions: {
            authType: 'subscriptionKey',
            subscriptionKey: '{Your-Azure-Maps-Subscription-key}'
        }
    });

    //Wait until the map resources are ready.
    map.events.add('ready', function () {

      /*Create a data source and add it to the map*/
      var dataSource = new atlas.source.DataSource();
      map.sources.add(dataSource);
      var point = new atlas.Shape(new atlas.data.Point([-122.33, 47.64]));
      //Add the symbol to the data source.
      dataSource.add([point]);

      /* Gets co-ordinates of clicked location*/
      map.events.add('click', function(e){
        /* Update the position of the point feature to where the user clicked on the map. */
        point.setCoordinates(e.position);
      });

      //Create a symbol layer using the data source and add it to the map
      map.layers.add(new atlas.layer.SymbolLayer(dataSource, null));
    });
}
秘訣
根據預設,符號圖層會隱藏重疊的符號,以最佳化符號的轉譯。 當您放大時,隱藏的符號就會變成可見。 若要停用此功能並隨時轉譯所有符號,請將 allowOverlap 選項的 iconOptions 屬性設定為 true。
將自訂圖示新增至符號圖層
使用 WebGL 來呈現符號圖層。 所有這類資源 (例如圖示影像) 必須載入 WebGL 內容中。 此範例顯示如何將自訂圖示新增至地圖資源。 然後,這個圖示會被用來在地圖上以自訂符號呈現座標資料。 符號圖層的 textField 屬性需要指定運算式。 在此案例中,我們想要轉譯溫度屬性。 因為溫度是一個數字,所以必須轉換成字串。 此外,我們還想在它的後面附加 "°F"。 運算式可用來執行此串連;['concat', ['to-string', ['get', 'temperature']], '°F']。
function InitMap()
{
    var map = new atlas.Map('myMap', {
        center: [-73.985708, 40.75773],
        zoom: 12,
        view: "Auto",

        //Add authentication details for connecting to Azure Maps.
        authOptions: {
            authType: 'subscriptionKey',
            subscriptionKey: '{Your-Azure-Maps-Subscription-key}'
        }
    });

    map.events.add('ready', function () {

      //Load the custom image icon into the map resources.
      map.imageSprite.add('my-custom-icon', '/images/icons/showers.png').then(function () {

        //Create a data source and add it to the map.
        var datasource = new atlas.source.DataSource();
        map.sources.add(datasource);

        //Create a point feature and add it to the data source.
        datasource.add(new atlas.data.Feature(new atlas.data.Point([-73.985708, 40.75773]), {
          temperature: 64
        }));

        //Add a layer for rendering point data as symbols.
        map.layers.add(new atlas.layer.SymbolLayer(datasource, null, {
          iconOptions: {
            //Pass in the id of the custom icon that was loaded into the map resources.
            image: 'my-custom-icon',

            //Optionally scale the size of the icon.
            size: 0.5
          },
          textOptions: {
            //Convert the temperature property of each feature into a string and concatenate "°F".
            textField: ['concat', ['to-string', ['get', 'temperature']], '°F'],

            //Offset the text so that it appears on top of the icon.
            offset: [0, -2]
          }
        }));
      });
    });
}
![]()
附註
如需上述範例中使用的映像檔複本,請參閱 GitHub 中的showers.png 。
秘訣
Azure 地圖服務 Web SDK 提供數個可自定義的影像範本,您可以搭配符號圖層使用。 如需詳細資訊,請參閱如何使用影像範本文件。
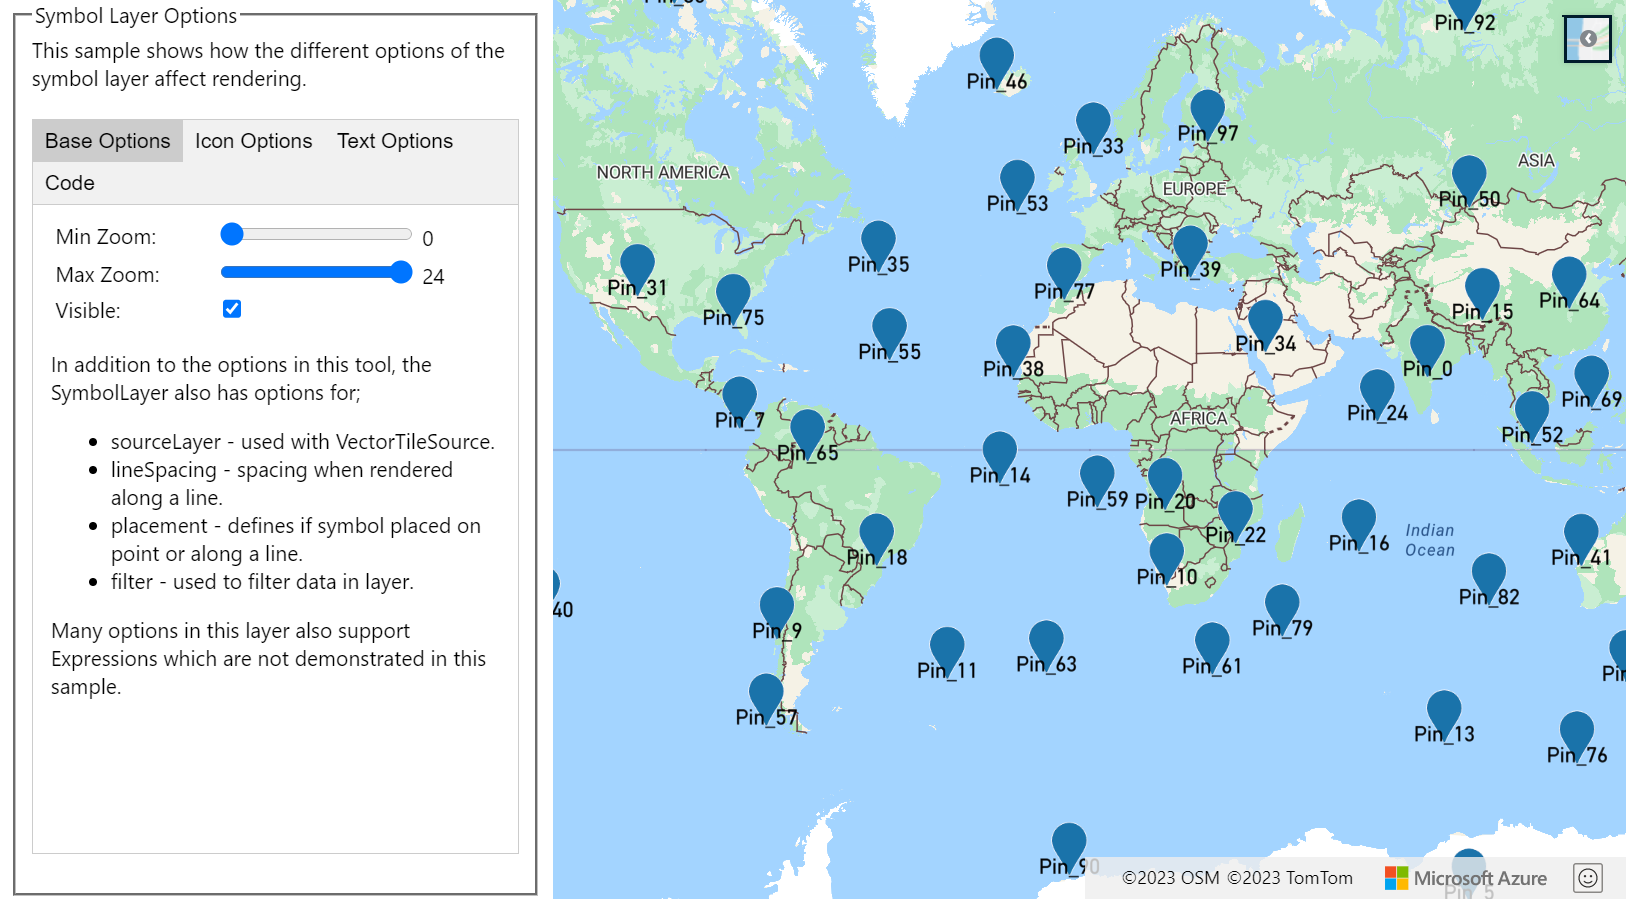
自訂符號圖層
符號圖層有許多可用的樣式選項。 符號圖層選項範例顯示符號圖層的不同選項如何影響轉譯。 如需此範例的原始程式碼,請參閱符號圖層選項原始程式碼。
秘訣
當您只想要轉譯具有符號圖層的文字時,您可以將圖示選項的 image 屬性設定為 'none' 來隱藏圖示。
下一步
深入了解本文使用的類別和方法:
請參閱下列文章,以取得更多可新增至地圖的程式碼範例: