R 生態系統提供多個圖形程式庫,其中搭載許多不同的功能。 根據預設,Microsoft Fabric 中的每個 Apache Spark 集區都包含一組策劃且熱門的開放原始碼程式庫。 可使用 Microsoft Fabric 程式庫管理功能,來新增或管理額外的程式庫或版本。
必要條件
取得 Microsoft Fabric 訂用帳戶。 或註冊免費的 Microsoft Fabric 試用版。
登入 Microsoft Fabric。
使用首頁左下角的體驗切換器切換到 Fabric。
開啟或建立筆記本。 若要了解操作說明,請參閱如何使用 Microsoft Fabric 筆記本。
將語言選項設定為 SparkR (R),以變更主要語言。
將筆記本連結至 Lakehouse。 在左側選取 [新增] 以新增現有的 Lakehouse 或建立 Lakehouse。
ggplot2
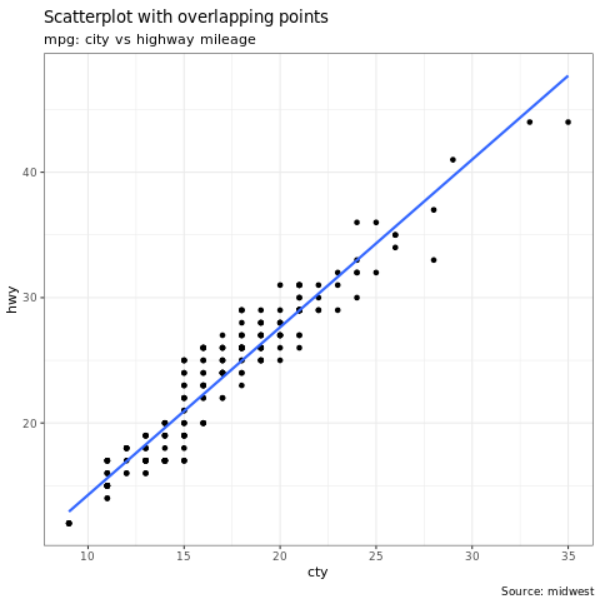
ggplot2 程式庫很適合用於資料視覺效果和探索式資料分析。
%%sparkr
library(ggplot2)
data(mpg, package="ggplot2")
theme_set(theme_bw())

g <- ggplot(mpg, aes(cty, hwy))

# Scatterplot
g + geom_point() +
  geom_smooth(method="lm", se=F) +
  labs(subtitle="mpg: city vs highway mileage",
       y="hwy",
       x="cty",
       title="Scatterplot with overlapping points",
       caption="Source: midwest")
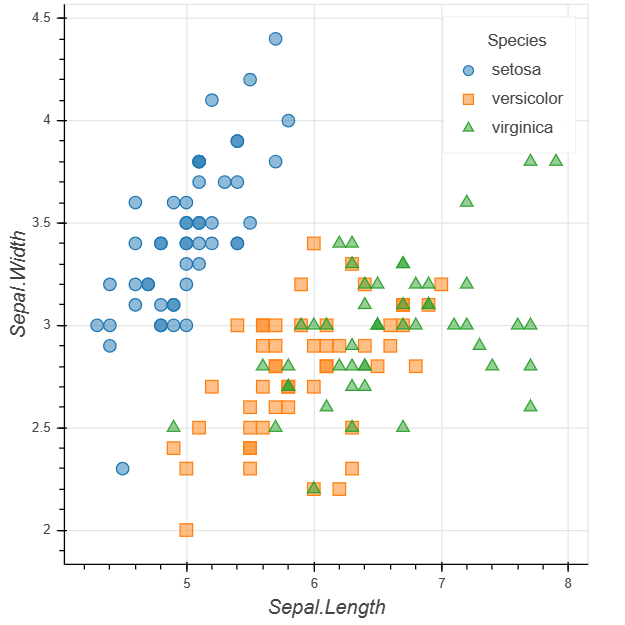
rbokeh
rbokeh 是用來建立互動式圖形的原生 R 繪圖程式庫。
library(rbokeh)
p <- figure() %>%
  ly_points(Sepal.Length, Sepal.Width, data = iris,
    color = Species, glyph = Species,
    hover = list(Sepal.Length, Sepal.Width))
p
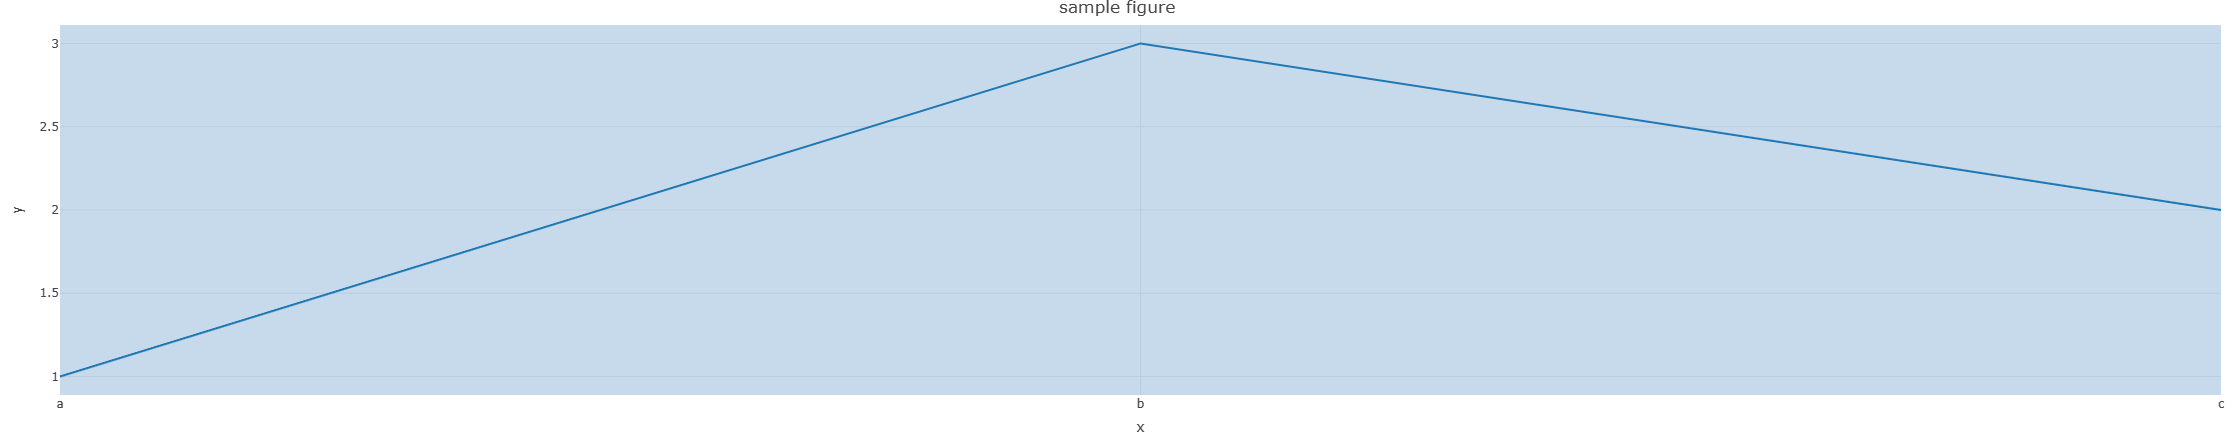
R 普洛特利
Plotly 是 R 圖形程式庫,可製作出版物品質的互動式圖形。
library(plotly)

fig <- plot_ly() %>%
  add_lines(x = c("a","b","c"), y = c(1,3,2))%>%
  layout(title="sample figure", xaxis = list(title = 'x'), yaxis = list(title = 'y'), plot_bgcolor = "#c7daec")

fig
Highcharter
Highcharter 是 Highcharts JavaScript 程式庫及其模組的 R 包裝函式。
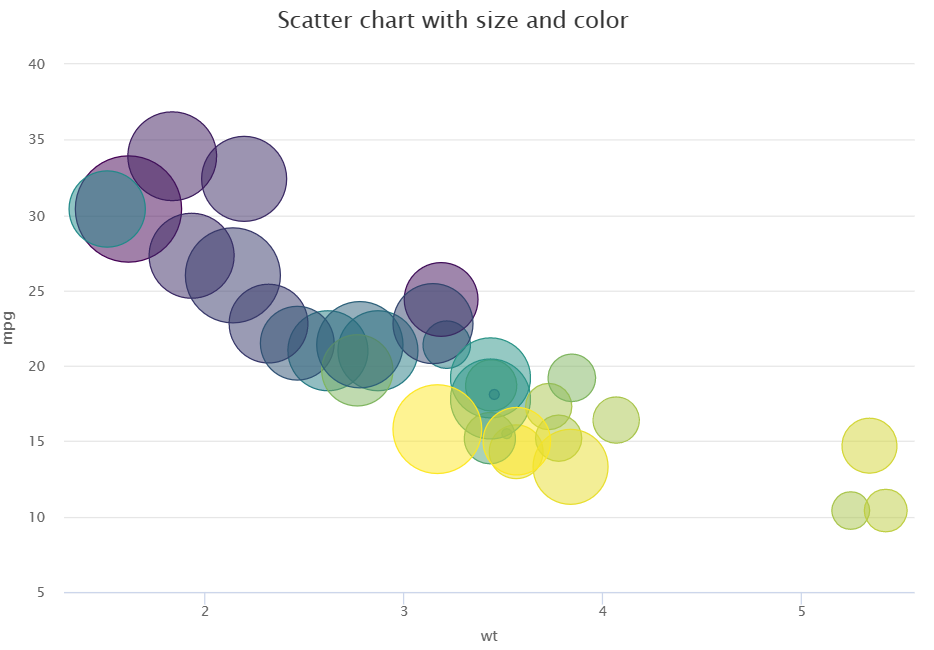
library(magrittr)
library(highcharter)
hchart(mtcars, "scatter", hcaes(wt, mpg, z = drat, color = hp)) %>%
  hc_title(text = "Scatter chart with size and color")