本教學課程說明如何開發 Power BI 視覺效果,以簡單橫條圖的形式顯示資料。 此視覺效果支援最少量的自訂。 本文件的其他頁面說明如何新增進一步自訂,例如操作內容、工具提示等等。
在本教學課程中,您會了解如何:
- 定義視覺效果的功能
- 了解用來建置視覺效果的原始程式碼
- 轉譯視覺效果
- 新增物件至屬性窗格
- 封裝視覺效果
設定您的環境
在您開始開發 Power BI 視覺效果之前,請確認您已具備此節所列的所有項目。
Power BI Pro 或 Premium Per User (PPU) 帳戶。 如果您沒有訂用帳戶,請註冊免費試用。
Visual Studio Code (VS Code)。 VS Code 是開發 JavaScript 和 TypeScript 應用程式的理想整合式開發環境 (IDE)。
Windows PowerShell 第 4 版或更新版本 (針對 Windows)。 或是終端機 (針對 Mac)。
已可用於開發 Power BI 視覺效果的環境。 設定環境以開發 Power BI 視覺效果。
此教學課程會使用 US Sales Analysis (美國銷售分析) 報表。 您可以下載此報表並將其上傳至 Power BI 服務,或是使用您自己的報表。 如果您需要 Power BI 服務及上傳檔案的詳細資訊,請參閱開始在 Power BI 服務中建立教學課程。
注意
如果您尚未在安裝過程中安裝 D3 JavaScript 程式庫,請立即安裝。 在 PowerShell 上執行 npm i d3@latest --save
建立橫條圖視覺效果包含下列步驟:
- 建立新專案
-
定義 capabilities 檔案 -
capabilities.json - 建立視覺效果 API
- 封裝視覺效果 -pbiviz.json
建立新專案
本教學課程的用途是協助您了解視覺效果的結構和撰寫方式。 您可以遵循這些指示,從頭開始建立條碼視覺效果,也可以複製原始程式碼存放庫並使用其以遵循指示,而不需要建立自己的視覺效果。
開啟 PowerShell 並瀏覽至您要在其中建立專案的資料夾。
輸入下列命令:
pbiviz new BarChart您現在應該會有名為 BarChart 的資料夾,其中包含視覺效果檔案。
在 VS Code 中,開啟 [tsconfig.json] (visual-project-structure.md#tsconfigjson) 檔案,並將「files」的名稱變更為「src/barChart.ts」。
"files": [ "src/barChart.ts" ]tsconfig.json「files」物件會指向視覺效果主要類別所在的檔案。
您的最終 tsconfig.json 檔案看起來應該會像 這樣。
package.json 檔案包含專案相依性清單。 以此檔案取代 package.json。
您現在應該會有具有下列檔案和資料夾的視覺效果新資料夾:
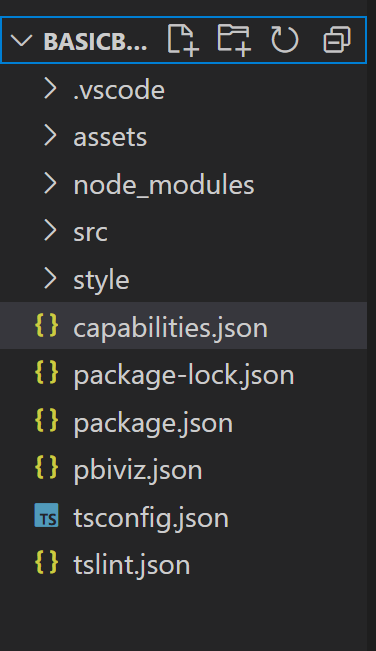
如需每個檔案函式的詳細說明,請參閱 Power BI 視覺效果項目專案結構。
我們在本教學課程中著重於兩個檔案,其中一個是描述主機視覺效果的 capabilities.json 檔案,另一個是包含視覺效果 API 的 src/barchart.ts 檔案。
定義功能
capabilities.json 檔案是我們將資料繫結至主機的位置。 我們會描述該檔案接受的資料欄位種類,以及視覺效果應該具備的功能。
定義資料角色
變數會在功能檔案的 dataRoles 區段中定義和繫結。 我們希望橫條圖接受以下兩種類型的變數:
- 類別資料,以圖表上不同橫條呈現
- 數字或測量資料,以每個長條的高度呈現
在 Visual Studio Code 中的 capabilities.json 檔案內將下列出現在物件中的 JSON 片段確認標記為「dataRoles」。
    "dataRoles": [
        {
            "displayName": "Category Data",
            "name": "category",
            "kind": "Grouping"
        },
        {
            "displayName": "Measure Data",
            "name": "measure",
            "kind": "Measure"
        }
    ],
對應資料
接下來,新增資料對應,以告訴主機如何使用這些變數:
以下列程式碼取代「dataViewMappings」物件的內容:
"dataViewMappings": [
        {
            "conditions": [
                {
                    "category": {
                        "max": 1
                    },
                    "measure": {
                        "max": 1
                    }
                }
            ],
            "categorical": {
                "categories": {
                    "for": {
                        "in": "category"
                    }
                },
                "values": {
                    "select": [
                        {
                            "bind": {
                                "to": "measure"
                            }
                        }
                    ]
                }
            }
        }
    ],
上方程式碼會建立每個資料角色物件一次只能保留一個欄位的「條件」。 請注意,我們使用資料角色的內部 name 來參考每個欄位。
其也會設定類別資料對應,讓每個欄位對應到正確的變數。
為屬性窗格定義物件
功能檔案的「objects」區段是定義應出現在格式窗格上的可自訂功能位置。 這些功能不會影響圖表的內容,但可以變更其外觀和風格。
如需物件及其運作方式的詳細資訊,請參閱物件。
下列為選擇性物件。 如果您想要瀏覽本教學課程的選擇性區段,以新增色彩並轉譯 X 軸,請新增這些物件。
以下列程式碼取代「objects」區段的內容:
     "objects": {
        "enableAxis": {
            "properties": {
                "show": {
                    "type": {
                        "bool": true
                    }
                },
                "fill": {
                    "type": {
                        "fill": {
                            "solid": {
                                "color": true
                            }
                        }
                    }
                }
            }
        },
        "colorSelector": {
            "properties": {
                "fill": {
                    "type": {
                        "fill": {
                            "solid": {
                                "color": true
                            }
                        }
                    }
                }
            }
        }
     },
儲存 capabilities.json 檔案。
您的最終功能檔案看起來應該會如此範例中的功能。
視覺效果 API
所有視覺效果均以實作 IVisual 介面的類別開始。
src/visual.ts 檔案是包含這個類別的預設檔案。
在本教學課程中,我們會呼叫 IVisual檔案。
下載檔案,並將檔案儲存至 /src 資料夾 (如果您尚未這麼做)。 在本此章節中,我們會詳細瀏覽此檔案,並描述各種區段。
匯入
檔案的第一個區段會匯入此視覺效果所需的模組。 請注意,除了 Power BI 視覺效果模組之外,我們也會匯入 d3 程式庫。
下列模組會匯入至您的 barChart.ts 檔案:
import {
    BaseType,
    select as d3Select,
    Selection as d3Selection
} from "d3-selection";
import {
    ScaleBand,
    ScaleLinear,
    scaleBand,
    scaleLinear
} from "d3-scale";
import "./../style/visual.less";

import { Axis, axisBottom } from "d3-axis";

import powerbi from "powerbi-visuals-api";

type Selection<T extends BaseType> = d3Selection<T, any, any, any>;

// powerbi.visuals
import DataViewCategoryColumn = powerbi.DataViewCategoryColumn;
import Fill = powerbi.Fill;
import ISandboxExtendedColorPalette = powerbi.extensibility.ISandboxExtendedColorPalette;
import ISelectionId = powerbi.visuals.ISelectionId;
import IVisual = powerbi.extensibility.IVisual;
import IVisualHost = powerbi.extensibility.visual.IVisualHost;
import PrimitiveValue = powerbi.PrimitiveValue;
import VisualUpdateOptions = powerbi.extensibility.visual.VisualUpdateOptions;
import VisualConstructorOptions = powerbi.extensibility.visual.VisualConstructorOptions;
import DataViewObjectPropertyIdentifier = powerbi.DataViewObjectPropertyIdentifier;

import { textMeasurementService } from "powerbi-visuals-utils-formattingutils";
import { FormattingSettingsService } from "powerbi-visuals-utils-formattingmodel";

import { BarChartSettingsModel } from "./barChartSettingsModel";
import { dataViewObjects} from "powerbi-visuals-utils-dataviewutils";
介面
接下來,我們會定義視覺效果介面。 下列介面可用來描述我們的橫條圖視覺效果:
- BarChartDataPoint
此介面的定義如下:
/**
 * Interface for BarChart data points.
 *
 * @interface
 * @property {PrimitiveValue} value     - Data value for point.
 * @property {string} category          - Corresponding category of data value.
 * @property {string} color             - Color corresponding to data point.
 * @property {string} strokeColor       - Stroke color for data point column.
 * @property {number} strokeWidth       - Stroke width for data point column.
 * @property {ISelectionId} selectionId - Id assigned to data point for cross filtering
 *                                        and visual interaction.
 */
interface BarChartDataPoint {
    value: PrimitiveValue;
    category: string;
    color: string;
    strokeColor: string;
    strokeWidth: number;
    selectionId: ISelectionId;
}
視覺轉換
定義資料結構後,我們需要使用 createSelectorDataPoints 函式將資料對應至該結構上。 此函式會從資料檢視中接收資料,並將其轉換成視覺效果可使用的格式。 在此情況下,函式會回傳上一章節中所述的 BarChartDataPoint[] 介面。
DataView 包含要視覺化的資料。 此資料可以不同的形式呈現,例如類別或表格式。 若要建立如橫條圖類別的視覺效果,請使用 上的DataView屬性。
在更新視覺效果時呼叫此函式。
/**
 * Function that converts queried data into a viewmodel that will be used by the visual.
 *
 * @function
 * @param {VisualUpdateOptions} options - Contains references to the size of the container
 *                                        and the dataView which contains all the data
 *                                        the visual had queried.
 * @param {IVisualHost} host            - Contains references to the host which contains services
 */
function createSelectorDataPoints(options: VisualUpdateOptions, host: IVisualHost): BarChartDataPoint[] {
    const barChartDataPoints: BarChartDataPoint[] = []
    const dataViews = options.dataViews;

    if (!dataViews
        || !dataViews[0]
        || !dataViews[0].categorical
        || !dataViews[0].categorical.categories
        || !dataViews[0].categorical.categories[0].source
        || !dataViews[0].categorical.values
    ) {
        return barChartDataPoints;
    }

    const categorical = dataViews[0].categorical;
    const category = categorical.categories[0];
    const dataValue = categorical.values[0];

    const colorPalette: ISandboxExtendedColorPalette = host.colorPalette;

    const strokeColor: string = getColumnStrokeColor(colorPalette);

    const strokeWidth: number = getColumnStrokeWidth(colorPalette.isHighContrast);

    for (let i = 0, len = Math.max(category.values.length, dataValue.values.length); i < len; i++) {
        const color: string = getColumnColorByIndex(category, i, colorPalette);

        const selectionId: ISelectionId = host.createSelectionIdBuilder()
            .withCategory(category, i)
            .createSelectionId();

        barChartDataPoints.push({
            color,
            strokeColor,
            strokeWidth,
            selectionId,
            value: dataValue.values[i],
            category: `${category.values[i]}`,
        });
    }

    return barChartDataPoints;
}
注意
barChart.ts 檔案中接下來的幾個函式會處理色彩並建立 X 軸。 這些函式是選擇性,並會在本教學課程中進一步討論。 本教學課程會接著 IVisual 函式繼續進行。
轉譯視覺效果
定義資料之後,我們會使用實作 IVisual 介面的 BarChart 類別來轉譯視覺效果。
IVisual 介面會在 Visual API 頁面上有所描述。 它包含一個會建立視覺效果的 constructor 方法,以及另一個每次重新載入視覺效果時呼叫的 update 方法。
在轉譯視覺效果之前,我們必須宣告下列類別的成員:
export class BarChart implements IVisual {
    private svg: Selection<SVGSVGElement>;
    private host: IVisualHost;
    private barContainer: Selection<SVGElement>;
    private xAxis: Selection<SVGGElement>;
    private barDataPoints: BarChartDataPoint[];
    private formattingSettings: BarChartSettingsModel;
    private formattingSettingsService: FormattingSettingsService;

    private barSelection: Selection<BaseType>;

    static Config = {
        xScalePadding: 0.1,
        solidOpacity: 1,
        transparentOpacity: 1,
        margins: {
            top: 0,
            right: 0,
            bottom: 25,
            left: 30,
        },
        xAxisFontMultiplier: 0.04,
    };
}
建構視覺效果
第一次轉譯視覺效果時,只會呼叫一次建構函式。 該函式會建立橫條圖和 X 軸的空白 SVG 容器。 請注意,它會使用 d3 程式庫來轉譯 SVG。
/**
     * Creates instance of BarChart. This method is only called once.
     *
     * @constructor
     * @param {VisualConstructorOptions} options - Contains references to the element that will
     *                                             contain the visual and a reference to the host
     *                                             which contains services.
     */
    constructor(options: VisualConstructorOptions) {
        this.host = options.host;
        //Creating the formatting settings service.
        const localizationManager = this.host.createLocalizationManager();
        this.formattingSettingsService = new FormattingSettingsService(localizationManager);

        this.svg = d3Select(options.element)
            .append('svg')
            .classed('barChart', true);

        this.barContainer = this.svg
            .append('g')
            .classed('barContainer', true);

        this.xAxis = this.svg
            .append('g')
            .classed('xAxis', true);
    }
更新視覺效果
每次視覺效果的大小或其中一個值變更時,都會呼叫更新方法。
調整大小
我們需要調整視覺效果,讓橫條數量和目前值符合視覺效果定義的寬度和高度限制。 這類似於 Circle 卡片教學課程中的更新方法。
若要計算縮放,我們使用先前從 scaleLinear 程式庫匯入的 scaleBand 和 d3-scale 方法。
options.dataViews[0].categorical.values[0].maxLocal 值會保留所有目前資料點的最大值。 這個值用來判斷 Y 軸的高度。 x 軸寬度的縮放比例取決於繫結至 barchartdatapoint 介面中視覺效果的類別數量。
若為轉譯 X 軸的情況,此視覺效果也會處理文字分隔,以防沒有足夠的空間在 X 軸上寫出整個名稱。
其他更新功能
除了縮放之外,更新方法也處理選取項目和色彩。 這些功能是選擇性的,並會在稍後討論:
   /**
     * Updates the state of the visual. Every sequential databinding and resize will call update.
     *
     * @function
     * @param {VisualUpdateOptions} options - Contains references to the size of the container
     *                                        and the dataView which contains all the data
     *                                        the visual had queried.
     */
    public update(options: VisualUpdateOptions) {
        this.formattingSettings = this.formattingSettingsService.populateFormattingSettingsModel(BarChartSettingsModel, options.dataViews?.[0]);
        this.barDataPoints = createSelectorDataPoints(options, this.host);
        this.formattingSettings.populateColorSelector(this.barDataPoints);

        const width = options.viewport.width;
        let height = options.viewport.height;

        this.svg
            .attr("width", width)
            .attr("height", height);

        if (this.formattingSettings.enableAxis.show.value) {
            const margins = BarChart.Config.margins;
            height -= margins.bottom;
        }

        this.xAxis
            .style("font-size", Math.min(height, width) * BarChart.Config.xAxisFontMultiplier)
            .style("fill", this.formattingSettings.enableAxis.fill.value.value);

        const yScale: ScaleLinear<number, number> = scaleLinear()
            .domain([0, <number>options.dataViews[0].categorical.values[0].maxLocal])
            .range([height, 0]);

        const xScale: ScaleBand<string> = scaleBand()
            .domain(this.barDataPoints.map(d => d.category))
            .rangeRound([0, width])
            .padding(0.2);

        const xAxis: Axis<string> = axisBottom(xScale);

        this.xAxis.attr('transform', 'translate(0, ' + height + ')')
            .call(xAxis)
            .attr("color", this.formattingSettings.enableAxis.fill.value.value);

        const textNodes: Selection<SVGElement> = this.xAxis.selectAll("text");
        BarChart.wordBreak(textNodes, xScale.bandwidth(), height);

        this.barSelection = this.barContainer
            .selectAll('.bar')
            .data(this.barDataPoints);

        const barSelectionMerged = this.barSelection
            .enter()
            .append('rect')
            .merge(<any>this.barSelection);

        barSelectionMerged.classed('bar', true);

        barSelectionMerged
            .attr("width", xScale.bandwidth())
            .attr("height", (dataPoint: BarChartDataPoint) => height - yScale(<number>dataPoint.value))
            .attr("y", (dataPoint: BarChartDataPoint) => yScale(<number>dataPoint.value))
            .attr("x", (dataPoint: BarChartDataPoint) => xScale(dataPoint.category))
            .style("fill", (dataPoint: BarChartDataPoint) => dataPoint.color)
            .style("stroke", (dataPoint: BarChartDataPoint) => dataPoint.strokeColor)
            .style("stroke-width", (dataPoint: BarChartDataPoint) => `${dataPoint.strokeWidth}px`);

        this.barSelection
            .exit()
            .remove();
    }

    private static wordBreak(
        textNodes: Selection<SVGElement>,
        allowedWidth: number,
        maxHeight: number
    ) {
        textNodes.each(function () {
            textMeasurementService.wordBreak(
                this,
                allowedWidth,
                maxHeight);
        });
    }
使用格式化模型 Utils 填入屬性窗格
IVisual 函式中的最後一個方法是 getFormattingModel。 此方法會建置並回傳以新式格式窗格格式化的模型物件,其中包含所有格式窗格元件和屬性。 然後,此方法會將物件放在格式窗格中。 在我們的案例中,我們會根據 enableAxis檔案中的colorSelector,建立 show 和 fill 的格式卡片,包含 和 的格式屬性。 若要在屬性窗格上為每個類別新增色彩選擇器,請在 barDataPoints 上新增 for 迴圈,而且會為每個類別新增新的色彩選擇器格式屬性至格式化模型。
若要建置格式化模型,開發人員應熟悉其所有元件。 查看 Format Pane 中格式窗格的元件。 查看getFormattingModel中 FormattingModel utils 的 API。
下載檔案,並將檔案儲存至 /src 資料夾。 在格式化設定類別中宣告格式化屬性以及其值:
import { formattingSettings } from "powerbi-visuals-utils-formattingmodel";
import { BarChartDataPoint } from "./barChart";

import Card = formattingSettings.SimpleCard;
import Model = formattingSettings.Model;
import Slice = formattingSettings.Slice;
import ColorPicker = formattingSettings.ColorPicker;
import ToggleSwitch = formattingSettings.ToggleSwitch;

/**
 * Enable Axis Formatting Card
 */
class EnableAxisCardSettings extends Card {
    show = new ToggleSwitch({
        name: "show",
        displayName: undefined,
        value: false,
    });

    fill = new ColorPicker({
        name: "fill",
        displayName: "Color",
        value: { value: "#000000" }
    });
    topLevelSlice: ToggleSwitch = this.show;
    name: string = "enableAxis";
    displayName: string = "Enable Axis";
    slices: Slice[] = [this.fill];
}

/**
 * Color Selector Formatting Card
 */
class ColorSelectorCardSettings extends Card {
    name: string = "colorSelector";
    displayName: string = "Data Colors";

    // slices will be populated in barChart settings model `populateColorSelector` method
    slices: Slice[] = [];
}

/**
* BarChart formatting settings model class
*/
export class BarChartSettingsModel extends Model {
    // Create formatting settings model formatting cards
    enableAxis = new EnableAxisCardSettings();
    colorSelector = new ColorSelectorCardSettings();
    cards: Card[] = [this.enableAxis, this.colorSelector];

    /**
     * populate colorSelector object categories formatting properties
     * @param dataPoints
     */
    populateColorSelector(dataPoints: BarChartDataPoint[]) {
        const slices: Slice[] = this.colorSelector.slices;
        if (dataPoints) {
            dataPoints.forEach(dataPoint => {
                slices.push(new ColorPicker({
                    name: "fill",
                    displayName: dataPoint.category,
                    value: { value: dataPoint.color },
                    selector: dataPoint.selectionId.getSelector(),
                }));
            });
        }
    }
}
在視覺效果建構函式方法中,建置和建立格式化設定服務模型。
格式化設定服務會接收 barChart 格式設定,並將其轉換成 getFormattingModel API 中回傳的 FormattingModel 物件。
若要使用當地語系化功能,請將當地語系化管理員新增至格式化設定服務。
    import { FormattingSettingsService } from "powerbi-visuals-utils-formattingmodel";

    // ...
    // declare utils formatting settings service
    private formattingSettingsService: FormattingSettingsService;
    //...

    constructor(options: VisualConstructorOptions) {
        this.host = options.host;
        const localizationManager = this.host.createLocalizationManager();
        this.formattingSettingsService = new FormattingSettingsService(localizationManager);

        // Add here rest of your custom visual constructor code
    }
使用更新 API 以更新格式化設定模型。 屬性窗格中的格式化屬性變更時,呼叫更新API。 建立橫條圖選取器資料點,並在格式化設定模型中填入資料點:
    // declare formatting settings model for bar chart
    private formattingSettings: BarChartSettingsModel;

    // ...

    public update(options: VisualUpdateOptions) {
        this.formattingSettings = this.formattingSettingsService.populateFormattingSettingsModel(BarChartSettingsModel, options.dataViews[0]);
        this.barDataPoints = createSelectorDataPoints(options, this.host);
        this.formattingSettings.populateColorSelector(this.barDataPoints);

        // Add the rest of your custom visual update API code here

    }
最後,新的 API getFormattingModel 是一條簡單的程式碼行,其使用上方更新 API 中建立的格式化設定服務和目前的格式化設定模型。
    public getFormattingModel(): powerbi.visuals.FormattingModel {
        return this.formattingSettingsService.buildFormattingModel(this.formattingSettings);
    }
(選擇性) 轉譯 X 軸 (靜態物件)
您可以將物件加入至 [屬性] 窗格,以進一步自訂視覺效果。 這些自訂可以是使用者介面變更,或與所查詢資料相關的變更。
您可以在 [屬性] 窗格中開啟或關閉這些物件。
本範例會將橫條圖上的 X 軸轉譯為靜態物件。
我們已將 enableAxis 屬性新增至功能檔案和 barChartSettings 介面功能。
(選擇性) 新增色彩 (資料繫結物件)
資料繫結物件與靜態物件類似,但通常會處理資料選取。 例如,您可以使用資料繫結物件,以互動方式選取和每個資料點相關聯的色彩。
我們已在colorSelector檔案中定義 物件。
每一個資料點都由不同的色彩表示。 我們在 BarChartDataPoint 介面中包含色彩,並在 IVisualHost 中定義時,將預設色彩指派給每個資料點。
function getColumnColorByIndex(
    category: DataViewCategoryColumn,
    index: number,
    colorPalette: ISandboxExtendedColorPalette,
): string {
    if (colorPalette.isHighContrast) {
        return colorPalette.background.value;
    }

    const defaultColor: Fill = {
        solid: {
            color: colorPalette.getColor(`${category.values[index]}`).value,
        }
    };

    const prop: DataViewObjectPropertyIdentifier = {
        objectName: "colorSelector",
        propertyName: "fill"
    };

    let colorFromObjects: Fill;
    if(category.objects?.[index]){
        colorFromObjects = dataViewObjects.getValue(category?.objects[index], prop);
    }

    return colorFromObjects?.solid.color ?? defaultColor.solid.color;
}

function getColumnStrokeColor(colorPalette: ISandboxExtendedColorPalette): string {
    return colorPalette.isHighContrast
        ? colorPalette.foreground.value
        : null;
}

function getColumnStrokeWidth(isHighContrast: boolean): number {
    return isHighContrast
        ? 2
        : 0;
}
colorPalette 函式中的 createSelectorDataPoints 服務會管理這些色彩。 由於 createSelectorDataPoints 逐一查看每個資料點,因此該函式是指派類別物件的理想位置,例如色彩。
如需如何將色彩新增至橫條圖的詳細指示,請前往將色彩新增至 Power BI 視覺效果。
注意
驗證您的最終 barChart.ts 檔案看起來像 barChart.ts 原始程式碼,或下載 barChart.ts 原始程式碼,並使用其以取代您的檔案。
測試視覺效果
在 Power BI 伺服器中執行視覺效果,以查看其外觀:
在 PowerShell中,瀏覽至專案的資料夾並啟動開發應用程式。
pbiviz start您的視覺效果現在會在裝載於您電腦上的情況下執行。
重要
請不要關閉 PowerSell 視窗,直到教學課程結束為止。 若要停止執行視覺效果,請輸入 Ctrl+C,如果系統提示是否要終止批次作業,請輸入 Y,然後按下 Enter。
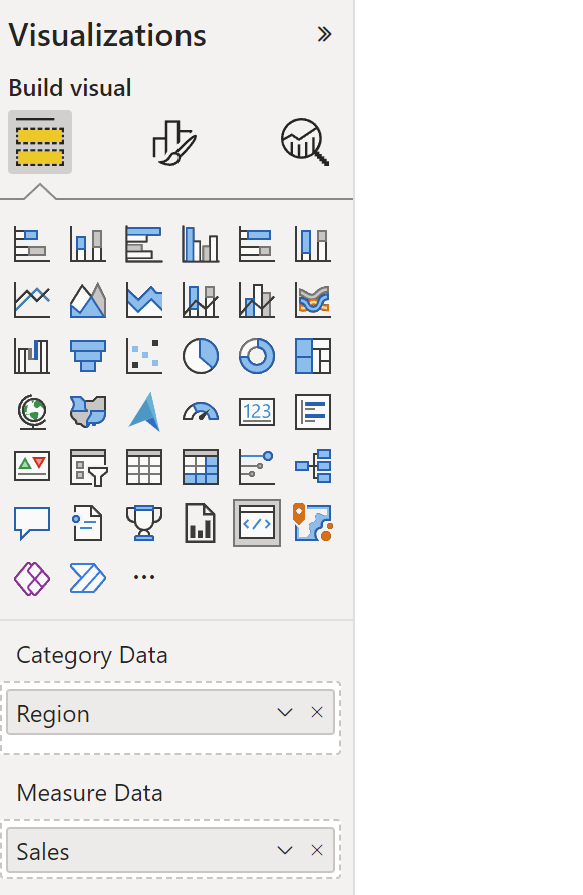
從 [視覺效果窗格] 選取 [開發人員視覺效果] ,以檢視 Power BI 服務中的視覺效果。
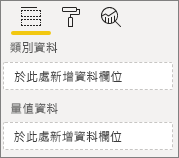
新增資料至視覺效果
拖曳視覺效果的邊緣以變更大小,並注意如何調整縮放。
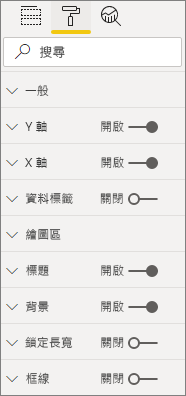
切換 X 軸開關。

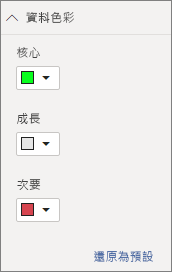
變更不同類別的色彩。
新增其他功能
您可以透過新增更多功能來進一步自訂視覺效果。 您可以新增功能來增加視覺效果功能、改善其外觀和風格,或讓使用者更充分控制其外觀。 例如,您可以:
封裝視覺效果
若要將視覺效果載入 Power BI Desktop,或在 Power BI 視覺效果資源庫中與社群分享,您需要加以封裝。
若要準備視覺效果以提供分享,請遵循封裝 Power BI 視覺效果中的指示。
注意
如需具有更多功能之橫條圖的完整原始程式碼,包含工具提示和操作功能表,請參閱 Power BI 視覺效果樣本橫條圖。