Windows 調試程式 (WinDbg) 是 Windows 偵錯工具中包含的內核模式和使用者模式調試程式。 本文提供練習,協助您開始使用 WinDbg 作為內核模式調試程式。
若要取得 WinDbg,請參閱 下載並安裝 Windows 調試程式 (WinDbg) 。
設定內核模式偵錯
A kernel-mode debugging environment typically has two computers, the host computer and the target computer. 調試程式會在主計算機上執行,而正在偵錯的程式代碼會在目標計算機上執行。 主機和目標會透過偵錯纜線連接。
Windows 調試程序支援下列類型的纜線:
- Ethernet
- USB 3.0
- Serial (also called null modem)
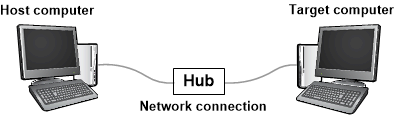
為了獲得速度和可靠性,您應該使用乙太網路纜線搭配局域網路中樞。 下圖說明使用乙太網路纜線進行偵錯的主機和目標電腦:
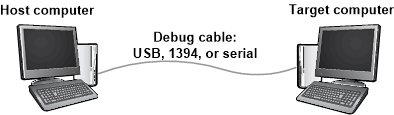
舊版 Windows 的選項是使用直接纜線,例如序列纜線:
依照所需設定的安裝程式來啟動程式:
若要設定主機和目標計算機,請參閱 手動設定內核模式偵錯。
若要將除錯程式連線至 Hyper-V 虛擬機 (VM),請參閱 設定虛擬機器主機的網路偵錯 - 透過網路進行核心偵錯 (KDNET) 。
建立內核模式偵錯會話
設定主機和目標電腦並使用偵錯纜線連接它們之後,您可以建立內核模式偵錯會話。
繼續進行您用於安裝程式的文章中的指示。 例如,如果您設定主機和目標計算機以透過乙太網路纜線進行內核模式偵錯,請遵循 自動設定 KDNET 網路核心偵錯中的指示。
開始使用 WinDbg 進行偵錯
若要開始使用 WinDbg 進行偵錯工作階段,請遵循下列步驟:
在主計算機上,開啟 WinDbg,並使用目標電腦建立內核模式偵錯會話。
Open the debugger documentation CHM (.chm) file by selecting Help>Contents.
調試程式檔也可以在適用於 Windows 的偵錯工具上線取得。 如需詳細資訊,請參閱 安裝 Windows 調試程式。
當您建立內核模式偵錯會話時,WinDbg 可能會自動進入目標計算機。 If WinDbg doesn't break in, select Debug>Break.
在 WinDbg 視窗底部的命令列中,執行下列命令:
使用 .sympath (Symbol Path) 命令設定符號路徑。
.sympath srv*輸出類似於下列範例:
Symbol search path is: srv*
Expanded Symbol search path is: cache*;SRV*https://msdl.microsoft.com/download/symbols
The symbol search path tells WinDbg where to look for symbol program database (PDB) files (.pdb). 調試程式需要符號檔,才能取得程式代碼模組的相關信息,例如函式名稱和變數名稱。
Run the .reload command so WinDbg starts finding and loading symbols files.
.reload
View a list of loaded modules with the lm command.
lm輸出類似於下列範例:
0:000>3: kd> lm
start               end                 module name
fffff800`00000000   fffff800`00088000   CI            (deferred)
...
fffff800`01143000   fffff800`01151000   BasicRender   (deferred)
fffff800`01151000   fffff800`01163000   BasicDisplay  (deferred)
...
fffff800`02a0e000   fffff800`03191000   nt  (pdb symbols) C:\...\ntkrnlmp.pdb
fffff800`03191000   fffff800`03200000   hal (deferred)
...
Start the target computer running again with the g (Go) command.
gBreak in to the target computer again by selecting Debug>Break.
執行 dt (顯示類型) 命令,並檢查
_FILE_OBJECT模組中的nt資料類型:dt nt!_FILE_OBJECT輸出類似於下列範例:
0:000>0: kd> dt nt!_FILE_OBJECT
   +0x000 Type                 : Int2B
   +0x002 Size                 : Int2B
   +0x008 DeviceObject         : Ptr64 _DEVICE_OBJECT
   +0x010 Vpb                  : Ptr64 _VPB
   ...
   +0x0c0 IrpList              : _LIST_ENTRY
   +0x0d0 FileObjectExtension  : Ptr64 Void
執行 x (檢查符號) 命令,並檢視模組中的
nt一些符號:x nt!\*CreateProcess\*輸出類似於下列範例:
0:000>0: kd> x nt!*CreateProcess*
fffff800`030821cc   nt!ViCreateProcessCallbackInternal (<no parameter info>)
...
fffff800`02e03904   nt!MmCreateProcessAddressSpace (<no parameter info>)
fffff800`02cece00   nt!PspCreateProcessNotifyRoutine = <no type information>
...
執行 bu (設定斷點) 和 bl (斷點清單) 命令來設定與檢查斷點:
使用 命令,
bu並在 Windows 呼叫中設定斷點至MmCreateProcessAddressSpace例程。 然後執行bl命令,並確認已設定斷點。bu nt!MmCreateProcessAddressSpace bl輸出類似於下列範例:
0:000>0: kd> bu nt!MmCreateProcessAddressSpace
0: kd> bl
0 e fffff800`02e03904  0001 (0001) nt!MmCreateProcessAddressSpace
輸入
g(Go) 以讓目標電腦執行。g當 Windows 呼叫
MmCreateProcessAddressSpace例程時,目標計算機會進入調試程式。如果目標電腦未立即進入調試程式,請在目標計算機上執行一些動作。 例如,開啟 [記事本] 並儲存盤案。
使用
.reload與 k 檢視堆疊追蹤 (顯示堆疊回溯) 命令:.reload k輸出類似於下列範例:
0:000>2: kd> k Child-SP RetAddr Call Site ffffd000`224b4c88 fffff800`02d96834 nt!MmCreateProcessAddressSpace ffffd000`224b4c90 fffff800`02dfef17 nt!PspAllocateProcess+0x5d4 ffffd000`224b5060 fffff800`02b698b3 nt!NtCreateUserProcess+0x55b ... 000000d7`4167fbb0 00007ffd`14b064ad KERNEL32!BaseThreadInitThunk+0xd 000000d7`4167fbe0 00000000`00000000 ntdll!RtlUserThreadStart+0x1dSelect View>Disassembly. Then select Debug>Step Over (or select F10).
Enter step commands a few more times as you watch the output in the Disassembly window.
使用 bc (斷點清除) 命令清除斷點。
bc *輸入
g(Go) 以讓目標電腦執行。gTo break in again, select Debug>Break, or select CTRL-Break.
View a list of all processes with the !process command:
!process 0 0輸出類似於下列範例:
0:000>0: kd> !process 0 0 **** NT ACTIVE PROCESS DUMP **** PROCESS ffffe000002287c0 SessionId: none Cid: 0004 Peb: 00000000 ParentCid: 0000 DirBase: 001aa000 ObjectTable: ffffc00000003000 HandleCount: <Data Not Accessible> Image: System PROCESS ffffe00001e5a900 SessionId: none Cid: 0124 Peb: 7ff7809df000 ParentCid: 0004 DirBase: 100595000 ObjectTable: ffffc000002c5680 HandleCount: <Data Not Accessible> Image: smss.exe ... PROCESS ffffe00000d52900 SessionId: 1 Cid: 0910 Peb: 7ff669b8e000 ParentCid: 0a98 DirBase: 3fdba000 ObjectTable: ffffc00007bfd540 HandleCount: <Data Not Accessible> Image: explorer.exe複製行程的位址,例如
ffffe00000d52900,並使用 命令檢視進程資訊!process。 將<process-address>部分取代為行程位址:!process <process-address> 2行程的輸出
ffffe00000d52900會顯示行程中的下列線程:0:000>0:000>0: kd> !process ffffe00000d52900 2 PROCESS ffffe00000d52900 SessionId: 1 Cid: 0910 Peb: 7ff669b8e000 ParentCid: 0a98 DirBase: 3fdba000 ObjectTable: ffffc00007bfd540 HandleCount: Image: explorer.exe THREAD ffffe00000a0d880 Cid 0910.090c Teb: 00007ff669b8c000 ffffe00000d57700 SynchronizationEvent THREAD ffffe00000e48880 Cid 0910.0ad8 Teb: 00007ff669b8a000 ffffe00000d8e230 NotificationEvent ffffe00000cf6870 Semaphore Limit 0xffff ffffe000039c48c0 SynchronizationEvent ... THREAD ffffe00000e6d080 Cid 0910.0cc0 Teb: 00007ff669a10000 ffffe0000089a300 QueueObjectCopy the address for a thread, such as
ffffe00000e6d080, and view the thread information with the !thread command. 將<thread-address>部份取代為線程位址:!thread <thread-ddress>線程的
ffffe00000e6d080輸出會顯示下列摘要資訊:0: kd> !thread ffffe00000e6d080 THREAD ffffe00000e6d080 Cid 0910.0cc0 Teb: 00007ff669a10000 Win32Thread: 0000000000000000 WAIT: ... ffffe0000089a300 QueueObject Not impersonating DeviceMap ffffc000034e7840 Owning Process ffffe00000d52900 Image: explorer.exe Attached Process N/A Image: N/A Wait Start TickCount 13777 Ticks: 2 (0:00:00:00.031) Context Switch Count 2 IdealProcessor: 1 UserTime 00:00:00.000 KernelTime 00:00:00.000 Win32 Start Address ntdll!TppWorkerThread (0x00007ffd14ab2850) Stack Init ffffd00021bf1dd0 Current ffffd00021bf1580 Base ffffd00021bf2000 Limit ffffd00021bec000 Call 0 Priority 13 BasePriority 13 UnusualBoost 0 ForegroundBoost 0 IoPriority 2 PagePriority 5 ...View all the device nodes in the Plug and Play device tree with the !devnode command:
!devnode 0 1輸出類似於下列範例:
0:000>0: kd> !devnode 0 1 Dumping IopRootDeviceNode (= 0xffffe000002dbd30) DevNode 0xffffe000002dbd30 for PDO 0xffffe000002dc9e0 InstancePath is "HTREE\ROOT\0" State = DeviceNodeStarted (0x308) Previous State = DeviceNodeEnumerateCompletion (0x30d) DevNode 0xffffe000002d9d30 for PDO 0xffffe000002daa40 InstancePath is "ROOT\volmgr\0000" ServiceName is "volmgr" State = DeviceNodeStarted (0x308) Previous State = DeviceNodeEnumerateCompletion (0x30d) DevNode 0xffffe00001d49290 for PDO 0xffffe000002a9a90 InstancePath is "STORAGE\Volume\{3007dfd3-df8d-11e3-824c-806e6f6e6963}#0000000000100000" ServiceName is "volsnap" TargetDeviceNotify List - f 0xffffc0000031b520 b 0xffffc0000008d0f0 State = DeviceNodeStarted (0x308) Previous State = DeviceNodeStartPostWork (0x307) ...使用
!devnode命令檢視裝置節點及其硬體資源:!devnode 0 9輸出類似於下列範例:
0:000>... DevNode 0xffffe000010fa770 for PDO 0xffffe000010c2060 InstancePath is "PCI\VEN_8086&DEV_2937&SUBSYS_2819103C&REV_02\3&33fd14ca&0&D0" ServiceName is "usbuhci" State = DeviceNodeStarted (0x308) Previous State = DeviceNodeEnumerateCompletion (0x30d) TranslatedResourceList at 0xffffc00003c78b00 Version 1.1 Interface 0x5 Bus #0 Entry 0 - Port (0x1) Device Exclusive (0x1) Flags (0x131) - PORT_MEMORY PORT_IO 16_BIT_DECODE POSITIVE_DECODE Range starts at 0x3120 for 0x20 bytes Entry 1 - DevicePrivate (0x81) Device Exclusive (0x1) Flags (0000) - Data - {0x00000001, 0x00000004, 0000000000} Entry 2 - Interrupt (0x2) Shared (0x3) Flags (0000) - LEVEL_SENSITIVE Level 0x8, Vector 0x81, Group 0, Affinity 0xf ...使用
!devnode命令檢視服務名稱為 「disk」 的裝置節點:!devnode 0 1 disk輸出類似於下列範例:
0: kd> !devnode 0 1 disk Dumping IopRootDeviceNode (= 0xffffe000002dbd30) DevNode 0xffffe0000114fd30 for PDO 0xffffe00001159610 InstancePath is "IDE\DiskST3250820AS_____________________________3.CHL___\5&14544e82&0&0.0.0" ServiceName is "disk" State = DeviceNodeStarted (0x308) Previous State = DeviceNodeEnumerateCompletion (0x30d) ...命令的
!devnode 0 1輸出會顯示節點實體裝置物件 (PDO) 的位址。Copy the address of a PDO, such as
0xffffe00001159610, and view the PDO details with the !devstack command. 將<PDO-address>部份取代為 PDO 資訊:!devstack <PDO-address>PDO
0xffffe00001159610線程的輸出會顯示下列裝置堆疊:0:000>0: kd> !devstack 0xffffe00001159610 !DevObj !DrvObj !DevExt ObjectName ffffe00001d50040 \Driver\partmgr ffffe00001d50190 ffffe00001d51450 \Driver\disk ffffe00001d515a0 DR0 ffffe00001156e50 \Driver\ACPI ffffe000010d8bf0Get information about the disk.sys driver object with the !drvobj command and the driver name "disk":
!drvobj disk 2輸出會顯示驅動程式物件的詳細資訊:
0:000>0: kd> !drvobj disk 2 Driver object (ffffe00001d52680) is for: \Driver\disk DriverEntry: fffff800006b1270 disk!GsDriverEntry DriverStartIo: 00000000 DriverUnload: fffff800010b0b5c CLASSPNP!ClassUnload AddDevice: fffff800010aa110 CLASSPNP!ClassAddDevice Dispatch routines: [00] IRP_MJ_CREATE fffff8000106d160 CLASSPNP!ClassGlobalDispatch [01] IRP_MJ_CREATE_NAMED_PIPE fffff80002b0ab24 nt!IopInvalidDeviceRequest [02] IRP_MJ_CLOSE fffff8000106d160 CLASSPNP!ClassGlobalDispatch [03] IRP_MJ_READ fffff8000106d160 CLASSPNP!ClassGlobalDispatch ... [1b] IRP_MJ_PNP fffff8000106d160 CLASSPNP!ClassGlobalDispatch命令的
!drvobj輸出會顯示分派例程的位址,例如CLASSPNP!ClassGlobalDispatch。 使用下列命令,在例程上ClassGlobalDispatch設定及驗證斷點:bu CLASSPNP!ClassGlobalDispatch bl輸入
g(Go) 以讓目標電腦執行。g當 Windows 呼叫
ClassGlobalDispatch例程時,目標計算機會進入調試程式。如果目標計算機未立即中斷調試程式,請在目標計算機上執行一些動作。或範例中,開啟 [記事本] 並儲存盤案。
使用下列命令檢視堆疊追蹤:
.reload
k
輸出類似於下列範例:
2: kd> k
Child-SP          RetAddr           Call Site
ffffd000`21d06cf8 fffff800`0056c14e CLASSPNP!ClassGlobalDispatch
ffffd000`21d06d00 fffff800`00f2c31d volmgr!VmReadWrite+0x13e
ffffd000`21d06d40 fffff800`0064515d fvevol!FveFilterRundownReadWrite+0x28d
ffffd000`21d06e20 fffff800`0064578b rdyboost!SmdProcessReadWrite+0x14d
ffffd000`21d06ef0 fffff800`00fb06ad rdyboost!SmdDispatchReadWrite+0x8b
ffffd000`21d06f20 fffff800`0085cef5 volsnap!VolSnapReadFilter+0x5d
ffffd000`21d06f50 fffff800`02b619f7 Ntfs!NtfsStorageDriverCallout+0x16
...
使用 qd (Quit and Detach) 命令結束偵錯工作階段。
qd
命令摘要
下列連結提供本文所述命令的詳細資訊。
- .sympath (設定符號路徑)
- .reload (重載模組)
- x (檢查符號)
- g (Go)
- dt (顯示類型)
- lm (列出載入的模組)
- k (顯示堆疊回溯)
- bu (設定斷點)
- bl (斷點清單)
- bc (斷點清除)
- !process
- !thread
- !devnode
- !devstack
- !drvobj
- qd(結束和中斷)
For more information about menu commands like Debug>Break and Help>Contents, see the Get started with WinDbg (user-mode) article.