在 Windows Server 2019 中,儲存空間直接存取會記錄,並儲存虛擬機器、伺服器、磁碟機、磁碟區、網路介面卡等大量 效能歷程記錄。 效能歷程記錄很容易在 PowerShell 中查詢和處理,因此您可以快速從 原始資料 移至問題的 實際答案 ,例如:
- 上周是否有任何 CPU 尖峰?
- 是否有任何實體磁碟表現出異常延遲?
- 哪些 VM 目前耗用最多的儲存體 IOPS?
- 我的網路頻寬是否已飽和?
- 此磁碟區何時會用盡可用空間?
- 在過去一個月中,哪些 VM 使用最多的記憶體?
Get-ClusterPerf Cmdlet 是針對指令碼所建置。 它會接受來自管線 Get-VM 或 Get-PhysicalDisk 等 Cmdlet 的輸入以處理關聯,而且您可以將輸出管線傳送至公用程式 Cmdlet,例如 Sort-Object、Where-Object和 Measure-Object,以快速撰寫功能強大的查詢。
本主題會提供並說明回答上述 6 個問題的 6 個範例指令碼。 這提供了一個模式,讓您在各種資料和時間範圍套用,以尋找尖峰、尋找平均值、繪製趨勢線、執行極端值偵測等。 它們會以免費入門程式碼的形式提供,讓您複製、擴充和重複使用。
Note
為了簡潔起見,範例指令碼會省略您可能預期高品質 PowerShell 程式碼的錯誤處理等事項。 它們主要是用於靈感和教育,而不是生產用途。
範例 1: CPU,我看到你嘍!
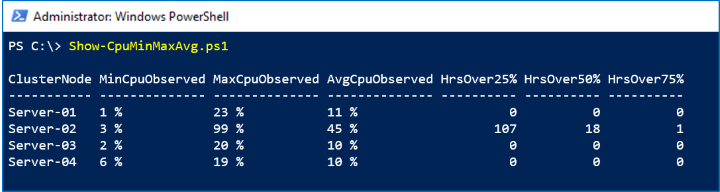
此範例會使用 ClusterNode.Cpu.Usage 時間範圍內的 LastWeek 數列來顯示叢集中每部伺服器的最大值 (「高水位標記」)、最小值和平均 CPU 使用量。 它也會進行簡單的四分位數分析,以顯示過去 8 天內 CPU 使用量超過 25%、50% 和 75% 的時數。
Screenshot
在下面的屏幕截圖中,我們看到 Server-02 上週出現了無法解釋的峰值:
運作方式
來自 Get-ClusterPerf 管線的輸出會順利管線傳送至內建的 Measure-Object Cmdlet,我們只指定 Value 屬性。 透過其 -Maximum、-Minimum和 -Average 旗標, Measure-Object 幾乎免費提供前三欄。 若要進行四分位數分析,我們可以將管線傳送至 Where-Object ,並計算有幾個值 -Gt (大於) 25、50 或 75。 最後一個步驟是美化 Format-Hours 和 Format-Percent 協助程式函式 – 這當然是選擇性的。
Script
以下是指令碼:
Function Format-Hours {
    Param (
        $RawValue
    )
    # Weekly timeframe has frequency 15 minutes = 4 points per hour
    [Math]::Round($RawValue/4)
}

Function Format-Percent {
    Param (
        $RawValue
    )
    [String][Math]::Round($RawValue) + " " + "%"
}

$Output = Get-ClusterNode | ForEach-Object {
    $Data = $_ | Get-ClusterPerf -ClusterNodeSeriesName "ClusterNode.Cpu.Usage" -TimeFrame "LastWeek"

    $Measure = $Data | Measure-Object -Property Value -Minimum -Maximum -Average
    $Min = $Measure.Minimum
    $Max = $Measure.Maximum
    $Avg = $Measure.Average

    [PsCustomObject]@{
        "ClusterNode"    = $_.Name
        "MinCpuObserved" = Format-Percent $Min
        "MaxCpuObserved" = Format-Percent $Max
        "AvgCpuObserved" = Format-Percent $Avg
        "HrsOver25%"     = Format-Hours ($Data | Where-Object Value -Gt 25).Length
        "HrsOver50%"     = Format-Hours ($Data | Where-Object Value -Gt 50).Length
        "HrsOver75%"     = Format-Hours ($Data | Where-Object Value -Gt 75).Length
    }
}

$Output | Sort-Object ClusterNode | Format-Table
範例 2: 引發、引發、延遲極端值
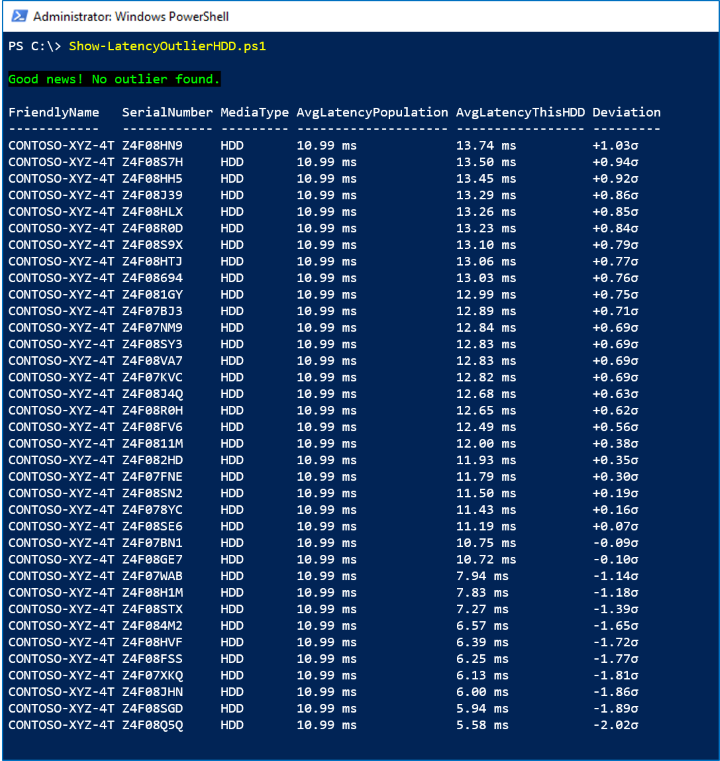
此範例會使用 PhysicalDisk.Latency.Average 時間範圍內的 LastHour 數列來尋找統計極端值,定義為每小時平均延遲超過總體平均值超過 3σ(三個標準差) 的磁碟機。
Important
為了簡潔起見,此指令碼不會針對低變異數實作保護,不會處理部分遺漏的資料,也不會區分模型或韌體等。請運用良好的判斷,不要只依賴此指令碼來判斷是否要更換硬碟。 這裡僅供教育之用。
Screenshot
在下列螢幕擷取畫面中,我們看到沒有極端值:
運作方式
首先,我們會檢查 PhysicalDisk.Iops.Total 是否一致地 -Gt 1,來排除閒置或幾乎閒置的磁碟機。 針對每個作用中的 HDD,我們會使用管線傳送其 LastHour 時間範圍,以 10 秒間隔進行 360 次度量,以 Measure-Object -Average 並在最後一小時內取得其平均延遲。 這會設定我們的人口。
我們實施廣 為人知的公式 來找到總體的平均值 μ 和標準差 σ 。 對於每個作用中的 HDD,我們會將其平均延遲與總體的平均值相比,並除以標準差。 我們會保留原始值,讓我們可以 Sort-Object 結果,但使用 Format-Latency 和 Format-StandardDeviation 協助程式函式來美化我們將顯示的項目 – 這當然是選擇性的。
如果有任何磁碟機超過 3σ,我們會以紅色 Write-Host;如果沒有,則以綠色表示。
Script
以下是指令碼:
Function Format-Latency {
    Param (
        $RawValue
    )
    $i = 0 ; $Labels = ("s", "ms", "μs", "ns") # Petabits, just in case!
    Do { $RawValue *= 1000 ; $i++ } While ( $RawValue -Lt 1 )
    # Return
    [String][Math]::Round($RawValue, 2) + " " + $Labels[$i]
}

Function Format-StandardDeviation {
    Param (
        $RawValue
    )
    If ($RawValue -Gt 0) {
        $Sign = "+"
    }
    Else {
        $Sign = "-"
    }
    # Return
    $Sign + [String][Math]::Round([Math]::Abs($RawValue), 2) + "σ"
}

$HDD = Get-StorageSubSystem Cluster* | Get-PhysicalDisk | Where-Object MediaType -Eq HDD

$Output = $HDD | ForEach-Object {

    $Iops = $_ | Get-ClusterPerf -PhysicalDiskSeriesName "PhysicalDisk.Iops.Total" -TimeFrame "LastHour"
    $AvgIops = ($Iops | Measure-Object -Property Value -Average).Average

    If ($AvgIops -Gt 1) { # Exclude idle or nearly idle drives

        $Latency = $_ | Get-ClusterPerf -PhysicalDiskSeriesName "PhysicalDisk.Latency.Average" -TimeFrame "LastHour"
        $AvgLatency = ($Latency | Measure-Object -Property Value -Average).Average

        [PsCustomObject]@{
            "FriendlyName"  = $_.FriendlyName
            "SerialNumber"  = $_.SerialNumber
            "MediaType"     = $_.MediaType
            "AvgLatencyPopulation" = $null # Set below
            "AvgLatencyThisHDD"    = Format-Latency $AvgLatency
            "RawAvgLatencyThisHDD" = $AvgLatency
            "Deviation"            = $null # Set below
            "RawDeviation"         = $null # Set below
        }
    }
}

If ($Output.Length -Ge 3) { # Minimum population requirement

    # Find mean μ and standard deviation σ
    $μ = ($Output | Measure-Object -Property RawAvgLatencyThisHDD -Average).Average
    $d = $Output | ForEach-Object { ($_.RawAvgLatencyThisHDD - $μ) * ($_.RawAvgLatencyThisHDD - $μ) }
    $σ = [Math]::Sqrt(($d | Measure-Object -Sum).Sum / $Output.Length)

    $FoundOutlier = $False

    $Output | ForEach-Object {
        $Deviation = ($_.RawAvgLatencyThisHDD - $μ) / $σ
        $_.AvgLatencyPopulation = Format-Latency $μ
        $_.Deviation = Format-StandardDeviation $Deviation
        $_.RawDeviation = $Deviation
        # If distribution is Normal, expect >99% within 3σ
        If ($Deviation -Gt 3) {
            $FoundOutlier = $True
        }
    }

    If ($FoundOutlier) {
        Write-Host -BackgroundColor Black -ForegroundColor Red "Oh no! There's an HDD significantly slower than the others."
    }
    Else {
        Write-Host -BackgroundColor Black -ForegroundColor Green "Good news! No outlier found."
    }

    $Output | Sort-Object RawDeviation -Descending | Format-Table FriendlyName, SerialNumber, MediaType, AvgLatencyPopulation, AvgLatencyThisHDD, Deviation

}
Else {
    Write-Warning "There aren't enough active drives to look for outliers right now."
}
範例 3: 吵雜的鄰居? 這就是寫!
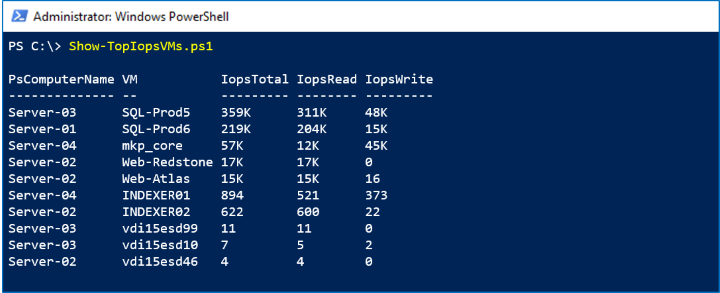
透過表現歷史,我們也可以把握關於一些當下問題的答案。 每 10 秒即可取得即時的新度量。 此範例會使用 VHD.Iops.Total 時間範圍中的 MostRecent 系列來識別在所有叢集的主機中,耗用最多儲存體 IOPS 的最忙碌 (有些人會說「最吵的」) 虛擬機器,並顯示其活動的讀取/寫入明細。
Screenshot
在下列螢幕擷取畫面中,我們會看到依儲存體活動排列前 10 部的虛擬機器:
運作方式
不同於 Get-PhysicalDisk, Get-VM Cmdlet 不會感知叢集,它只會在本機伺服器上傳回 VM。 若要平行查詢每部伺服器,我們會在 Invoke-Command (Get-ClusterNode).Name { ... } 中包裝呼叫。 針對每個 VM,我們會取得 VHD.Iops.Total、VHD.Iops.Read 和 VHD.Iops.Write 度量。 透過不指定 -TimeFrame 參數,每個參數我們可以獲得 MostRecent 個單一資料點。
Tip
這些系列會反映此 VM 活動的所有 VHD/VHDX 檔案的總和。 這是自動匯總效能歷程記錄的範例。 若要取得每個 VHD/VHDX 明細,您可以將個別 Get-VHD 管線傳送至 Get-ClusterPerf,而不是 VM。
每部伺服器的結果會聚集在一起作爲 $Output,我們可以 Sort-Object ,然後 Select-Object -First 10。 請注意,Invoke-Command 會使用 PsComputerName 屬性裝飾結果,指出其來自何處,我們可以列印以知道 VM 的執行位置。
Script
以下是指令碼:
$Output = Invoke-Command (Get-ClusterNode).Name {
    Function Format-Iops {
        Param (
            $RawValue
        )
        $i = 0 ; $Labels = (" ", "K", "M", "B", "T") # Thousands, millions, billions, trillions...
        Do { if($RawValue -Gt 1000){$RawValue /= 1000 ; $i++ } } While ( $RawValue -Gt 1000 )
        # Return
        [String][Math]::Round($RawValue) + " " + $Labels[$i]
    }

    Get-VM | ForEach-Object {
        $IopsTotal = $_ | Get-ClusterPerf -VMSeriesName "VHD.Iops.Total"
        $IopsRead  = $_ | Get-ClusterPerf -VMSeriesName "VHD.Iops.Read"
        $IopsWrite = $_ | Get-ClusterPerf -VMSeriesName "VHD.Iops.Write"
        [PsCustomObject]@{
            "VM" = $_.Name
            "IopsTotal" = Format-Iops $IopsTotal.Value
            "IopsRead"  = Format-Iops $IopsRead.Value
            "IopsWrite" = Format-Iops $IopsWrite.Value
            "RawIopsTotal" = $IopsTotal.Value # For sorting...
        }
    }
}

$Output | Sort-Object RawIopsTotal -Descending | Select-Object -First 10 | Format-Table PsComputerName, VM, IopsTotal, IopsRead, IopsWrite
範例 4: 正如他們所說,「25 gig 是新的 10 gig」
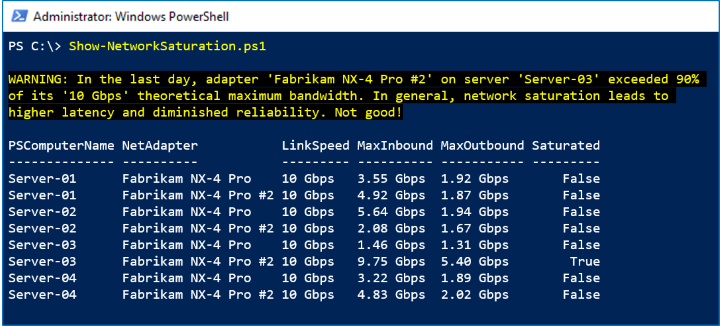
此範例會使用 NetAdapter.Bandwidth.Total 時間範圍內的 LastDay 數列來尋找網路飽和的跡象,定義為理論最大頻寬的 >90%。 對於叢集中的每個網路介面卡,它會比較過去一天觀察到的最高頻寬使用量和其陳述的連結速度。
Screenshot
在下列螢幕擷取畫面中,我們看到前一天有一個 Fabrikam NX-4 Pro #2 達到尖峰:
運作方式
我們重複上述的 Invoke-Command 技巧,在每個伺服器上 Get-NetAdapter,並管線傳送至 Get-ClusterPerf。 一路上,我們會擷取兩個相關的屬性: 其 LinkSpeed 字串,例如 「10 Gbps」,以及其原始 Speed 整數,例如 10000000000。 我們會使用 Measure-Object 從前一天取得平均值和尖峰值 (提醒: LastDay 時間範圍中的每個度量代表 5 分鐘),並乘以每位元組 8 個位元來取得 apples-to-apples 比較。
Note
某些廠商 (例如 Chelsio) 會在其 網路介面卡 效能計數器中包含遠端直接記憶體存取 (RDMA) 活動,因此包含在該 NetAdapter.Bandwidth.Total 系列中。 其他的廠商,例如 Mellanox,則可能不會這麽做。 如果您的廠商沒有這麽做,只要在此指令碼您的版本中新增 NetAdapter.Bandwidth.RDMA.Total 系列即可。
Script
以下是指令碼:
$Output = Invoke-Command (Get-ClusterNode).Name {

    Function Format-BitsPerSec {
        Param (
            $RawValue
        )
        $i = 0 ; $Labels = ("bps", "kbps", "Mbps", "Gbps", "Tbps", "Pbps") # Petabits, just in case!
        Do { $RawValue /= 1000 ; $i++ } While ( $RawValue -Gt 1000 )
        # Return
        [String][Math]::Round($RawValue) + " " + $Labels[$i]
    }

    Get-NetAdapter | ForEach-Object {

        $Inbound = $_ | Get-ClusterPerf -NetAdapterSeriesName "NetAdapter.Bandwidth.Inbound" -TimeFrame "LastDay"
        $Outbound = $_ | Get-ClusterPerf -NetAdapterSeriesName "NetAdapter.Bandwidth.Outbound" -TimeFrame "LastDay"

        If ($Inbound -Or $Outbound) {

            $InterfaceDescription = $_.InterfaceDescription
            $LinkSpeed = $_.LinkSpeed

            $MeasureInbound = $Inbound | Measure-Object -Property Value -Maximum
            $MaxInbound = $MeasureInbound.Maximum * 8 # Multiply to bits/sec

            $MeasureOutbound = $Outbound | Measure-Object -Property Value -Maximum
            $MaxOutbound = $MeasureOutbound.Maximum * 8 # Multiply to bits/sec

            $Saturated = $False

            # Speed property is Int, e.g. 10000000000
            If (($MaxInbound -Gt (0.90 * $_.Speed)) -Or ($MaxOutbound -Gt (0.90 * $_.Speed))) {
                $Saturated = $True
                Write-Warning "In the last day, adapter '$InterfaceDescription' on server '$Env:ComputerName' exceeded 90% of its '$LinkSpeed' theoretical maximum bandwidth. In general, network saturation leads to higher latency and diminished reliability. Not good!"
            }

            [PsCustomObject]@{
                "NetAdapter"  = $InterfaceDescription
                "LinkSpeed"   = $LinkSpeed
                "MaxInbound"  = Format-BitsPerSec $MaxInbound
                "MaxOutbound" = Format-BitsPerSec $MaxOutbound
                "Saturated"   = $Saturated
            }
        }
    }
}

$Output | Sort-Object PsComputerName, InterfaceDescription | Format-Table PsComputerName, NetAdapter, LinkSpeed, MaxInbound, MaxOutbound, Saturated
範例 5: 再次讓儲存體變得時尚!
爲了查看宏趨勢,效能歷程記錄會保留最多 1 年。 此範例會使用 Volume.Size.Available 時間範圍內的 LastYear 數列來判斷儲存體填滿的速率,以及估計何時會滿。
Screenshot
在下方的螢幕截圖中,我們看到 備份 卷每天大約增加 15 GB:
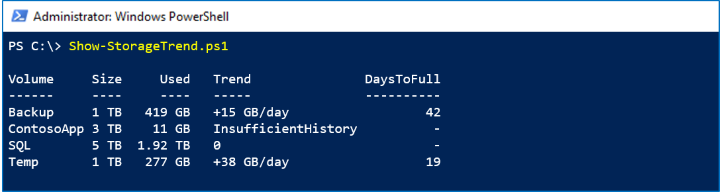
以這個速度,它將在 42 天以後達到其容量。
運作方式
LastYear 時間範圍每天有一個資料點。 雖然您只需要兩個點以符合趨勢線,但實際上最好需要更多點,例如 14 天。 我們用Select-Object -Last 14設定一個(x, y)的陣列,適用於x在 [1, 14] 的範圍內。 透過這些點,我們會實作簡單的 線性最小平方演算法 以尋找參數化最符合 $A 線的 $B 和 。 歡迎再次上高中。
將磁碟區的 SizeRemaining 屬性除以趨勢 (斜率 $A) 可讓我們粗略估計天數 (以目前儲存體成長的速率),直到磁碟區滿了為止。
Format-Bytes、Format-Trend和 Format-Days 協助程式函式會美化輸出。
Important
此估計值是線性的,且僅以最近 14 天的量測為基礎。 更複雜且精確的技術存在。 請運用良好的判斷,不要只依賴此指令碼來判斷是否要投資擴充儲存體。 這裡僅供教育之用。
Script
以下是指令碼:
Function Format-Bytes {
    Param (
        $RawValue
    )
    $i = 0 ; $Labels = ("B", "KB", "MB", "GB", "TB", "PB", "EB", "ZB", "YB")
    Do { $RawValue /= 1024 ; $i++ } While ( $RawValue -Gt 1024 )
    # Return
    [String][Math]::Round($RawValue) + " " + $Labels[$i]
}

Function Format-Trend {
    Param (
        $RawValue
    )
    If ($RawValue -Eq 0) {
        "0"
    }
    Else {
        If ($RawValue -Gt 0) {
            $Sign = "+"
        }
        Else {
            $Sign = "-"
        }
        # Return
        $Sign + $(Format-Bytes ([Math]::Abs($RawValue))) + "/day"
    }
}

Function Format-Days {
    Param (
        $RawValue
    )
    [Math]::Round($RawValue)
}

$CSV = Get-Volume | Where-Object FileSystem -Like "*CSV*"

$Output = $CSV | ForEach-Object {

    $N = 14 # Require 14 days of history

    $Data = $_ | Get-ClusterPerf -VolumeSeriesName "Volume.Size.Available" -TimeFrame "LastYear" | Sort-Object Time | Select-Object -Last $N

    If ($Data.Length -Ge $N) {

        # Last N days as (x, y) points
        $PointsXY = @()
        1..$N | ForEach-Object {
            $PointsXY += [PsCustomObject]@{ "X" = $_ ; "Y" = $Data[$_-1].Value }
        }

        # Linear (y = ax + b) least squares algorithm
        $MeanX = ($PointsXY | Measure-Object -Property X -Average).Average
        $MeanY = ($PointsXY | Measure-Object -Property Y -Average).Average
        $XX = $PointsXY | ForEach-Object { $_.X * $_.X }
        $XY = $PointsXY | ForEach-Object { $_.X * $_.Y }
        $SSXX = ($XX | Measure-Object -Sum).Sum - $N * $MeanX * $MeanX
        $SSXY = ($XY | Measure-Object -Sum).Sum - $N * $MeanX * $MeanY
        $A = ($SSXY / $SSXX)
        $B = ($MeanY - $A * $MeanX)
        $RawTrend = -$A # Flip to get daily increase in Used (vs decrease in Remaining)
        $Trend = Format-Trend $RawTrend

        If ($RawTrend -Gt 0) {
            $DaysToFull = Format-Days ($_.SizeRemaining / $RawTrend)
        }
        Else {
            $DaysToFull = "-"
        }
    }
    Else {
        $Trend = "InsufficientHistory"
        $DaysToFull = "-"
    }

    [PsCustomObject]@{
        "Volume"     = $_.FileSystemLabel
        "Size"       = Format-Bytes ($_.Size)
        "Used"       = Format-Bytes ($_.Size - $_.SizeRemaining)
        "Trend"      = $Trend
        "DaysToFull" = $DaysToFull
    }
}

$Output | Format-Table
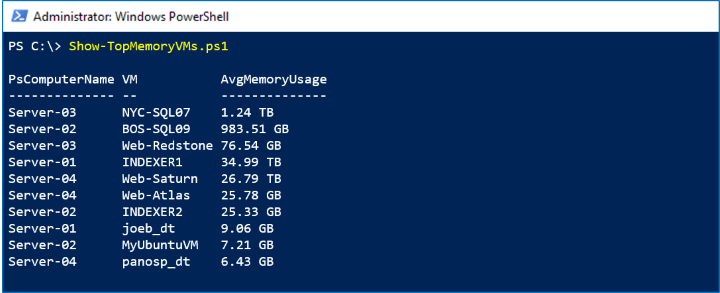
範例 6: 記憶體佔用,您跑得掉,但躲不了
因為效能歷程記錄會針對整個叢集集中收集並儲存,所以不論 VM 在主機之間移動多少次,您都不需要將不同機器的資料合併在一起。 此範例會使用 VM.Memory.Assigned 時間範圍中的 LastMonth 數系來識別在過去 35 天內耗用最多記憶體的虛擬機器。
Screenshot
在下列螢幕擷取畫面中,我們會看到依儲存體使用量排列前 10 部的虛擬機器:
運作方式
我們重複上述的 Invoke-Command 技巧,在每個伺服器上 Get-VM。 我們會使用 Measure-Object -Average 取得每個 VM 的每月平均值,然後 Sort-Object ,接著是 Select-Object -First 10 以取得我們的排行榜。 (或者也許這是我們的 頭號通緝 犯名單?
Script
以下是指令碼:
$Output = Invoke-Command (Get-ClusterNode).Name {
    Function Format-Bytes {
        Param (
            $RawValue
        )
        $i = 0 ; $Labels = ("B", "KB", "MB", "GB", "TB", "PB", "EB", "ZB", "YB")
        Do { if( $RawValue -Gt 1024 ){ $RawValue /= 1024 ; $i++ } } While ( $RawValue -Gt 1024 )
        # Return
        [String][Math]::Round($RawValue) + " " + $Labels[$i]
    }

    Get-VM | ForEach-Object {
        $Data = $_ | Get-ClusterPerf -VMSeriesName "VM.Memory.Assigned" -TimeFrame "LastMonth"
        If ($Data) {
            $AvgMemoryUsage = ($Data | Measure-Object -Property Value -Average).Average
            [PsCustomObject]@{
                "VM" = $_.Name
                "AvgMemoryUsage" = Format-Bytes $AvgMemoryUsage.Value
                "RawAvgMemoryUsage" = $AvgMemoryUsage.Value # For sorting...
            }
        }
    }
}

$Output | Sort-Object RawAvgMemoryUsage -Descending | Select-Object -First 10 | Format-Table PsComputerName, VM, AvgMemoryUsage
就是這樣! 希望這些範例能激勵您,並協助您開始使用。 透過儲存空間直接存取效能歷程記錄和功能強大的指令碼易記 Get-ClusterPerf Cmdlet,您可以提問和查看答案! – 管理及監視 Windows Server 2019 基礎結構時的複雜問題。
其他參考資料
- 開始使用 Windows PowerShell
- 儲存空間直接存取概觀 \(部分機器翻譯\)
- 性能歷史