Bemærk
Adgang til denne side kræver godkendelse. Du kan prøve at logge på eller ændre mapper.
Adgang til denne side kræver godkendelse. Du kan prøve at ændre mapper.
Azure Monitor alerts notify you so that you can respond quickly to critical issues. There are two types of alerts that you can define:
- Metric alerts based on Azure Monitor metric data
- Log alerts based on Azure Monitor Log Analytics data
For more information, see Choose the right type of alert rule.
You can create alert rules from metric charts in the metric explorer and from queries in Log Analytics. You can also define and manage alerts from the Monitoring > Alerts page. To learn more about alerts, see Overview of alerts in Microsoft Azure.
The Alerts page in the Monitoring section on your container app page displays all of your app's alerts. You can filter the list by alert type, resource, time, and severity. You can also modify and create new alert rules from this page.
Create metric alert rules
When you create alert rules based on a metric chart in the metrics explorer, alerts are triggered when the metric data matches alert rule conditions. For more information about creating metrics charts, see Using metrics explorer.
After you create a metric chart, you can create a new alert rule.
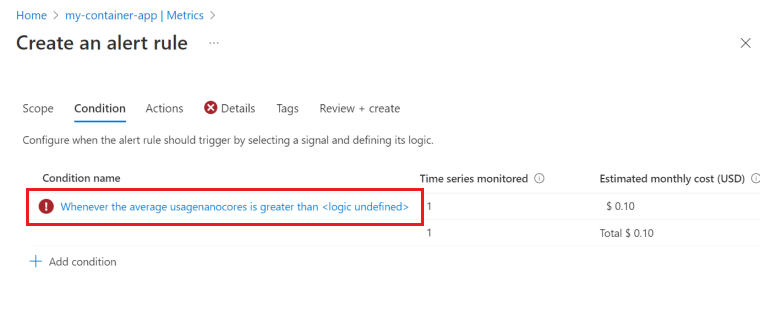
Select New alert rule. The Create an alert rule page is opened to the Condition tab. Here you find a condition that is populated with the metric chart settings.
Select the condition.
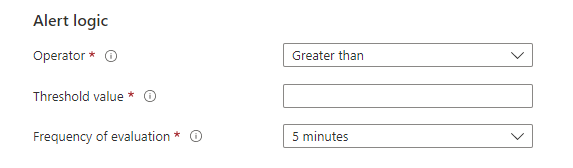
Modify the Alert logic section to set the alert criteria. You can set the alert to trigger when the metric value is greater than, less than, or equal to a threshold value. You can also set the alert to trigger when the metric value is outside of a range of values.
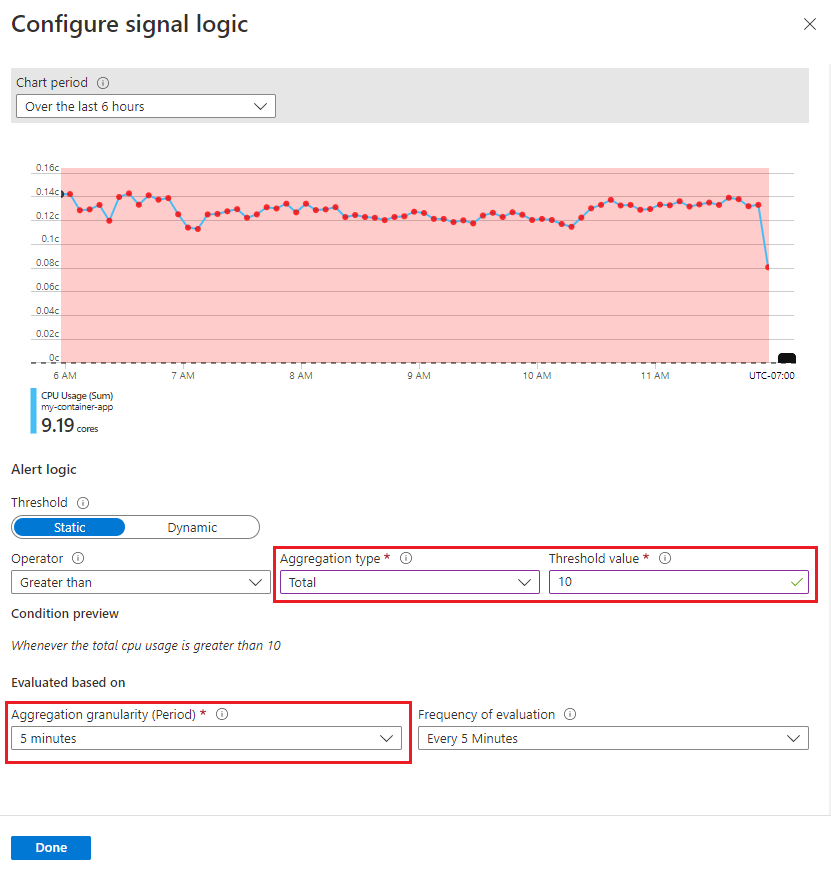
Select Done.
You can add more conditions to the alert rule by selecting Add condition on the Create an alert rule page.
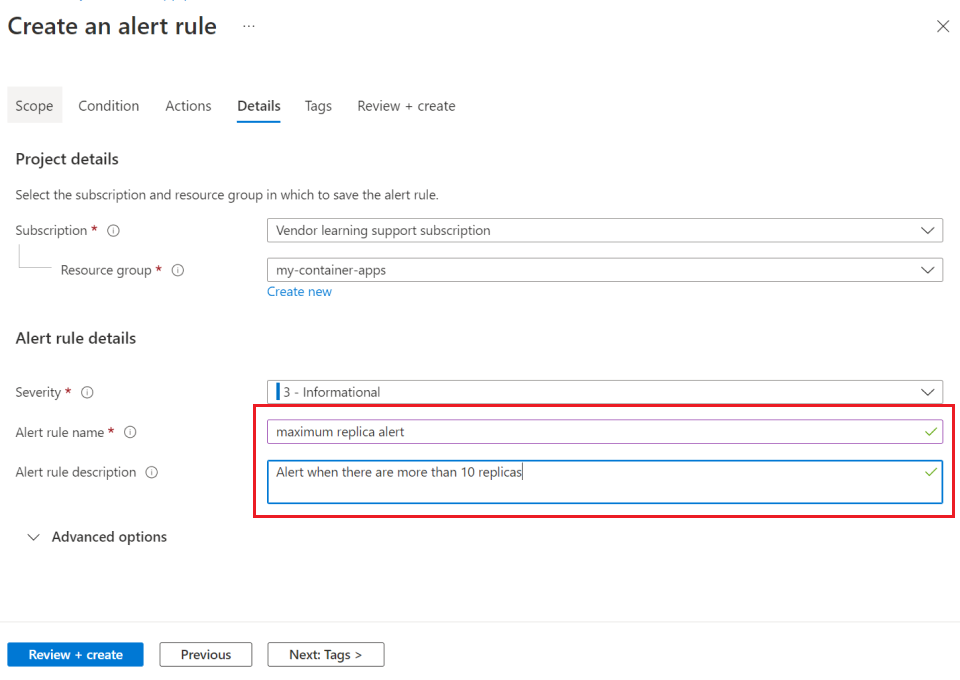
Select the Details tab.
Enter a name and description for the alert rule.
Select Review + create.
Select Create.
Add conditions to an alert rule
To add more conditions to your alert rule:
In your container app page, from the left menu, select Alerts.
From the top menu, select Alert rules.
Select an alert from the table.
Select Edit.
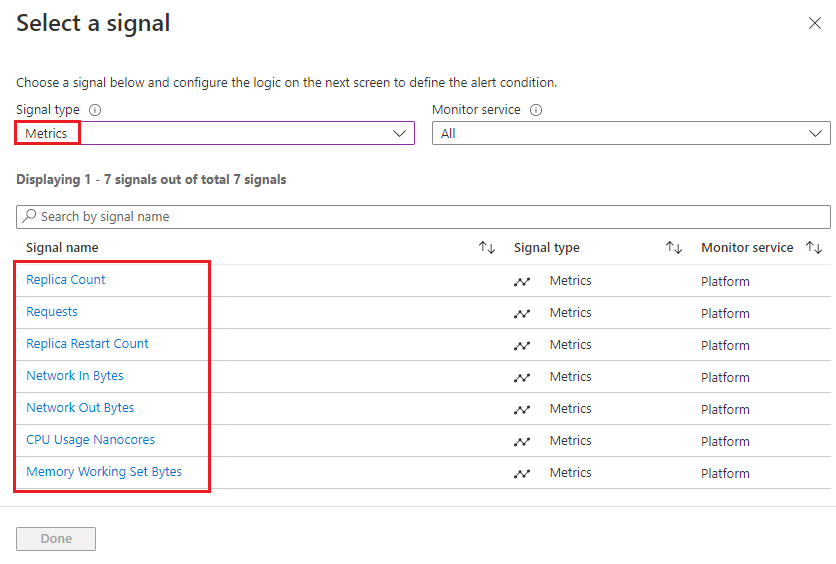
Select Condition, then scroll down and select Add condition.
Select a popular signal or select See all signals for more options.
Configure the settings for your alert condition. For more information about configuring alerts, see Create or edit a metric alert rule.
You can receive individual alerts for specific revisions or replicas by enabling alert splitting and selecting Revision or Replica from the Dimension name list.
Example of selecting a dimension to split an alert.

To learn more about configuring alerts, see Create a metric alert for an Azure resource.
Create log alert rules
You can create log alerts from queries in Log Analytics. When you create an alert rule from a query, the query is run at set intervals triggering alerts when the log data matches the alert rule conditions. To learn more about creating log alert rules, see Create or edit a log search alert rule.
To create an alert rule:
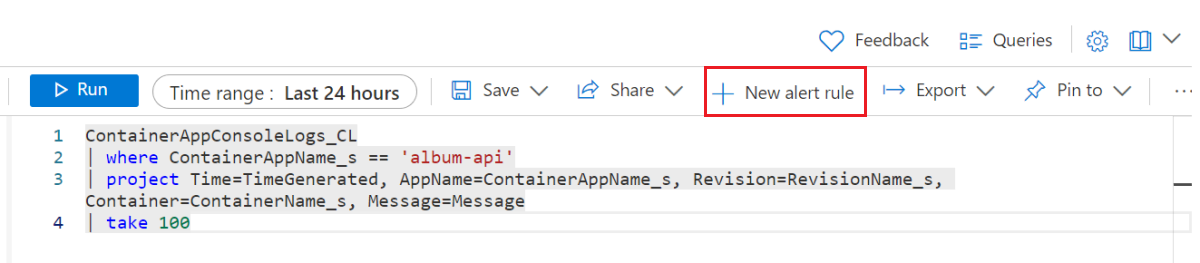
First, create the query and run it to validate the result.
Select New alert rule.
The Create an alert rule editor opens to the Condition tab, which is populated with your log query.
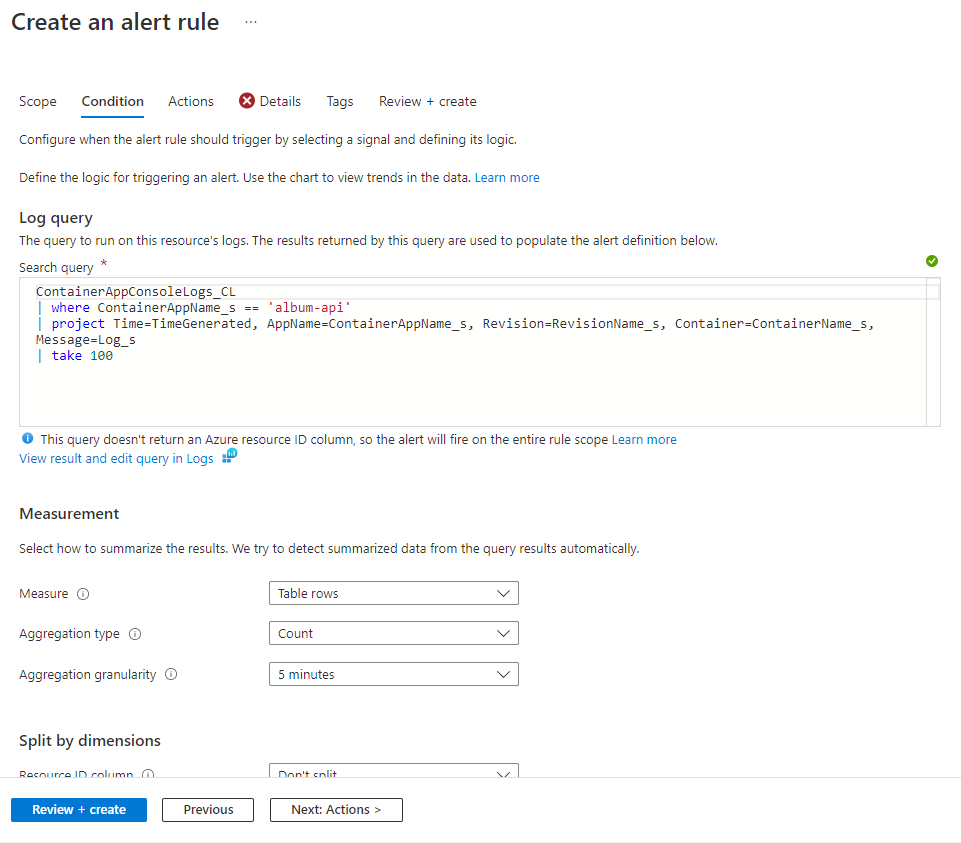
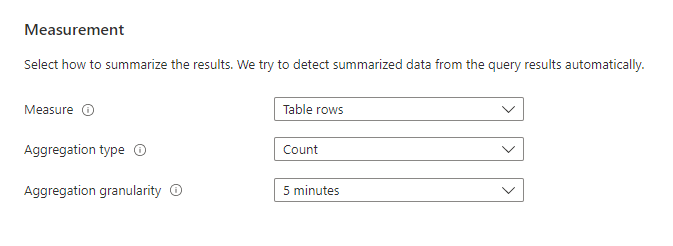
Configure the settings in the Measurement section
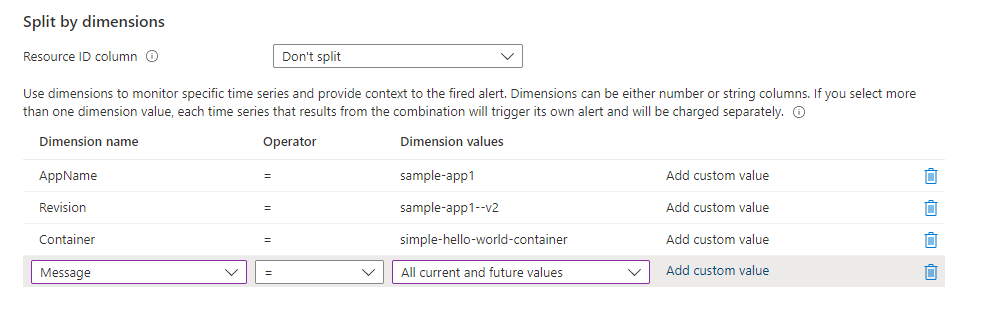
Optionally, you can enable alert splitting in the alert rule to send individual alerts for each dimension you select in the Split by dimensions section of the editor.
Enter the threshold criteria in the Alert logic section.
Select the Details tab.
Enter a name and description for the alert rule.
Select Review + create.
Select Create.
