Note
Access to this page requires authorization. You can try signing in or changing directories.
Access to this page requires authorization. You can try changing directories.
This article describes how to view and manage sensors with Microsoft Defender for IoT in the Azure portal.
Prerequisites
Before you can use the procedures in this article, you need to have network sensors onboarded to Defender for IoT. For more information, see:
View your sensors
All of your currently cloud-connected sensors, including both OT and Enterprise IoT sensors, are listed in the Sites and sensors page. For example:

Details about each sensor are listed in the following columns:
| Column name | Description |
|---|---|
| Sensor name | Displays the name that you assigned to the sensor during the registration. |
| Sensor type | Displays whether the sensor is an OT locally connected, OT cloud-connected, or an Enterprise IoT sensor. |
| Zone | Displays the zone that contains this sensor. |
| Subscription name | Displays the name of the Microsoft Azure account subscription that this sensor belongs to. |
| Sensor version | Displays the OT monitoring software version installed on your sensor. |
| Sensor health | Displays a sensor health message. For more information, see Understand sensor health. |
| Last connected (UTC) | Displays how long ago the sensor was last connected. |
| Threat Intelligence version | Displays the Threat Intelligence version installed on an OT sensor. The name of the version is based on the day the package was built by Defender for IoT. |
| Threat Intelligence mode | Displays whether the Threat Intelligence update mode is manual or automatic. Manual means that you can push newly released packages directly to sensors as needed. Otherwise, the new packages are automatically installed on all OT, cloud-connected sensors. |
| Threat Intelligence update status | Displays the update status of the Threat Intelligence package on an OT sensor. The status can be either Failed, In Progress, Update Available, or Ok. |
Site management options from the Azure portal
When onboarding a new OT sensor to the Defender for IoT, you can add it to a new or existing site. When working with OT networks, organizing your sensors into sites allows you to manage your sensors more efficiently and align to a Zero Trust strategy across your network.
Enterprise IoT sensors are all automatically added to the same site, named Enterprise network.
To edit a site from the Azure portal:
Select the site's name on the Sites and sensors page. In the Edit site pane that opens on the right, modify any of the following values:
Option Description Display name Enter a meaningful name for your site. Owner For OT sites only. Enter one or more email addresses for the user you want to designate as the owner of the devices at this site. The site owner is inherited by all devices at the site, and is shown on the IoT device entity pages and in incident details in Microsoft Sentinel.
In Microsoft Sentinel, use the AD4IoT-SendEmailtoIoTOwner and AD4IoT-CVEAutoWorkflow playbooks to automatically notify device owners about important alerts or incidents. For more information, see Investigate and detect threats for IoT devices.Tags (Optional) Enter values for the Key and Value fields for each new tag you want to add to your site. Select + Add to add a new tag. For OT sites only: To define specified permissions per site, select Manage site access control (Preview).
For example, you might do this as part of a Zero Trust security strategy to add a level of granularity to your Azure access policies. Defender for IoT sites generally reflect many devices grouped in a specific geographical location, such as the devices in an office building at a specific address.
For more information, see Manage site-based access control.
When you're done, select Save to save your changes.
Sensor management options from the Azure portal
Sensors that you've on-boarded to Defender for IoT are listed on the Defender for IoT Sites and sensors page. Select a specific sensor name to drill down to more details for that sensor.
Use the options on the Sites and sensor page and a sensor details page to do any of the following tasks. If you're on the Sites and sensors page, select multiple sensors to apply your actions in bulk using toolbar options. For individual sensors, use the Sites and sensors toolbar options, the ... options menu at the right of a sensor row, or the options on a sensor details page.
OT sensor updates
| Task | Description |
|---|---|
| OT sensors only. Run remote updates on OT sensors directly from the Azure portal, or download update packages to update manually. For more information, see Update Defender for IoT OT monitoring software. |
|
| OT sensors only. Available for bulk actions from the Sites and sensors toolbar, for individual sensors from the ... options menu, or from a sensor details page. For more information, see Threat intelligence research and packages. |
|
| Individual, OT sensors only. Available from the ... options menu or a sensor details page. Select Edit and then toggle the Automatic Threat Intelligence Updates (Preview) option on or off as needed. Select Submit to save your changes. |
Sensor deployment and access
| Task | Description |
|---|---|
| Individual, OT sensors only. Available from the ... options menu or a sensor details page. Enter the secret identifier obtained on the sensor's sign-in screen. |
|
| Individual, OT sensors only. Available from the ... options menu or a sensor details page. |
|
| For individual sensors only, from the ... options menu or a sensor details page. Select Edit, and then select a new zone from the Zone menu or select Create new zone. Select Submit to save your changes. |
|
| Download SNMP MIB file | Available from the Sites and sensors toolbar More actions menu. For more information, see Set up SNMP MIB health monitoring on an OT sensor. |
| Individual, Enterprise IoT sensors only. Available from the ... options menu or a sensor details page. Select Edit and then select Create activation command. For more information, see Install Enterprise IoT sensor software. |
|
| Download endpoint details | OT sensors only. Available from the Sites and sensors toolbar More actions menu. Download the list of endpoints that must be enabled as secure endpoints from OT network sensors. Make sure that HTTPS traffic is enabled over port 443 to the listed endpoints for your sensor to connect to Azure. Outbound allow rules are defined once for all OT sensors onboarded to the same subscription. To enable this option, select a sensor with a supported software version, or a site with one or more sensors with supported versions. |
Sensor maintenance and troubleshooting
| Task | Description |
|---|---|
| OT sensors only. Define selected sensor settings for one or more cloud-connected OT network sensors. For more information, see Define and view OT sensor settings from the Azure portal (Public preview). Other settings are also available directly from the OT sensor console. |
|
| Available from the Sites and sensors toolbar only, to download a CSV file with details about all the sensors listed. | |
| For individual sensors only, from the ... options menu or a sensor details page. | |
| Individual, locally managed OT sensors only. Available from the ... options menu. For more information, see Upload a diagnostics log for support. |
Retrieve forensics data stored on the sensor
Use Azure Monitor workbooks on an OT network sensor to retrieve forensic data from that sensor’s storage. The following types of forensic data are stored locally on OT sensors, for devices detected by that sensor:
- Device data
- Alert data
- Alert PCAP files
- Event timeline data
- Log files
Each type of data has a different retention period and maximum capacity. For more information, see Visualize Microsoft Defender for IoT data with Azure Monitor workbooks and Data retention across Microsoft Defender for IoT.
Reactivate an OT sensor
You may need to reactivate an OT sensor because you want to:
Work in cloud-connected mode instead of locally managed mode: After reactivation, existing sensor detections are displayed in the sensor console, and newly detected alert information is delivered through Defender for IoT in the Azure portal. This information can be shared with other Azure services, such as Microsoft Sentinel.
Work in locally managed mode instead of cloud-connected mode: After reactivation, sensor detection information is displayed only in the sensor console.
Associate the sensor to a new site: Re-register the sensor with new site definitions and use the new activation file to activate.
Change your plan commitment: If you make changes to your plan, such as changing your price plan from a trial to a monthly commitment, you need to reactivate your sensors to reflect the new changes.
In such cases, do the following steps:
- Delete your existing sensor.
- Onboard the sensor again, registering it with any new settings.
- Upload your new activation file.
Understand sensor health
This procedure describes how to view sensor health data from the Azure portal. Sensor health includes data such as whether traffic is stable, the sensor is overloaded, notifications about sensor software versions, and more.
To view overall sensor health:
From Defender for IoT in the Azure portal, select Sites and sensors and then check the overall health score in the widget above the grid. For example:
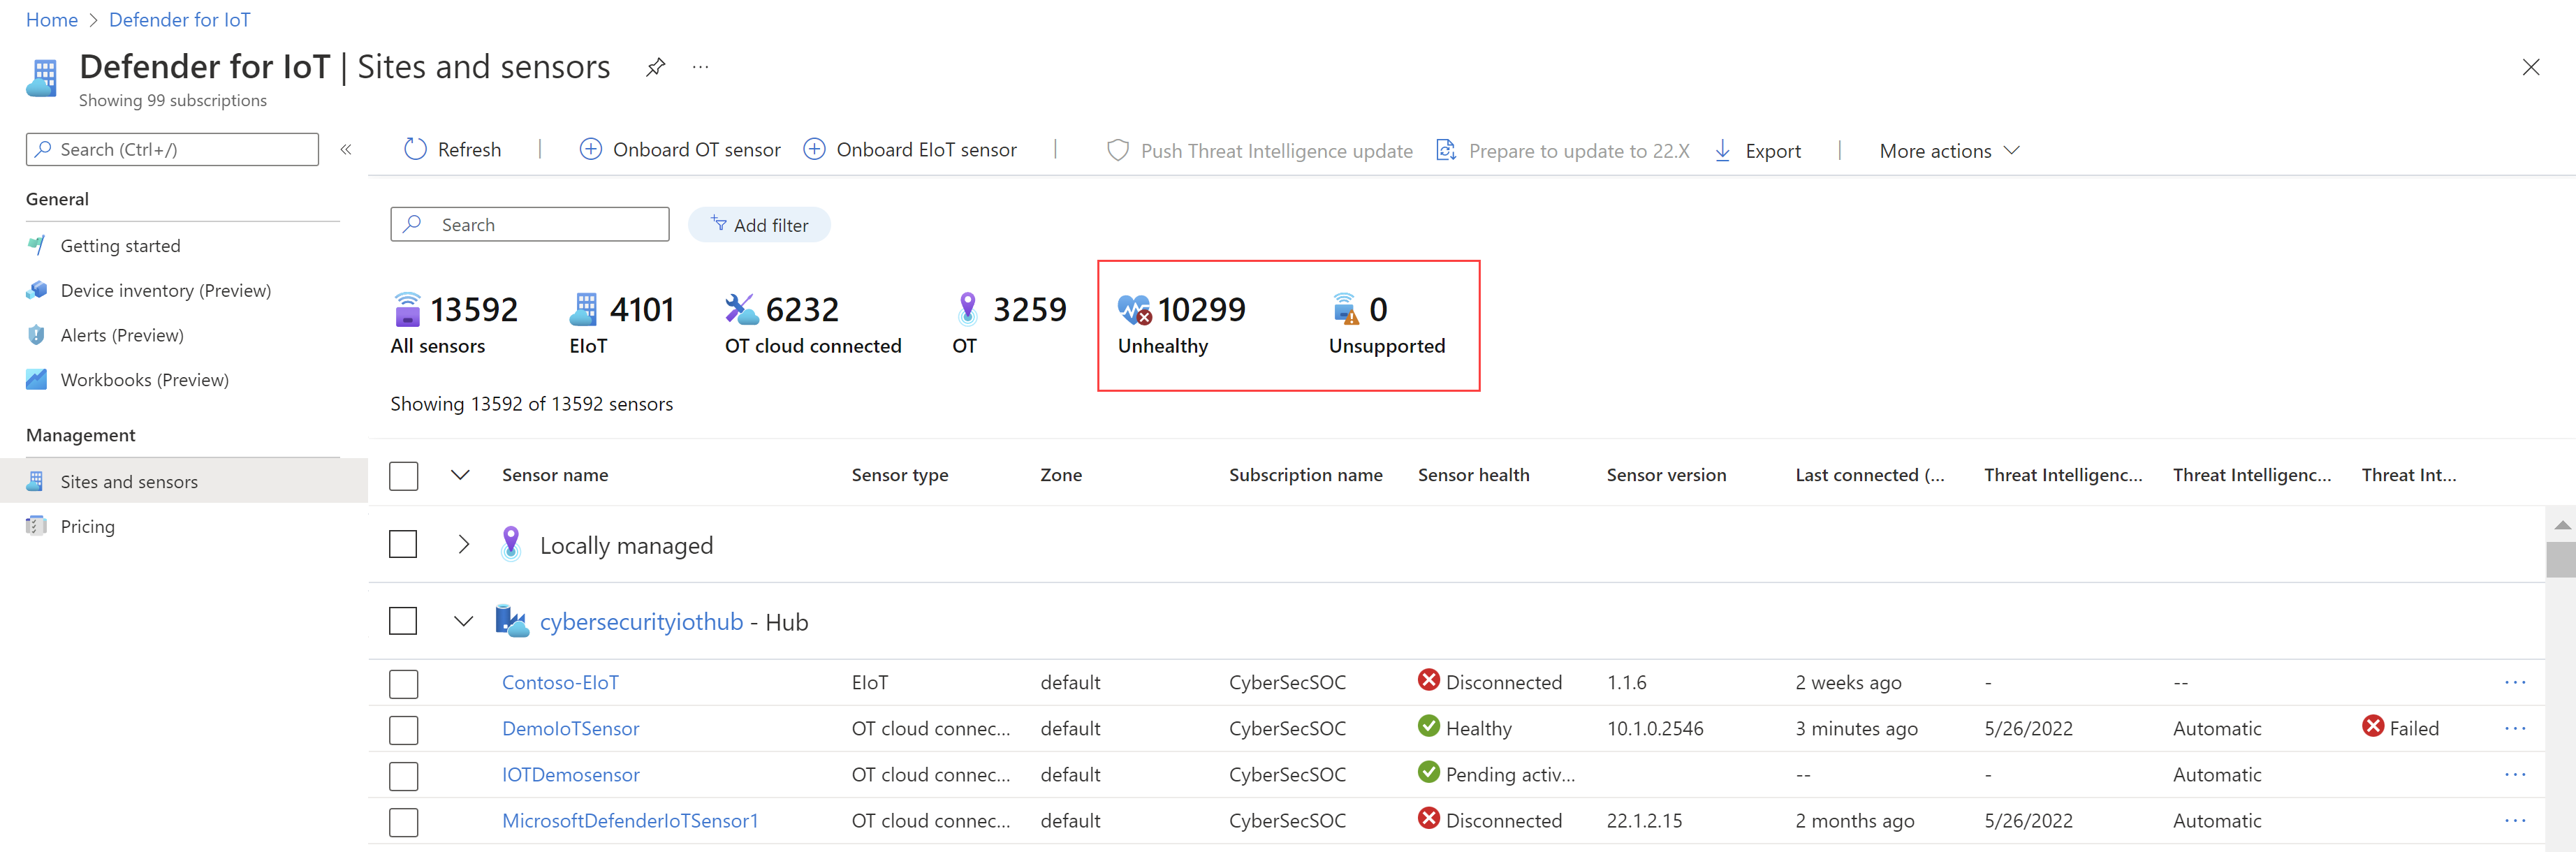
Unsupported means that the sensor has a software version installed that is no longer supported.
Unhealthy indicates one of the following scenarios:
- Sensor traffic to Azure isn't stable
- Sensor fails regular sanity tests
- No traffic detected by the sensor
- Sensor software version is no longer supported
- A remote sensor upgrade from the Azure portal fails
For more information, see our Sensor health message reference.
To check on specific sensor issues, filter the grid by sensor health, and select one or more issues to verify. For example:
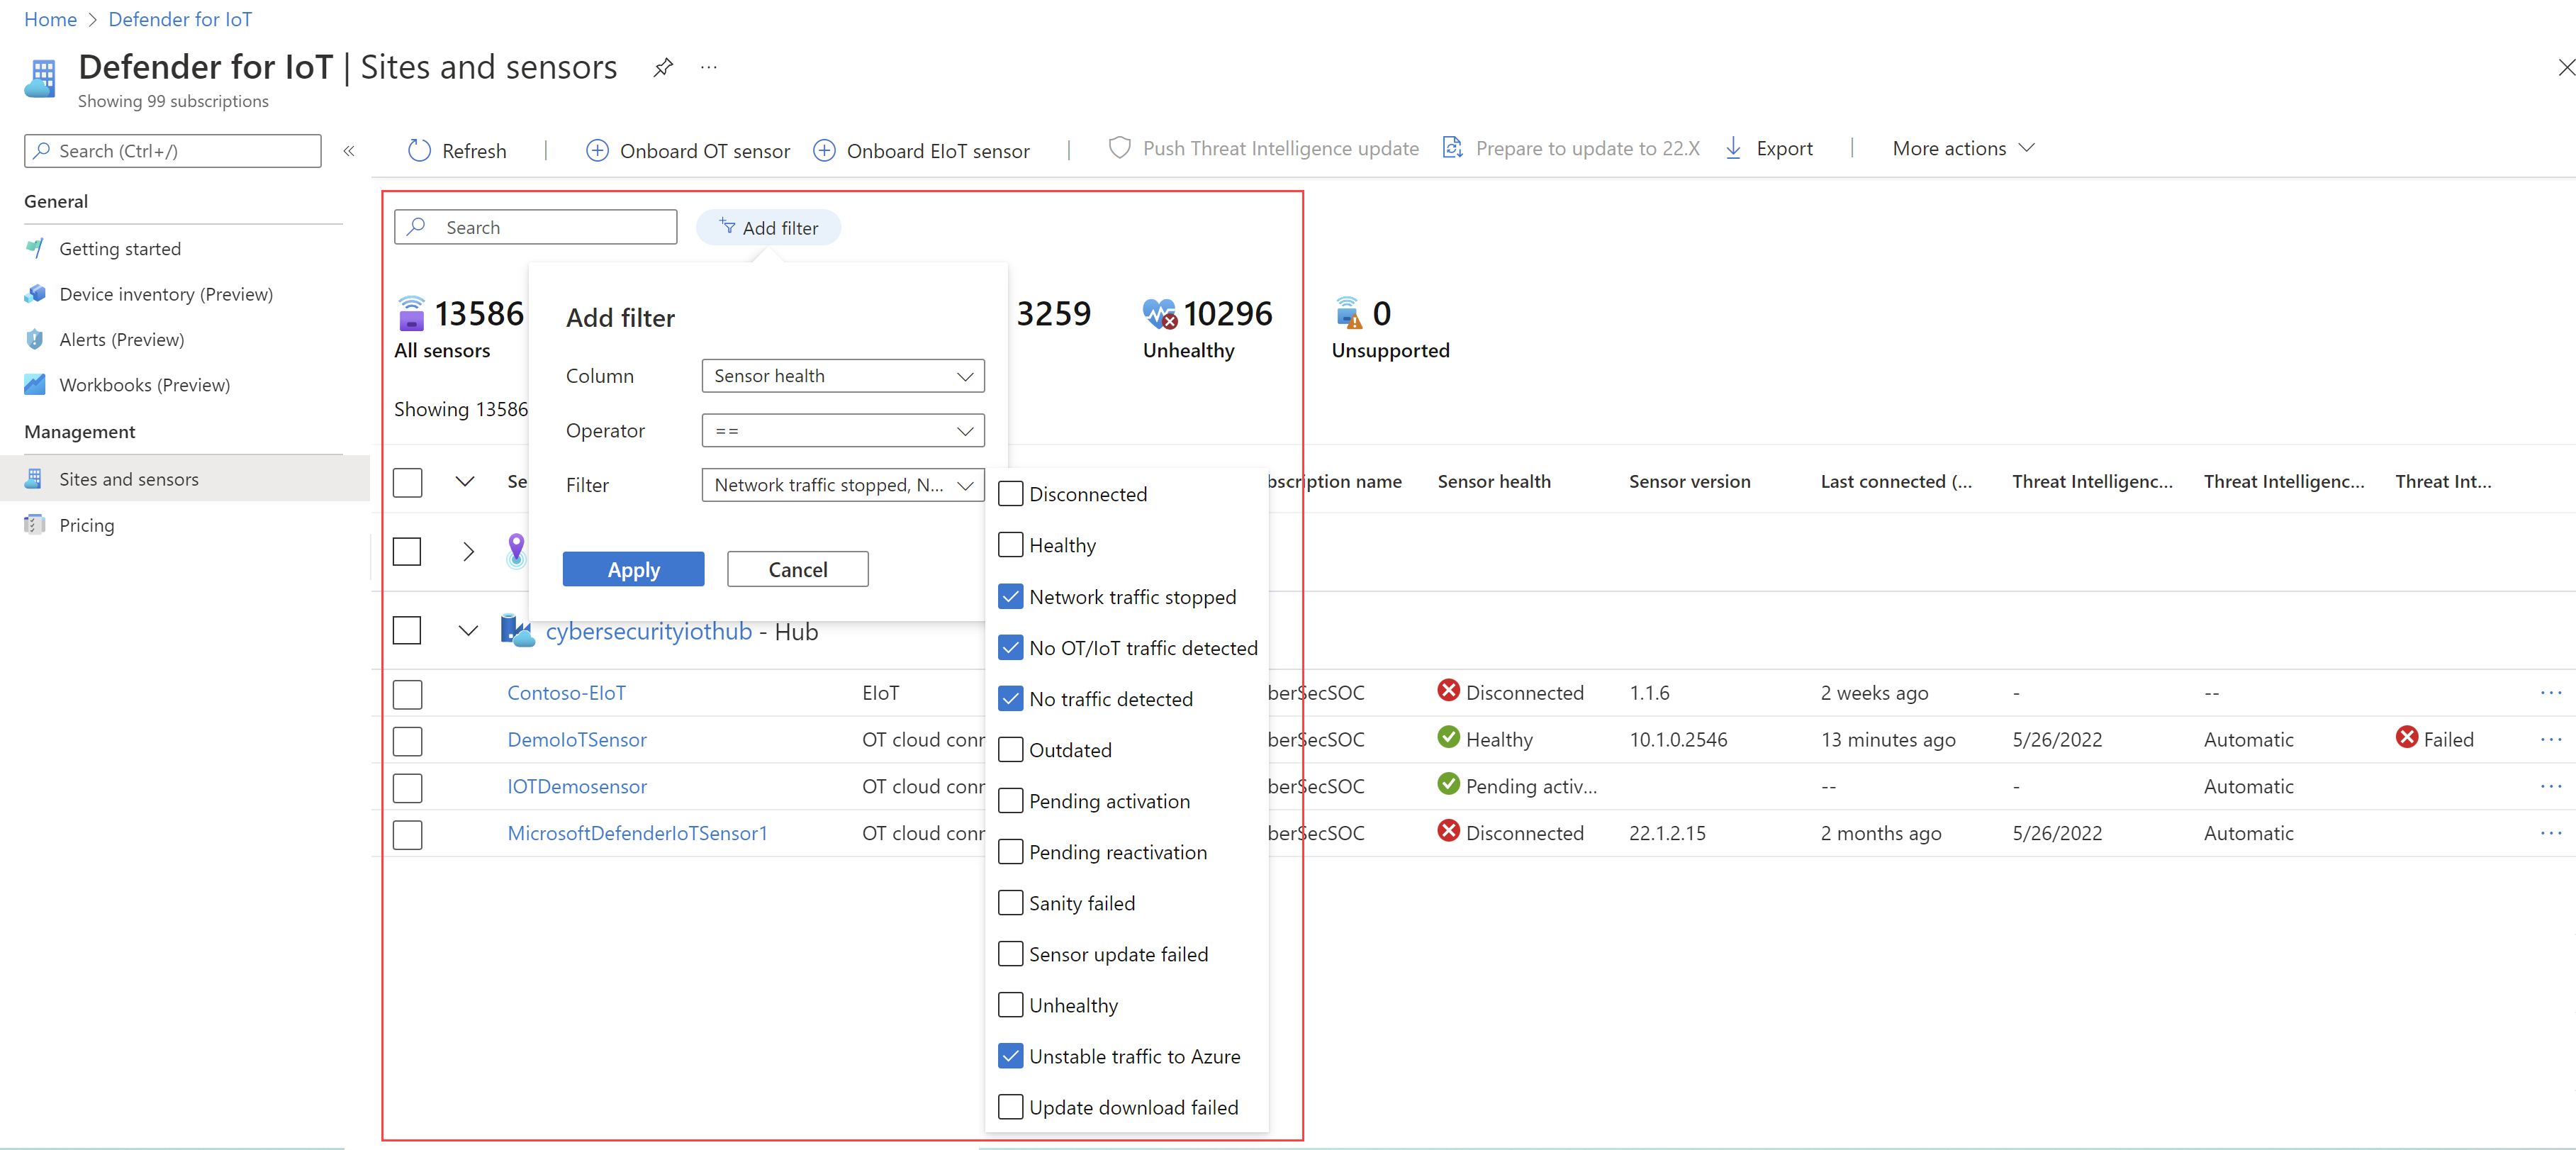
Expand the filtered sites and sensors now displayed in the grid, and use the Sensor health column to learn more at a high level.
To drill down further and understand recommended actions, select a sensor name to open the sensor details page.
For example:
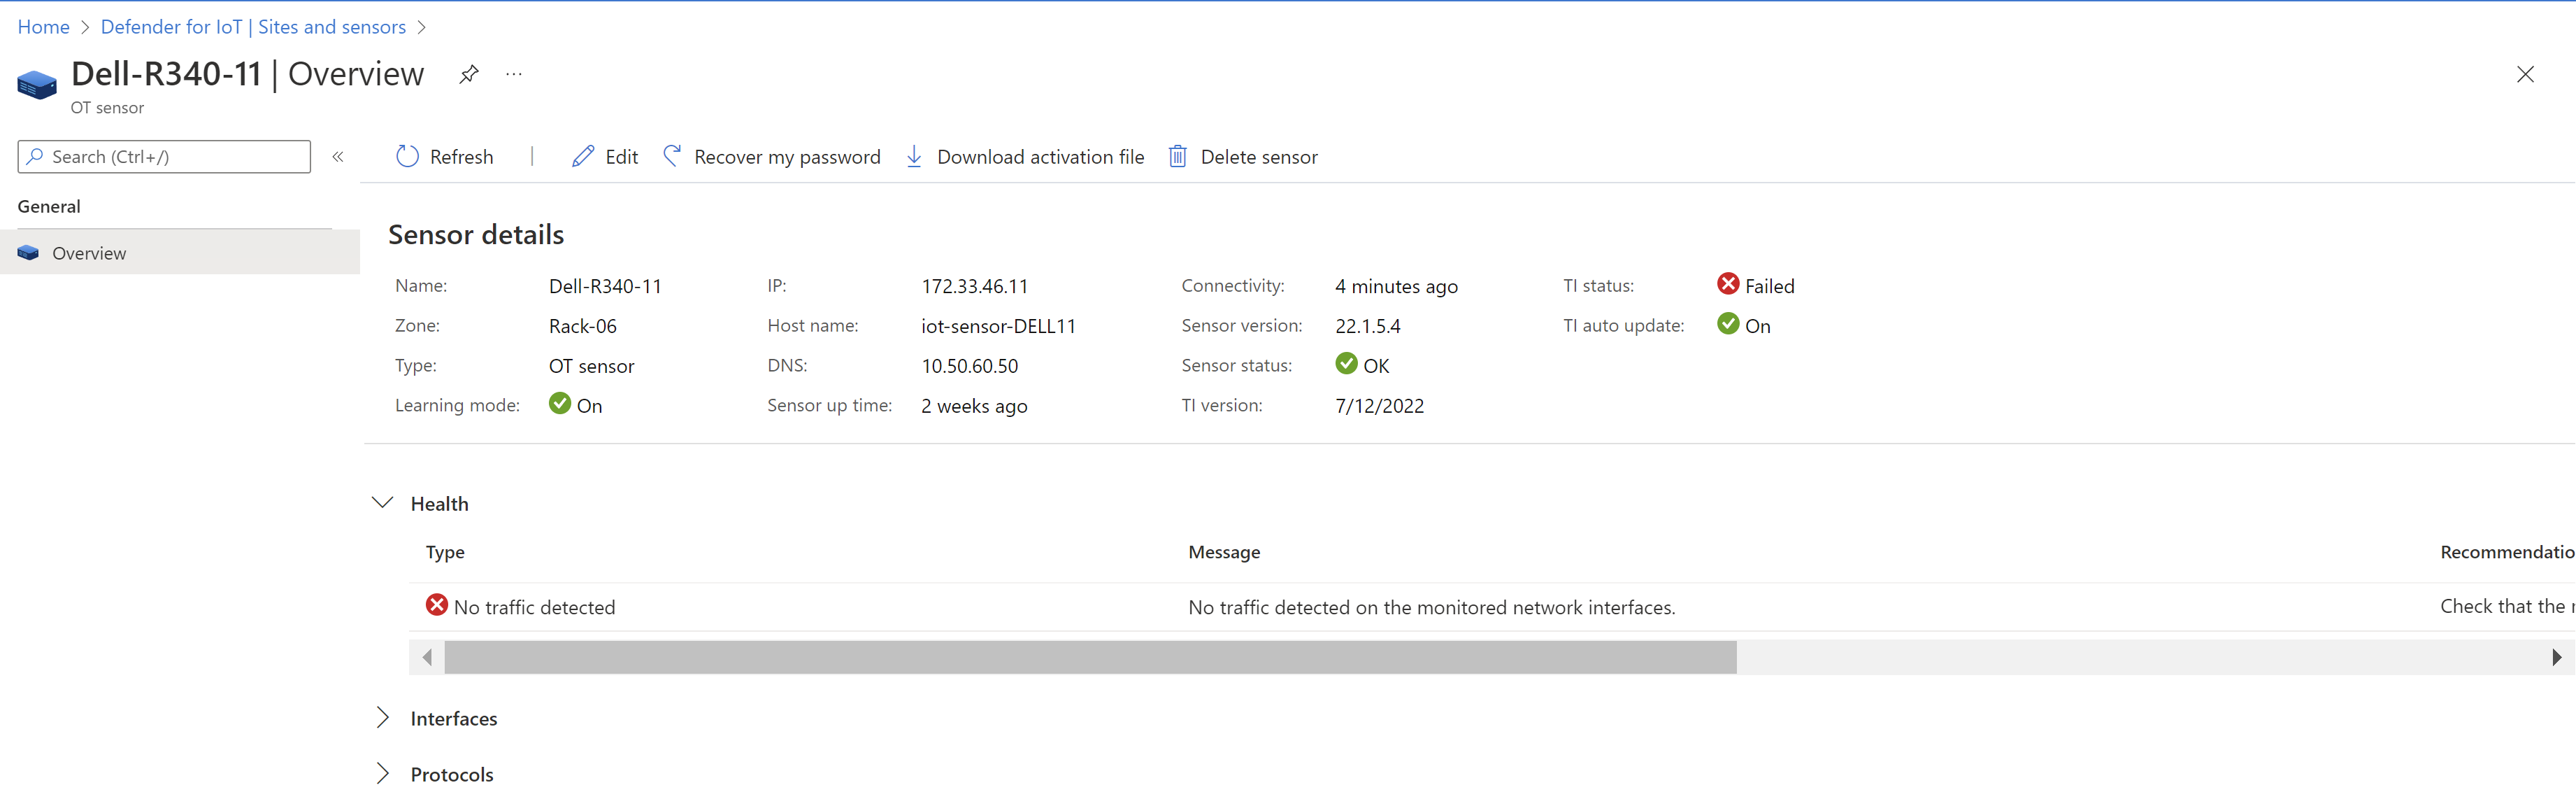
On the sensor details Overview page, expand the Health section and any messages listed there to learn more. The Recommendation column on the right lists recommended actions for handling the health issue.


For more information, see our Sensor health message reference.
Upload a diagnostics log for support
If you need to open a support ticket for a locally managed sensor, upload a diagnostics log to the Azure portal for the support team.
Tip
For cloud-connected sensors, the diagnostics log is automatically available to your support team when you open a support ticket.
To upload a diagnostics report:
Make sure you have the diagnostics report available for upload. For more information, see Download a diagnostics log for support.
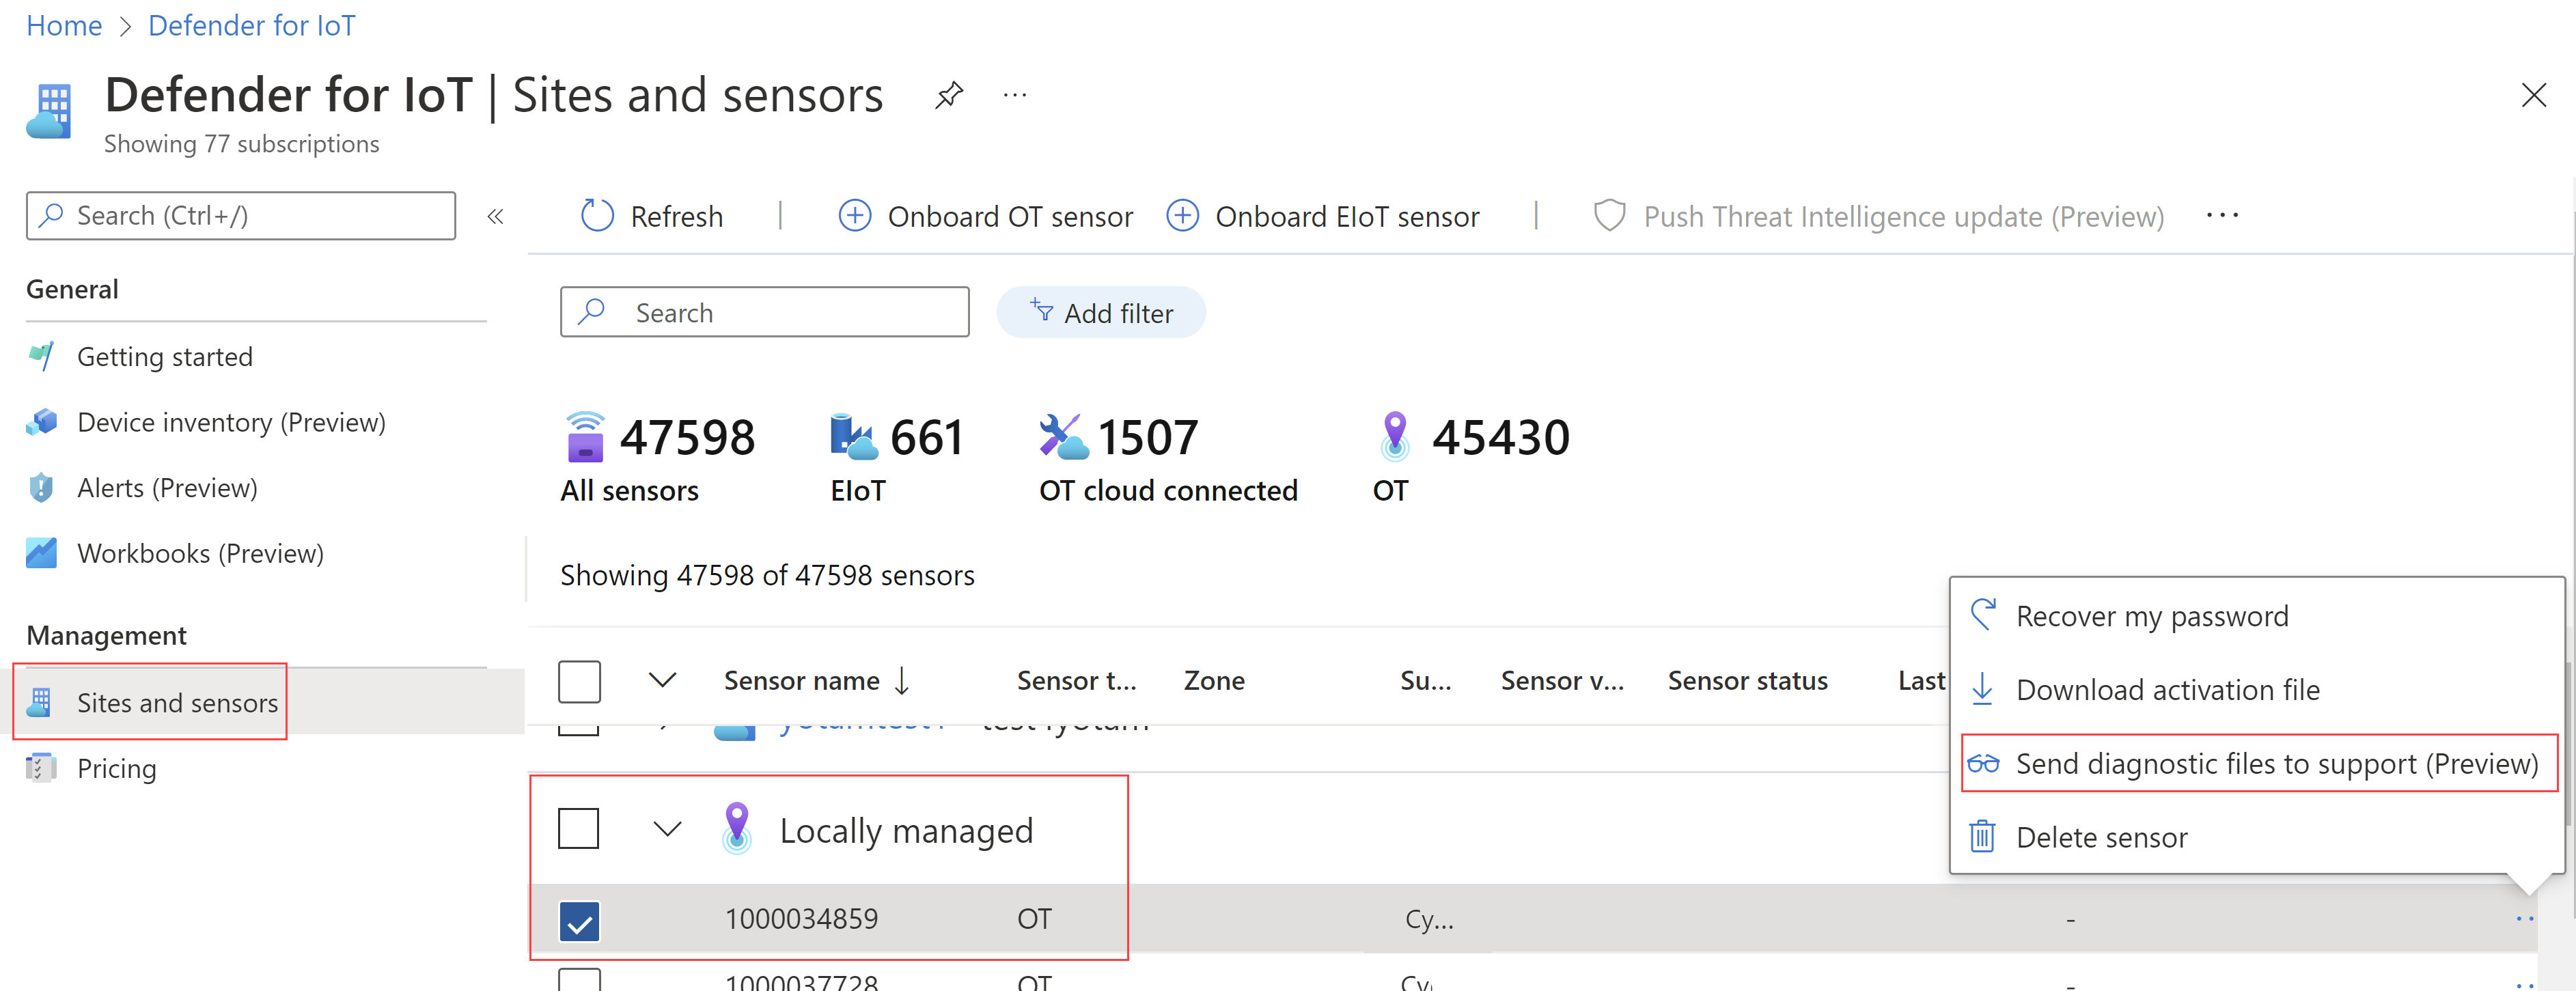
In Defender for IoT in the Azure portal, go to the Sites and sensors page and select the locally managed sensor that's related to your support ticket.
For your selected sensor, select the ... options menu on the right > Send diagnostic files to support. For example: