Create alerts for Azure SQL Managed Instance using the Azure portal
Applies to: ![]() Azure SQL Managed Instance
Azure SQL Managed Instance
This article shows you how to set up alerts for databases in Azure SQL Managed Instance using the Azure portal. This article also provides best practices for setting alert rules.
Set up new metric alert
You can receive an alert based on monitoring metrics for, or events on, your Azure services. For more information, see Metric alerts.
- Metric values - The alert triggers when the value of a specified metric crosses a threshold you assign.
- Activity log events - An alert can trigger on every event, or, only when a certain number of events occur.
- Resource health - An alert related to the resource health status events, including whether the event was platform or user-initiated.
- Log search - Log Analytics searches on captured log data, including custom log searches or prepared sample queries.
You can configure an alert to do the following when it triggers:
- Send email notifications to the service administrator and coadministrators
- Send email to additional emails that you specify, including for an Azure Resource Manager Role.
- Call a phone number with voice prompt
- Send text message to a phone number
- Send an Azure mobile app notification
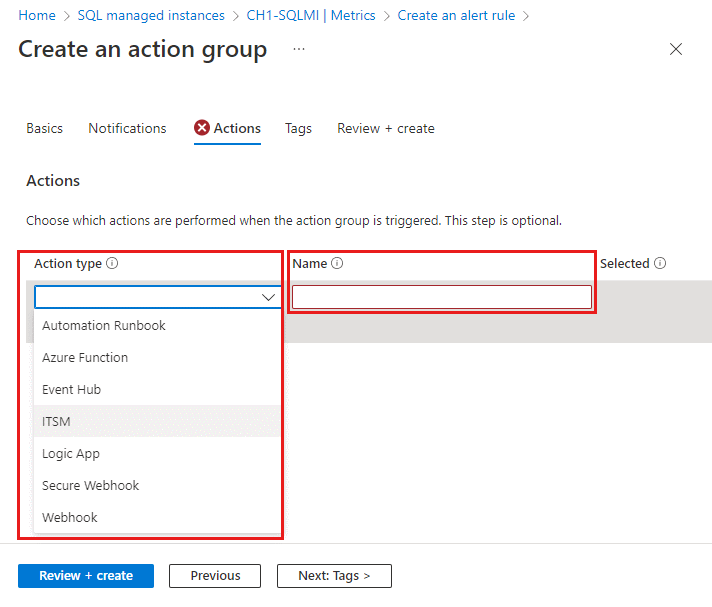
- Start an automation runbook
- Call an Azure Function
- Start an Event Hubs action
- Create an ITSM-compatible ticket
- Select a logic app action
- Call a webhook or a secure webhook
You can configure and get information about alert rules using:
- Azure portal, as detailed in this article.
- PowerShell
- Command-line interface (CLI)
- ARM template
- Azure Monitor REST API
Alert metrics available for Azure SQL Managed Instance
Important
Alerting metrics are available for the SQL managed instance only. Alerting metrics for individual databases in a SQL managed instance are not available. Database diagnostics telemetry is on the other hand available in the form of diagnostics logs. Alerts on diagnostics logs can be setup from within SQL Analytics product using log alert scripts for managed instance.
The following SQL managed instance metrics are available for alerting configuration:
| Metric | Description | Unit of measure or possible values |
|---|---|---|
| Average CPU percentage | Average percentage of CPU utilization in selected time period. | 0-100 (percent) |
| IO bytes read | IO bytes read in the selected time period. | Bytes |
| IO bytes written | IO bytes written in the selected time period. | Bytes |
| IO requests count | Count of IO requests in the selected time period. | Numerical |
| Storage space reserved | Current max. storage space reserved for the managed instance. Changes with resource scaling operation. | MB (Megabytes) |
| Storage space used | Storage space used in the selected period. Changes with storage consumption by databases and the instance. | MB (Megabytes) |
| Virtual core count | vCores provisioned for the managed instance. Changes with resource scaling operation. | 4-80 (vCores) |
Create an alert rule on a metric with the Azure portal
In the Azure portal, locate the managed instance you are interested in monitoring, and select it.
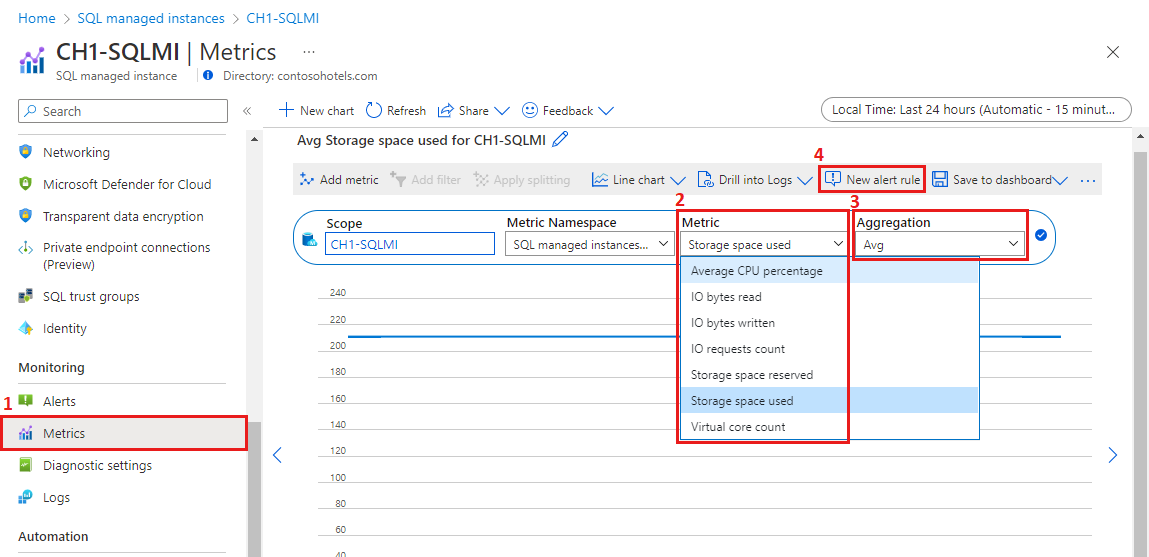
Select Metrics menu item in the Monitoring section.
On the Metric dropdown, select one of the metrics you wish to set up your alert on (Storage space used is shown in the example).
Use Aggregation to select the aggregation period - average, minimum, or maximum reached in the given time period (Avg, Min, or Max).
Select New alert rule.
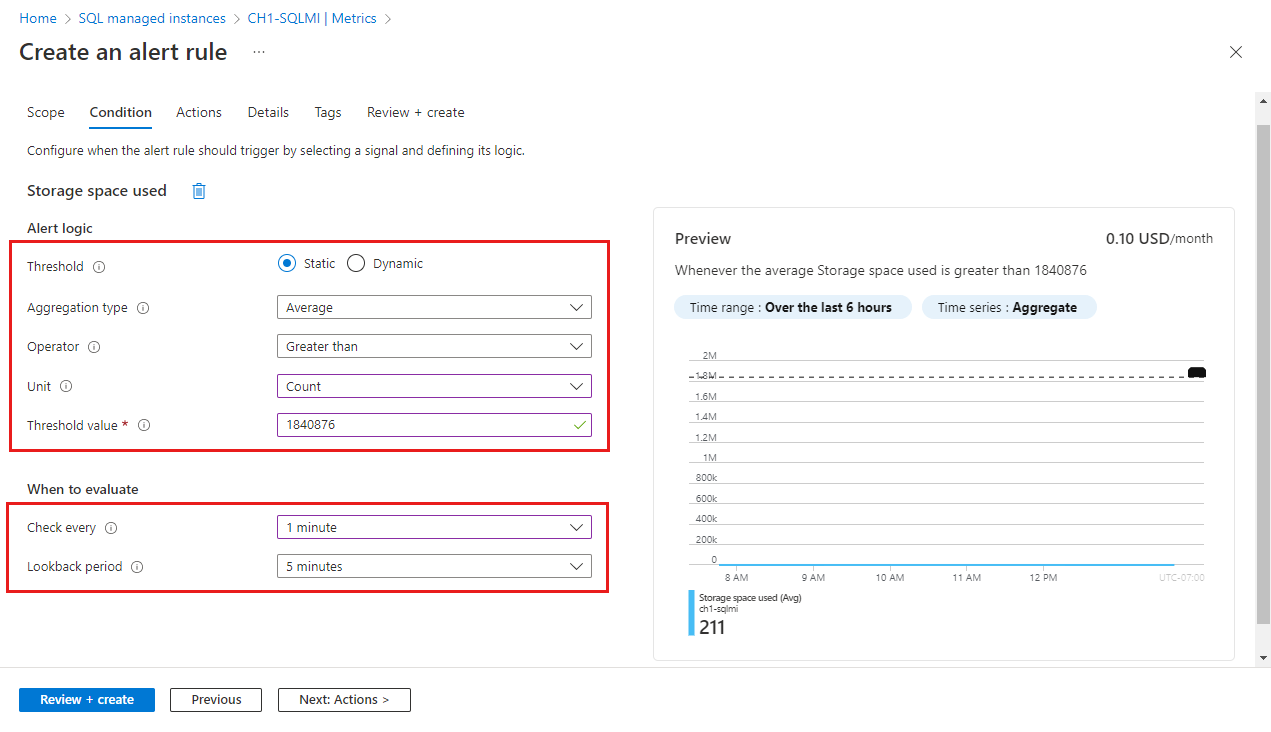
In the Alert logic section:
Field Description Threshold Select if threshold should be evaluated based on a static value or a dynamic value.
A static threshold evaluates the rule using the threshold value that you configure.
Dynamic Thresholds uses machine learning algorithms to continuously learn the metric behavior pattern and calculate the thresholds automatically. You can learn more about using dynamic thresholds for metric alerts.Aggregation type Aggregation type options are min, max or average (in the aggregation granularity period) Operator Select the operator for comparing the metric value against the threshold. Unit If the selected metric signal supports different units, such as bytes, KB, MB, and GB, and if you selected a static threshold, enter the unit for the condition logic. Threshold value If you selected a static threshold, enter the threshold value for the condition logic. The threshold value is the alert value that is evaluated based on the operator and aggregation criteria. Threshold sensitivity If you selected a dynamic threshold, enter the sensitivity level. The sensitivity level affects the amount of deviation from the metric series pattern is required to trigger an alert. Aggregation granularity Select the interval that is used to group the data points using the aggregation type function. Choose an Aggregation granularity (Period) that's greater than the Frequency of evaluation to reduce the likelihood of missing the first evaluation period of an added time series. Frequency of evaluation Select how often the alert rule is run. Select a frequency that is smaller than the aggregation granularity to generate a sliding window for the evaluation. In the When to evaluate section:
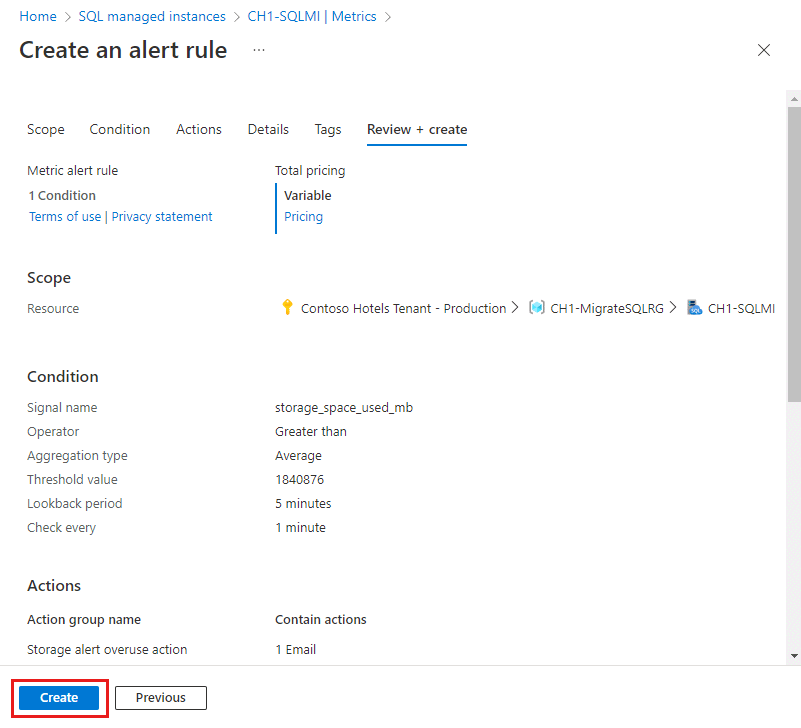
Field Description Check every Choose how often the alert rule checks if the condition is met. Lookback period Choose the lookback period, which is the time period to look back at each time the data is checked. For example, every 1 minute you'll be looking at the past 5 minutes. In the example shown in the screenshot, value of 1,840,876 MB is used representing a threshold value of 1.8 TB. As the operator in the example is set to greater than, the alert will be triggered if the storage space consumption on the SQL managed instance goes over 1.8 TB. The threshold value for storage space metrics must be expressed in MB.
Select Next: Actions > at the bottom of the page or the Actions tab.
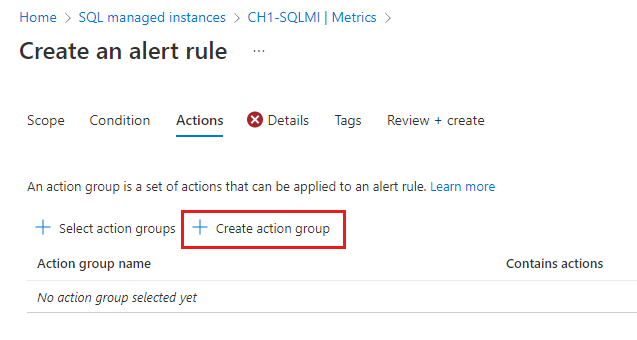
In the Actions tab, select or create the required action group. This action defines what happens upon triggering an alert (for example, sending an email or calling you on the phone). Select an existing Action group from the Select action groups pane, or Create action group in your subscription.
Select +Create action group.
Enter an Action group name and Display name and select the Region:
Option Behavior Global The action groups service decides where to store the action group. The action group is persisted in at least two regions to ensure regional resiliency. Processing of actions might be done in any geographic region.
Voice, SMS, and email actions performed as the result of service health alerts are resilient to Azure live-site-incidents.Regional The action group is stored within the selected region. The action group is zone-redundant. Processing of actions is performed within the region.
Use this option if you want to ensure that the processing of your action group is performed within a specific geographic boundary.
Select Next:Notifications> at the bottom of the page or the Notifications tab.
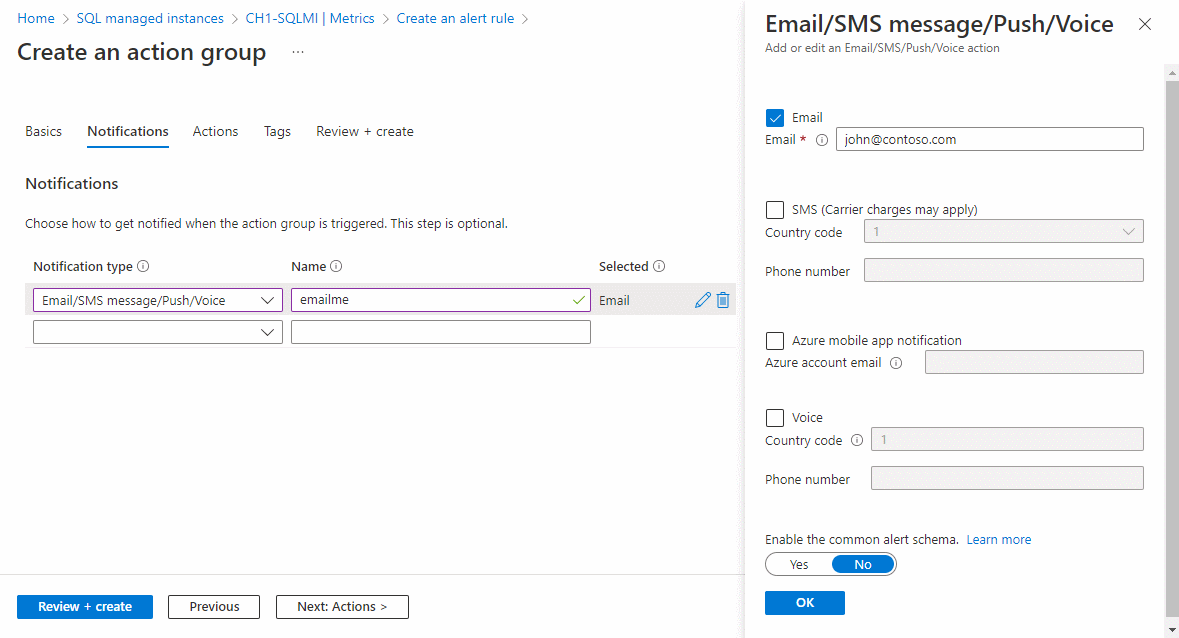
In the Notifications tab, define a notification to send when the alert is triggered.
Notification type: Select Email Azure Resource Manager Role to send an email to users who are assigned to certain subscription-level Azure Resource Manager roles or Email/SMS message/Push/Voice to send various notification types to specific recipients.
Name: Enter a unique name for the notification.
Details: Based on the selected notification type, enter an email address, phone number, or other information.
Common alert schema: You can choose to turn on the common alert schema, which provides the advantage of having a single extensible and unified alert payload across all the alert services in Monitor. For more information about this schema, see Common alert schema.
If you need to define a list of actions to trigger when an alert is triggered, select the Actions tab and define the actions.
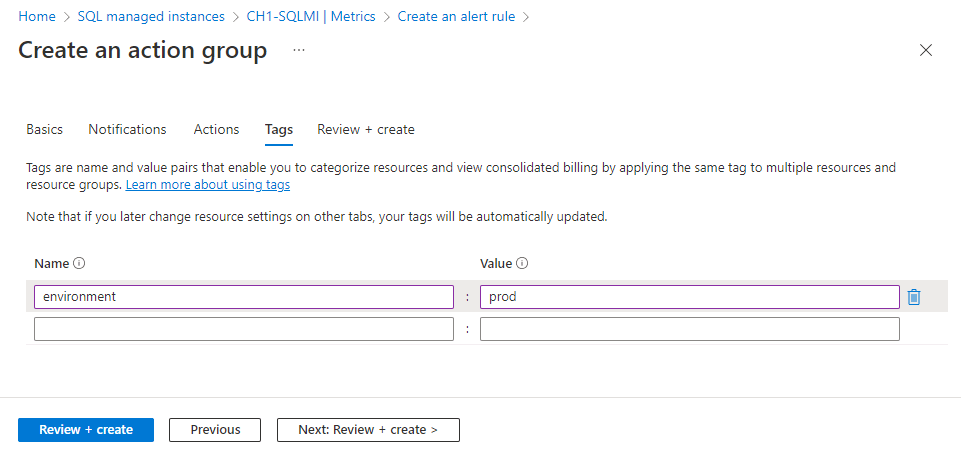
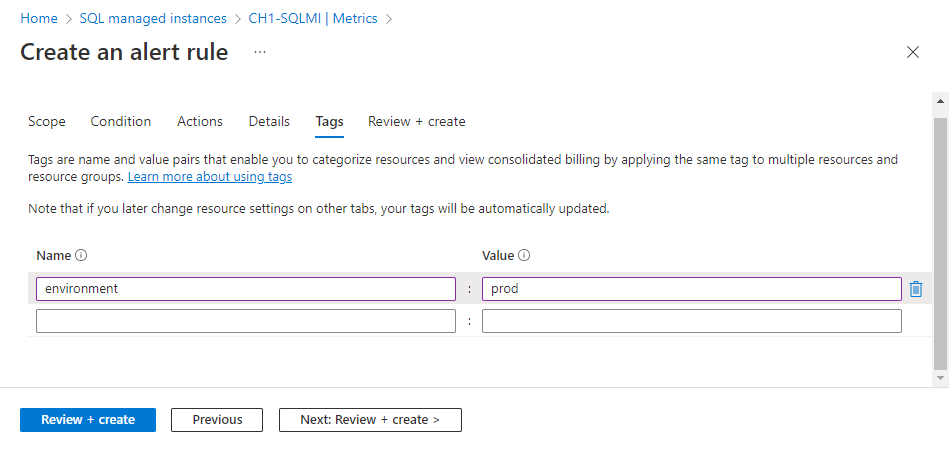
If you'd like to assign a key-value pair to the action group, select the Tags tab. Otherwise, skip this step. By using tags, you can categorize your Azure resources. Tags are available for all Azure resources, resource groups, and subscriptions.
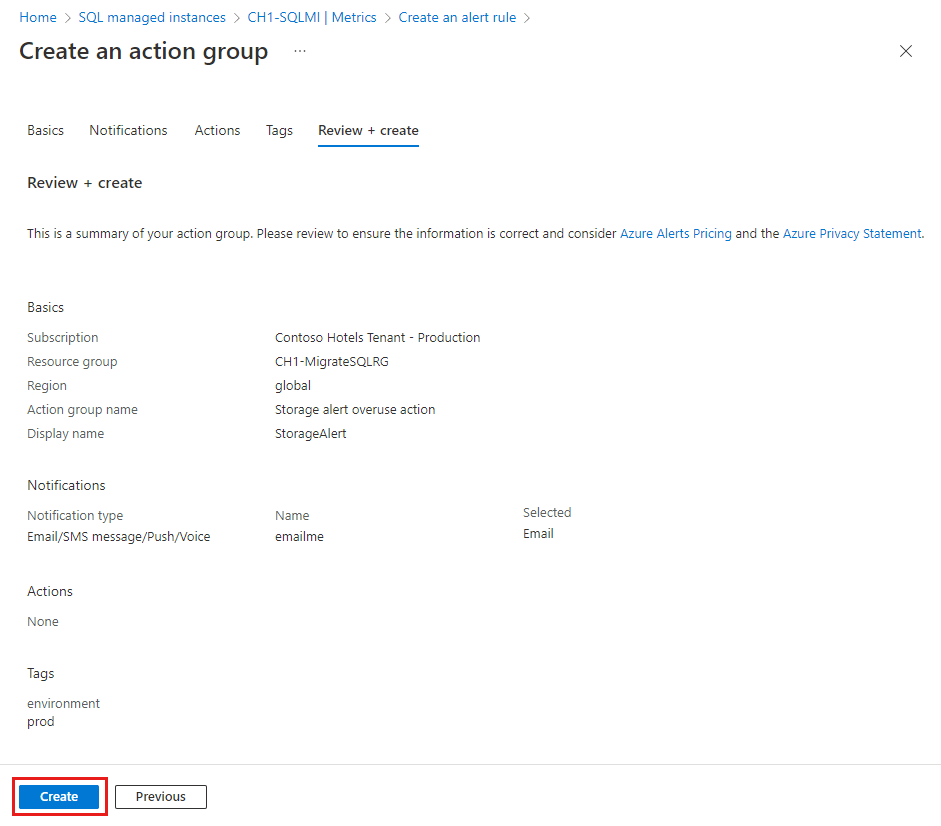
To review your settings, select the Review + create tab. This step quickly checks your inputs to make sure you've entered all required information. If there are issues, they're reported here. After you've reviewed the settings, select Create to create the action group.
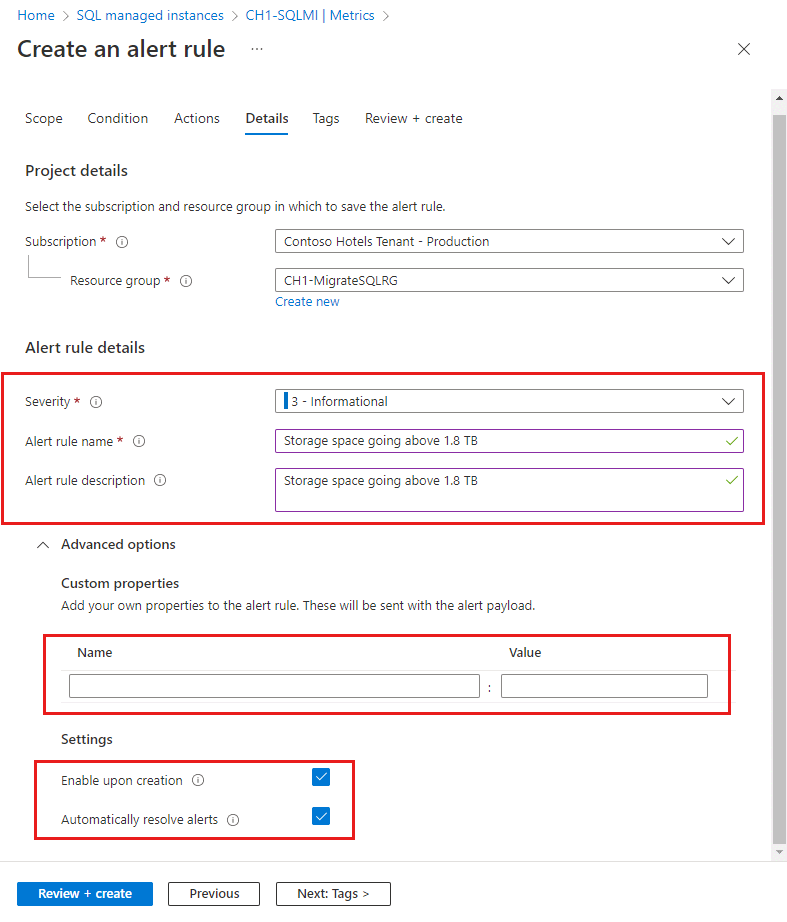
In the Details tab, fill in the alert rule details and settings for your records and select the severity type. You also have the option to use the Custom properties to add your own properties to the alert rule.
In the Tags tab, set any required tags on the alert rule resource. Otherwise, skip this step.
In the Review + create tab, a validation will run and inform you of any issues. When validation passes and you've reviewed the settings, select the Create button at the bottom of the page.


The new alert rule will become active within a few minutes and will be triggered based on your settings.
Create more alert rules in the Azure portal
You can also create alert rules on Activity log events, Resource health, and Log search for your SQL managed instance.
For more information, see:
- In the Azure portal, locate the resource you are interested in monitoring and select it.
- In the resource menu under Monitoring, select Alerts. The text and icon might vary slightly for different resources.
- Select the + Create button, then Alert rule.
- On the Create an alert rule page, the Scope is automatically configured to the resource.
Note
To avoid sprawl of many independent alerts, you may want to configure alerts for all resources of a type in a subscription, resource group, or an Azure SQL Database logical server. Use the Scope tab to change the scope of the new alert rule.
In Azure SQL Managed Instance, capture events and configure alerts for resource service health in the Resource health signal category.
On the Conditions pane, select See all signals.
On the Select a signal pane, select Resource health. Select Apply.
The Event status, Current resource status, Previous resource status, and Resource type dropdowns provide options to configure alerts for many possible resource health status changes. By default, all possible status and status changes are select, so that you can send alerts for the detection and resolution of service health problems.
Field Description Event status Select the statuses of Resource Health events. Values are Active, In Progress, Resolved, and Updated. Current resource status Select the current resource status. Values are Available, Degraded, and Unavailable. Previous resource status Select the previous resource status. Values are Available, Degraded, Unavailable, and Unknown. Reason type Select the causes of the Resource Health events. Values are Platform Initiated, Unknown, and User Initiated. Select Next: Actions >.
- Select an existing Action group from the Select action groups pane, or Create action group in your subscription. An action group enables you to define the action to be taken when an alert condition occurs. This action defines what happens upon triggering an alert (for example, sending an email).
- Alternatively, use the Use quick actions feature to create a new action group and provide an email or Azure mobile app notification target.
- Select Next: Details >.
- Provide a Subscription and Resource group.
- By default, an alert rule's severity is 3 - Informational. You can adjust the alert rule's Severity as desired.
- Provide the Alert rule name. Optionally but recommended, provide a description.
- Provide a Region for the alert rule.
- Choose an Identity for the alert rule. You can opt to have the alert rule use the System assigned managed identity (SAMI), User assigned managed identity (UAMI). For more information, see Identity.
- Under Advanced options:
- Make sure Enable upon creation for the alert rule to start running as soon as you're done creating it.
- The Automatically resolve alerts options is enabled by default. This will make the alert stateful, which means that the alert is resolved when the condition isn't met anymore.
- Select Next: Tags >.
- Consider using Azure tags. For example, the "Owner" or "CreatedBy" tag to identify who created the resource, and the "Environment" tag to identify whether this resource is in production, development, etc. For more information, see Develop your naming and tagging strategy for Azure resources.
- Select Review + create.
- Select Create. Soon, the alert is active.
Verify alerts
Note
To suppress noisy alerts, see Suppression of alerts using action rules.
Upon setting up an alerting rule, verify that you are satisfied with the alerting trigger and its frequency. For the example shown on this page for setting up an alert on storage space used, if your alerting option was email, you might receive an email such as the following:
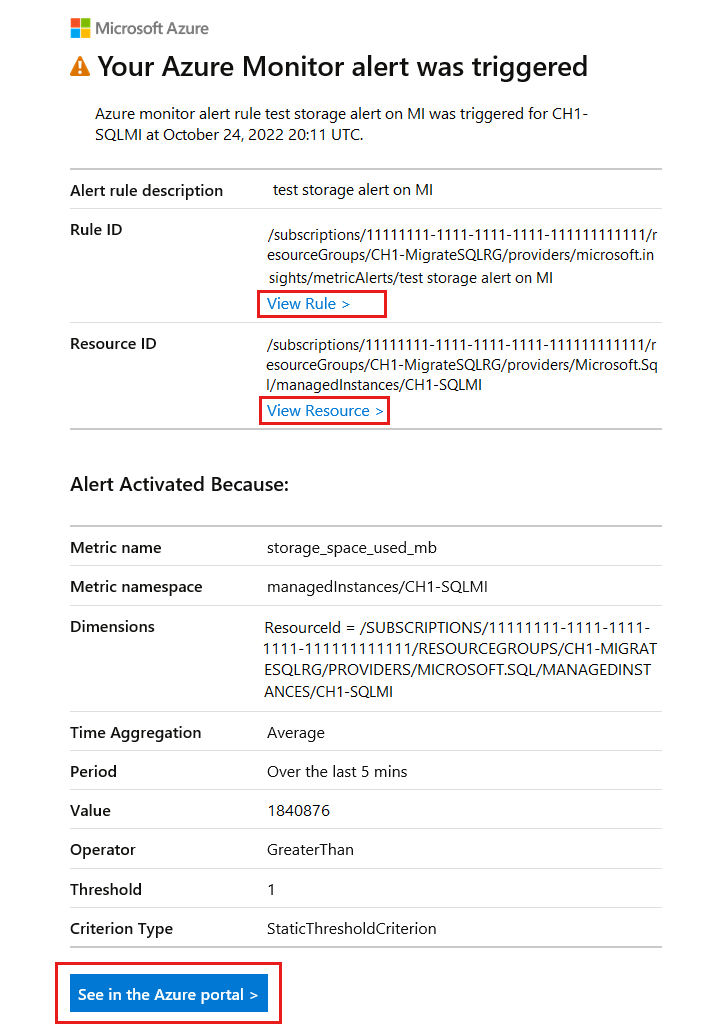
The email shows the alert name, details of the threshold and why the alert was triggered, helping you to verify and troubleshoot your alert.
- Select the See in Azure portal button to view the alert you received via email in the Azure portal.
- Select View Rule > to view or edit the alert rule that triggered the alert.
- Select View Resource > to view the managed instance for which the alert was triggered.
Manage alert rules
Note
Existing alerts need to be managed from the Alerts menu in the Azure portal resource menu. Existing alerts cannot be modified from Managed Instance resource pane.
To view, suspend, activate, modify, and delete existing alerts:
Search for Alerts using Azure portal search. Select Alerts.
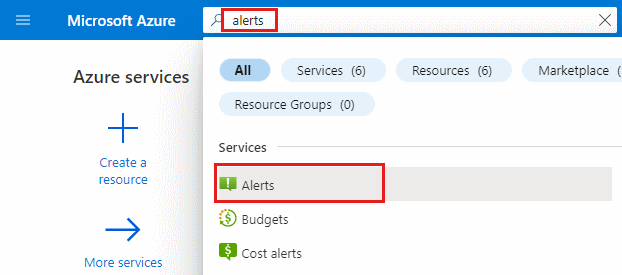
Alternatively, you could also select Alerts on the Azure navigation bar, if you have it configured.
On the Alerts pane, select Alert rules.
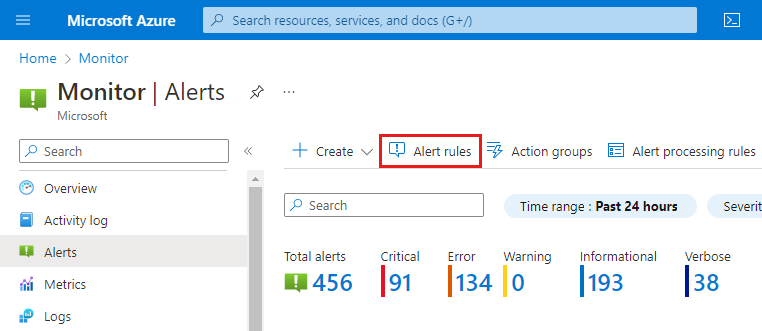
Select an individual existing alert rule to manage it. Existing active rules can be modified and tuned to your preference. Active rules can also be suspended without being deleted.
Related content
Feedback
Coming soon: Throughout 2024 we will be phasing out GitHub Issues as the feedback mechanism for content and replacing it with a new feedback system. For more information see: https://aka.ms/ContentUserFeedback.
Submit and view feedback for